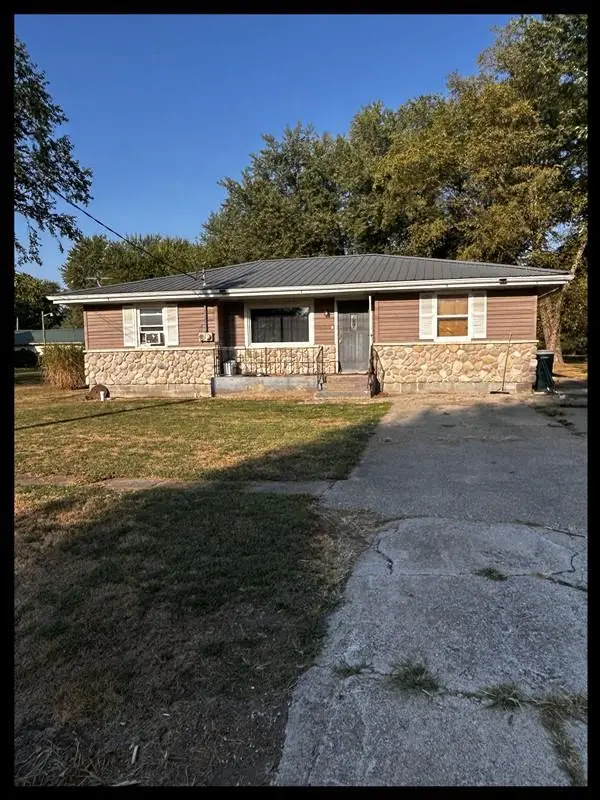
208 N Macon St · Clarence, MO
Flood risk 1/10 · Minimal
- FEMA flood zone
- X (unshaded)
- Chance of flooding over 30 yrs
- 0.0%
- Est. flood insurance / yr
- $507 – $1,088
Fire risk 3/10 · Minor
- Est. fire insurance / yr
- $1,054 – $1,958
Heat risk 3/10 · Minor
- Hot days now (above 106°F)
- 7 days/yr
- Hot days in 30 yrs
- 17 days/yr
Wind risk 2/10 · Minimal
- Chance of severe wind over 30 yrs
- —
Air-quality risk 1/10 · Minimal
- Unhealthy air days now
- 0 days/yr
- Unhealthy air days in 30 yrs
- 0 days/yr
Risk factors via First Street. Map © Google.
Why this score? — see what drove the B+ grade
The composite is a weighted blend of 9 inputs, each scored 0–100. Each bar is that input's sub-score; the figure is the points it added to the 100-point composite (weight × sub-score).
- Cash flow +30.0/30.0
- DSCR +10.0/10.0
- 1% rule +9.8/10.0
- ARV discount +9.1/15.0
- Appreciation +7.6/10.0
- Livability +3.1/5.0
- Schools +2.9/10.0
- Rent growth +2.5/5.0
- Condition / age +2.5/5.0
$69,500
🖨 Deal sheet 📄 Offer letter ✓ Due diligence
Listing remarks MLS
Weather looking for a fixer-upper, a small project, or just something to make an investment on this property would be a good fit! With a large yard, detached garage, possibly two living quarters or third bedroom this property has potential. Call Allison Rowland at 660-651-2051 With Tiger Country Realty.
Key facts
- Large yard
- Detached garage
- Two living quarters
Tags
Neighborhood map
What this means for you Summary
Snapshot
- This is a 2-bed/1.0-bath other listed at $70k.
Deal economics
- At list price, monthly cash flow is $384 ($5k/yr) — positive.
- The deal already cash-flows at list — no discount required.
- Meets the 1% rule at list price ($1k rent vs $70k).
- Recommended offer: $61k (12.0% below list) — sets the bar for market timing.
Location & tenants
- Location reads 61/100 on livability (#442 in MO) — a middle-class / working-renter tenant base. Strengths: cost of living A+, housing A+, crime B+; Watch: schools D-, amenities F, commute F.
- Shelby County R-IV (rural): math 29% / reading 42% proficiency, ranked #224 of 324 in MO (top 69%) — families likely to look elsewhere, expect single-tenant / working-renter base with shorter leases.
- Market conditions: 6 active listings in the ZIP; 4 units permitted in Shelby County in 2024 (0 in 5+ unit buildings).
Forward outlook
- In year one you build about $4k of equity ($481 loan paydown + $4k appreciation (5.3% local appreciation)).
- Shelby County population projected at -26% by 2050 — secular population decline; favor cash flow + early exit over multi-decade hold.
- At projected returns (5.3% appreciation + 3.0% rent growth), your $19k cash investment doubles in ~3 years — after that, you're playing with house money.
- By year 8, paydown + projected appreciation supports a ~$32k cash-out refi (75% LTV) — recoverable capital for the next deal without selling this one.
Negotiation context
- It's been on market 274 days — a 12% lower offer ($61k) is reasonable based on typical stale-listing flexibility.
Questions for the listing agent
- It's been on market 274 days. Have you received any prior offers? Is the seller open to a 12% concession, seller financing, or rate buy-down credit?
- Built in 1965 — when were the roof, HVAC, electrical panel, plumbing, and water heater last replaced?
- Why hasn't it sold? Are there any deal-killer items the seller is aware of (foundation, flood, title, zoning, code violations)?
- Is there a deadline driving the sale (1031 exchange, divorce, estate, relocation)? That informs how much negotiation room exists.
- Schools are D-rated, which usually means shorter tenancies and higher turnover. Who's the typical renter profile here, and what's been the actual vacancy rate?
- What's the average days-on-market for RENTAL listings here right now (not sales)? A rising rental-DOM trend means longer vacancies and softer asking-rent achievability than the comps imply.
- What's the recent tenant-quality profile in this submarket — average credit score on applications, eviction rate, late-payment / NSF rate, and stable-employment percentage? A property-management company in the area should have these aggregated.
- How much new for-sale + rental construction is in the pipeline within 1–3 miles? Heavy new supply typically softens prices + rents 12–24 months out; constrained supply supports both.
Investment metrics
- 1% rule
- 1.48% ✓
- Cap rate
- 12.93%
- Cash-on-cash
- 23.70%
- DSCR
- 2.05
- GRM
- 5.6
CMA / ARV
- ARV (median comp)
- $72,080
- List price
- $69,500
- Delta
- -3.58%
- Verdict
- FAIR
- Comps
- 3 within 1.0 mi
Projected returns pro-forma
5.27% appreciation · 3.0% rent growth · sell at horizon
- IRR
- 34.0%
- Equity multiple
- 3.14×
- Total profit
- $41,567
- Equity at exit
- $40,542
- IRR
- 32.2%
- Equity multiple
- 6.34×
- Total profit
- $103,984
- Equity at exit
- $70,947
Cash invested: $19,460 (down + closing). Projections, not guarantees.
Landlord ↔ Tenant lean methodology
- Overall (STATE)
- 81 Strongly Landlord-Friendly
- State Missouri
- 81 Strongly Landlord-Friendly · R+10
- County
- — inherits STATE
- City
- — inherits STATE
ZIP-level market 63437
- Home prices YoY
- 1.9%
- Active inventory
- 6
- Price-to-rent
- 5.6×
Monthly cashflow live
- Estimated rent
- $1,028 medium interval (Pro) →
- Mortgage (P&I)
- −$364
- Tax from tax record
- −$34 /mo · $408/yr
- Insurance
- −$29
- HOA
- −$0
- Vacancy / Maint / Mgmt
- −$216
- Net cashflow
- $384
Break-even live
UW: 25.0% down · 7.5% · 30yr · 1.5% tax · 5.0% vac · 8.0% maint · 8.0% mgmt
Financing live
Cash to close
- Down payment
- $17,375
- Closing costs
- $2,085
- Reserves months
- —
- Total cash needed
- —
Loan-product check · same deal, 3 products live
Conventional
25% down · 7.5% · 30yr
- Down + closing
- —
- Monthly P&I
- —
- Monthly cashflow
- —
- DSCR
- —
- Eligible?
- —
Personal DTI + credit; lowest rate.
DSCR
20% down · 8.5% · 30yr
- Down + closing
- —
- Monthly P&I
- —
- Monthly cashflow
- —
- DSCR
- —
- Eligible?
- —
No personal income docs; deal must DSCR.
Hard money
10% down · 12.0% · 12mo
- Down + closing
- —
- Monthly P&I
- —
- Monthly cashflow
- —
- DSCR
- —
- Eligible?
- —
Short-term bridge; refi at stabilization.
Listing history 17 events
-
2026-06-18days on market $69,500 Active 274 DOM
-
2026-06-17days on market $69,500 Active 273 DOM
-
2026-06-16days on market $69,500 Active 272 DOM
-
2026-06-15days on market $69,500 Active 271 DOM
-
2026-06-13days on market $69,500 Active 269 DOM
-
2026-06-12days on market $69,500 Active 268 DOM
-
2026-06-09days on market $69,500 Active 265 DOM
-
2026-06-08days on market $69,500 Active 264 DOM
-
2026-06-07days on market $69,500 Active 263 DOM
-
2026-06-05days on market $69,500 Active 261 DOM
-
2026-06-04days on market $69,500 Active 259 DOM
-
2026-06-02days on market $69,500 Active 258 DOM
-
2026-06-01days on market $69,500 Active 257 DOM
-
2026-05-31days on market $69,500 Active 256 DOM
-
2026-03-05price $69,500 304-char remark
Show marketing remark (304 chars)
Weather looking for a fixer-upper, a small project, or just something to make an investment on this property would be a good fit! With a large yard, detached garage, possibly two living quarters or third bedroom this property has potential. Call Allison Rowland at 660-651-2051 With Tiger Country Realty.
-
2025-10-06price $79,500 304-char remark
Show marketing remark (304 chars)
Weather looking for a fixer-upper, a small project, or just something to make an investment on this property would be a good fit! With a large yard, detached garage, possibly two living quarters or third bedroom this property has potential. Call Allison Rowland at 660-651-2051 With Tiger Country Realty.
-
2025-09-17$84,500 Active 304-char remark
Show marketing remark (304 chars)
Weather looking for a fixer-upper, a small project, or just something to make an investment on this property would be a good fit! With a large yard, detached garage, possibly two living quarters or third bedroom this property has potential. Call Allison Rowland at 660-651-2051 With Tiger Country Realty.
ⓘ Source: listings_history table (triggers on properties + properties_extension) + one-shot
backfill from property_details.listing_events for pre-trigger history.
Tax reassessment forecast MO · Resets to sale price
- Current annual tax
- $408 · $34/mo
- Projected year-2 tax
- $674 · $56/mo
- Expected delta
- +$266/yr (+$22/mo · 65.2%)
ⓘ Screening estimate from a state-policy table — verify with the county assessor before closing.
Climate risk First Street
- Flood 1/10 Low FEMA zone X (unshaded) · 0% chance over 30 yrs
- Wildfire 3/10 Moderate
- Heat 3/10 Moderate 7 d/yr ≥106°F today · 17 d/yr by 30 yrs out
- Wind 2/10 Low
- Air quality 1/10 Low 0 unhealthy d/yr today · 0 by 30 yrs out
Nearby sold comps map
Loading sold comps map…
Walkable amenities ~0.75 mi
Loading nearby amenities…
Taxation est. · year 1
- Rental income
- $12,330
- − Mortgage interest
- −$3,893
- − Property taxes
- −$408
- − Insurance
- −$348
- − Repairs & maintenance
- −$986
- − Management
- −$986
- − Depreciation
- −$2,022
- Taxable income
- $3,687
- Est. tax owed @ 24.0%
- −$885
- After-tax cash flow
- $3,727/yr
For passive investors: Depreciation is non-cash, so a rental often shows a tax loss while cash-flowing — sheltering income. Rental losses are passive: they offset passive income freely, and up to $25,000/yr can offset ordinary (W-2) income if you actively participate and your MAGI is under $100k (phasing out to $0 by $150k); unused losses carry forward. On sale, claimed depreciation is recaptured at up to 25%, and gains may owe capital-gains tax (a 1031 exchange can defer both). Figures are a year-1 estimate at your 24.0% rate — not tax advice; consult a CPA.
Schools (NCES district)
- District
- Shelby County R-IV
- NCES district ID
- 2928110
- Math proficiency
- 29% ▼ -10.00%
- Reading proficiency
- 42% ▼ -3.00%
- Median HH income
- $36,627
- Composite
- 29.44/100
- National rank
- #6517
- State rank
- #224 of 324 in MO
Livability — Clarence
- Score
- 61/100
- State rank
- #442
- US rank
- #18045
Category grades
Schools grade is shown separately in the Schools card above.
Census & demographics
- Census place
- Clarence, MO
- Population (ZIP)
- 1,558
Population outlook (Shelby County) Hauer SSP2
- Today (2025)
- 5,663 people
- By 2030
- 5,352 · -5.5%
- By 2040
- 4,762 · -15.9%
- By 2050
- 4,200 · -25.8%
- By 2075
- 3,058 · -46.0%
- By 2100
- 2,166 · -61.8%
Race, ethnicity, and origin ACS 2023
- Neighborhood character
- Predominantly White (93%)
- Race & ethnicity
- White 93% Hispanic / Latino 2% Two or more races 2% Black 2% Asian 1%
- Common ancestry
- Lithuanian 2% Iranian 1% Slovak 1%
- Foreign-born
- 2% · Canada
- Languages at home
- 97% English-only · Spanish 2% Other Asian/Pacific 1%
Political lean MEDSL · Shelby
- 2024 margin
- Solid R (+65.6) · D 16.9% · R 82.5%
- 2008→2024 swing
- -33.9pp toward R · 2008: -31.7pp · 2024: -65.6pp
- All cycles
- 2024: R+65.6 2020: R+62.9 2016: R+59.0 2012: R+37.8 2008: R+31.7
Not yet ingested
- Civics
- —
Market trends
- HPI YoY
- ▲ 5.27%
- Current HPI
- 278.0846
- Rent YoY
- —
- Metro
- —
- State GDP YoY
- ▲ 1.84%
- F500 in state
- 20
Industry mix (Fortune 500 HQ in MO)
| Industry | F500 HQs | Revenue |
|---|---|---|
| Healthcare | 1 | $163B |
|
||
| Insurance | 1 | $21B |
|
||
| Industrial Technology | 1 | $17B |
|
||
| Retail | 1 | $16B |
|
||
| Industrial Distribution | 1 | $10B |
|
||
| Utilities | 1 | $9B |
|
||
Price history
-17.8% since first listed3 events — show timeline
- 2026-03-05 Price Changed $69,500 NECAR
- 2025-10-06 Price Changed $79,500 NECAR
- 2025-09-17 Listed $84,500 NECAR
Property tax history
+2.2%/yrLatest (2025): $408 · +12.1% YoY. Source: county tax records.
Cash-flow waterfall
monthlySold comps — $/sqft
last 12 mo · ≤1 miLoading sold comps…