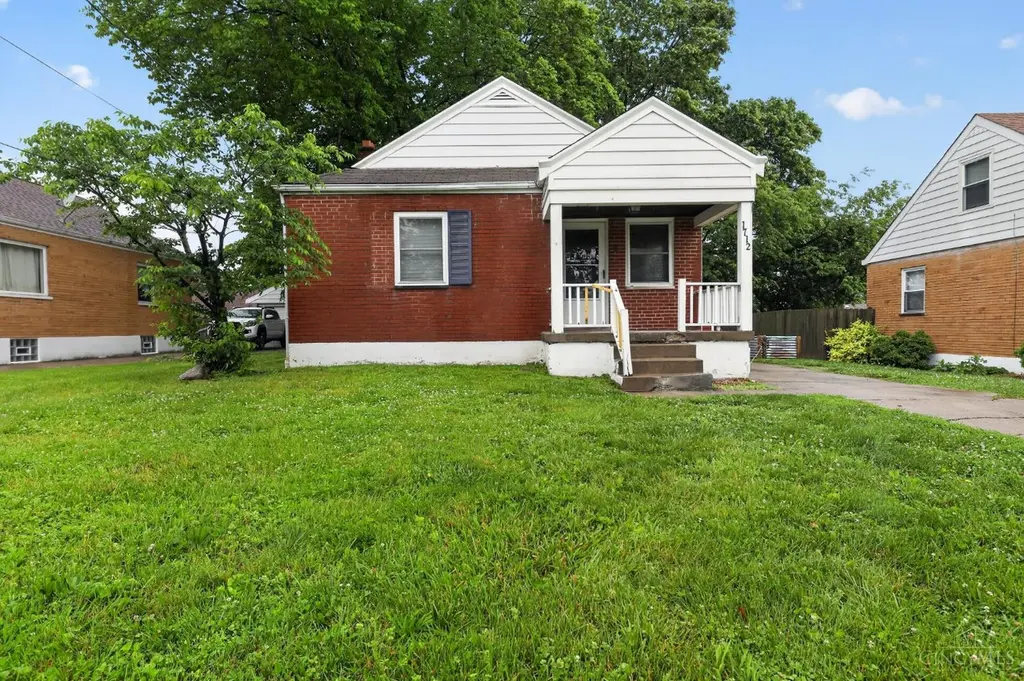
1712 Norcol Ln · North College Hill, OH
Flood risk 1/10 · Minimal
- FEMA flood zone
- X (unshaded)
- Chance of flooding over 30 yrs
- 0.0%
- Est. flood insurance / yr
- $473 – $860
Fire risk 1/10 · Minimal
- Est. fire insurance / yr
- $713 – $1,323
Heat risk 4/10 · Minor
- Hot days now (above 103°F)
- 7 days/yr
- Hot days in 30 yrs
- 19 days/yr
Wind risk 2/10 · Minimal
- Chance of severe wind over 30 yrs
- 1.0%
Air-quality risk 2/10 · Minimal
- Unhealthy air days now
- 1 days/yr
- Unhealthy air days in 30 yrs
- 1 days/yr
Risk factors via First Street. Map © Google.
Why this score? — see what drove the C+ grade
The composite is a weighted blend of 9 inputs, each scored 0–100. Each bar is that input's sub-score; the figure is the points it added to the 100-point composite (weight × sub-score).
- Cash flow +21.2/30.0
- ARV discount +15.0/15.0
- DSCR +6.8/10.0
- 1% rule +5.6/10.0
- Rent growth +4.2/5.0
- Livability +3.7/5.0
- Condition / age +2.5/5.0
- Schools +1.5/10.0
- Appreciation +0.0/10.0
$144,900
🖨 Deal sheet 📄 Offer letter ✓ Due diligence
Listing remarks MLS
Excellent opportunity with this 2 bedroom brick ranch home. Some past updating. Wood floors. Part finished basement with 1/2 bath. Sold as is no disclosures. Approved for Homepath financing.
Key facts
- Cincinnati location
- Updated feel
- Natural light
Tags
Property features AI
Finance
- HOA & community: No HOA
Exterior
- Parking: Driveway
- Utilities: Public water; Public sewer; Natural gas
- Home design: Traditional single-family home; One story; Residential zoning
- Construction: Brick construction; Poured foundation; Shingle roof
- Exterior features: Insulated windows
Interior
- Kitchen: Dishwasher; Microwave; Oven/Range; Refrigerator
- Bedrooms: 2 bedrooms, both on the main level
- Bathrooms: 1 full bathroom on the main level; 1 half bathroom
- Heating & cooling: Forced air heating; Central air conditioning; Electric water heater
- Interior features: Full basement; 4 total rooms
Neighborhood map
What this means for you Summary
Snapshot
- This is a 2-bed/1.5-bath single-family listed at $145k.
Deal economics
- At list price, monthly cash flow is $211 ($3k/yr) — positive.
- The deal already cash-flows at list — no discount required.
- Meets the 1% rule at list price ($2k rent vs $145k).
- Recommended offer: $143k (1.5% below list) — sets the bar for market timing.
- Cap rate 8.0% vs local median 6.5% in North College Hill — meaningfully above typical; check what's discounted (condition, days-on-market, listing class) to confirm the premium yield is real.
Location & tenants
- Location reads 74/100 on livability (#288 in OH, #4,745 nationally) — a middle-class / working-renter tenant base. Strengths: commute A+, cost of living A+, housing A+; Watch: employment C-, schools D+, amenities D.
- North College Hill City (suburban): math 13% / reading 22% proficiency, ranked #637 of 656 in OH (top 97%) — low school quality limits family demand, transient renter base, plan for 1-2y turnover; 75% free/reduced lunch — lower-income household profile, screen leases tightly.
- Market conditions: Rents rising fast (+6.9%/yr); 85 active listings in the ZIP; 15 comparable units currently listed for rent nearby; rentals at typical pace (median 24d on market — plan ~3-4 weeks tenant-placement turnaround); 801 units permitted in Hamilton County in 2024 (190 in 5+ unit buildings).
Forward outlook
- Local home prices are declining (-3.0%/yr); year-one equity from $1k of loan paydown is wiped out by about $4k of value loss. Plan a longer hold.
- At projected returns (-3.0% appreciation + 6.9% rent growth), your $41k cash investment doubles in ~10 years — after that, you're playing with house money.
Negotiation context
- It's been on market 20 days — a 2% lower offer ($143k) is reasonable based on typical stale-listing flexibility.
- 7 sale attempts since 27y ago with the ask held roughly flat each time — persistent listings suggest the price (not the market) is what's stuck; bring a comps-based counter.
Risks & watch-outs
- Watch-outs: built in 1951 — expect roof / HVAC / electrical / plumbing capex.
Questions for the listing agent
- Built in 1951 — when were the roof, HVAC, electrical panel, plumbing, and water heater last replaced?
- Is there a deadline driving the sale (1031 exchange, divorce, estate, relocation)? That informs how much negotiation room exists.
- Schools are D-rated, which usually means shorter tenancies and higher turnover. Who's the typical renter profile here, and what's been the actual vacancy rate?
- Crime grade is F in this area — have there been break-ins, vandalism, or insurance claims at this property in the last 3 years? What carrier currently insures it and at what premium?
- What's the average days-on-market for RENTAL listings here right now (not sales)? A rising rental-DOM trend means longer vacancies and softer asking-rent achievability than the comps imply.
- What's the recent tenant-quality profile in this submarket — average credit score on applications, eviction rate, late-payment / NSF rate, and stable-employment percentage? A property-management company in the area should have these aggregated.
- How much new for-sale + rental construction is in the pipeline within 1–3 miles? Heavy new supply typically softens prices + rents 12–24 months out; constrained supply supports both.
Investment metrics
- 1% rule
- 1.06% ✓
- Cap rate
- 8.04%
- Cash-on-cash
- 6.24%
- DSCR
- 1.28
- GRM
- 7.9
CMA / ARV
- ARV (on-the-fly)
- $182,172
- Comps found
- 12
Show comp detail 12 sales within ~0.75 mi
| Address | Dist | Beds/Ba | Sqft | Sold | Price | $/sf | Match |
|---|---|---|---|---|---|---|---|
| 6948 Mulberry St | 0.42mi | 2/1.5 | 1,320 (+2%) | 3mo | $195,500 | $148 | 74 |
| 1615 Joseph Ct | 0.15mi | 3/1.0 (+1) | 1,203 (-7%) | 5mo | $199,000 | $165 | 70 |
| 6916 Noble Ave | 0.43mi | 2/2.5 | 1,366 (+6%) | 2mo | $180,000 | $132 | 65 |
| 6942 Gloria Dr | 0.52mi | 2/1.5 | 1,363 (+6%) | 3mo | $148,000 | $109 | 64 |
| 6822 Betts Ave | 0.53mi | 2/1.0 | 1,182 (-8%) | 2mo | $128,000 | $108 | 58 |
| 7010 Noble Ct | 0.30mi | 2/1.0 | 1,100 (-15%) | 4mo | $129,000 | $117 | 56 |
| 1708 De Armand Ave | 0.58mi | 2/1.0 | 1,415 (+10%) | 2mo | $222,500 | $157 | 54 |
| 6623 Betts Ave | 0.74mi | 3/1.0 (+1) | 1,242 (-4%) | 0mo | $140,000 | $113 | 52 |
| 1980 Stevens Ave | 0.52mi | 3/1.5 (+1) | 1,450 (+12%) | 2mo | $230,000 | $159 | 49 |
| 1944 Dallas Ave | 0.69mi | 3/1.0 (+1) | 1,199 (-7%) | 2mo | $199,500 | $166 | 47 |
| 1481 St Clair Ave | 0.57mi | 3/1.0 (+1) | 1,136 (-12%) | 3mo | $160,000 | $141 | 44 |
| 2048 W Galbraith Rd | 0.70mi | 2/1.5 | 1,469 (+14%) | 2mo | $199,000 | $135 | 43 |
Match score weights: distance 35% · size 25% · config 20% · recency 20%. Top-matched comps best support the ARV.
Projected returns pro-forma
-3.0% appreciation · 6.92% rent growth · sell at horizon
- IRR
- -2.3%
- Equity multiple
- 0.91×
- Total profit
- $-3,726
- Equity at exit
- $21,605
- IRR
- 11.2%
- Equity multiple
- 2.04×
- Total profit
- $42,180
- Equity at exit
- $12,528
Cash invested: $40,572 (down + closing). Projections, not guarantees.
Landlord ↔ Tenant lean methodology
- Overall (STATE)
- 73 Landlord-Friendly
- State Ohio
- 73 Landlord-Friendly · R+6
- County
- — inherits STATE
- City
- — inherits STATE
ZIP-level market 45231
- Rents YoY
- 6.9%
- Active inventory
- 85
- Price-to-rent
- 7.9×
Monthly cashflow live
- Estimated rent
- $1,537 high interval (Pro) →
- Mortgage (P&I)
- −$760
- Tax from tax record
- −$183 /mo · $2,199/yr
- Insurance
- −$60
- HOA
- −$0
- Vacancy / Maint / Mgmt
- −$323
- Net cashflow
- $211
Break-even live
UW: 25.0% down · 7.5% · 30yr · 1.5% tax · 5.0% vac · 8.0% maint · 8.0% mgmt
Financing live
Cash to close
- Down payment
- $36,225
- Closing costs
- $4,347
- Reserves months
- —
- Total cash needed
- —
Loan-product check · same deal, 3 products live
Conventional
25% down · 7.5% · 30yr
- Down + closing
- —
- Monthly P&I
- —
- Monthly cashflow
- —
- DSCR
- —
- Eligible?
- —
Personal DTI + credit; lowest rate.
DSCR
20% down · 8.5% · 30yr
- Down + closing
- —
- Monthly P&I
- —
- Monthly cashflow
- —
- DSCR
- —
- Eligible?
- —
No personal income docs; deal must DSCR.
Hard money
10% down · 12.0% · 12mo
- Down + closing
- —
- Monthly P&I
- —
- Monthly cashflow
- —
- DSCR
- —
- Eligible?
- —
Short-term bridge; refi at stabilization.
Rent comps 15 comps
| Address | Beds | Baths | Sqft | Rent | $/sqft | DOM | Units | Dist |
|---|---|---|---|---|---|---|---|---|
| 1740 Bising Ave North College Hill, OH | 3.0 | 2.0 | 1235 | $1,697 | $1.37 | 1d | 6 | 0.24mi |
| 1667 Lakenoll Dr Mt Healthy, OH | 1.0–2.0 | 1.0–1.5 | 817 | $1,385 | $1.69 | 3d | 7 | 0.28mi |
| 1837 W Galbraith Rd Cincinnati, OH | 2.0 | 2.0 | 1087 | $1,500 | $1.38 | 23d | 1 | 0.44mi |
| 1604 W Galbraith Rd Unit F North College Hill, OH | 2.0 | 1.0 | 1250 | $1,150 | $0.92 | 14d | 1 | 0.45mi |
| 7601 Hamilton Ave Unit 2-3 Cincinnati, OH | 2.0 | 1.0 | 1250 | $2,000 | $1.60 | 23d | 1 | 0.65mi |
| 1522 Kinney Ave Cincinnati, OH | 3.0 | 1.0 | 1282 | $1,095 | $0.85 | 23d | 1 | 0.69mi |
| 1522 Kinney Ave Cincinnati, OH | 3.0 | 1.0 | 1282 | $1,695 | $1.32 | 17d | 1 | 0.69mi |
| 1804 Waltham Ave Cincinnati, OH | 2.0 | 1.0 | 1186 | $1,425 | $1.20 | 7d | 1 | 0.80mi |
| 8879 Zodiac Dr Cincinnati, OH | 3.0 | 2.0 | 1040 | $1,781 | $1.71 | 23d | 1 | 0.85mi |
| 1834 Emerson Ave Cincinnati, OH | 2.0 | 1.0 | 1187 | $1,500 | $1.26 | 23d | 1 | 0.87mi |
| 7701 Clovernook Ave Cincinnati, OH | 1.0–2.0 | 1.0–1.5 | 787 | $1,365 | $1.73 | 23d | 1 | 1.09mi |
| 8565 Daly Rd Unit 8565 5 Cincinnati, OH | 2.0 | 1.0 | 1100 | $1,299 | $1.18 | 23d | 1 | 1.21mi |
| 9029 Daly Rd Unit 8963 Cincinnati, OH | 3.0 | 2.5 | 1315 | $1,771 | $1.35 | 21d | 1 | 1.32mi |
| 1720 W North Bend Rd Cincinnati, OH | 3.0 | 1.0 | 900 | $1,400 | $1.56 | 23d | 1 | 1.42mi |
| 6211 Hamilton Ave Cincinnati, OH | 2.0 | 1.0–2.0 | 842 | $1,968 | $2.34 | 1d | 17 | 1.44mi |
Listing history 13 events
-
2026-06-18status $144,900 Active 20 DOM
-
2026-06-18days on market $144,900 Contingency Pending 20 DOM
-
2026-06-17days on market $144,900 Contingency Pending 19 DOM
-
2026-06-16days on market $144,900 Contingency Pending 18 DOM
-
2026-06-15days on market $144,900 Contingency Pending 17 DOM
-
2026-06-13days on market $144,900 Contingency Pending 15 DOM
-
2026-06-09days on market $144,900 Contingency Pending 11 DOM
-
2026-06-08statusdays on market $144,900 Contingency Pending 10 DOM
-
2026-06-07days on market $144,900 Active 9 DOM
-
2026-06-03days on market $144,900 Active 5 DOM
-
2026-06-02days on market $144,900 Active 4 DOM
-
2026-06-01days on market $144,900 Active 3 DOM
-
2026-05-31days on market $144,900 Active 2 DOM
ⓘ Source: listings_history table (triggers on properties + properties_extension) + one-shot
backfill from property_details.listing_events for pre-trigger history.
Tax reassessment forecast OH · Partial reset (capped growth)
- Current annual tax
- $2,199 · $183/mo
- Projected year-2 tax
- $2,230 · $186/mo
- Expected delta
- +$31/yr (+$3/mo · 1.4%)
ⓘ Screening estimate from a state-policy table — verify with the county assessor before closing.
Climate risk First Street
- Flood 1/10 Low FEMA zone X (unshaded) · 0% chance over 30 yrs
- Wildfire 1/10 Low
- Heat 4/10 Moderate 7 d/yr ≥103°F today · 19 d/yr by 30 yrs out
- Wind 2/10 Low 100% chance of damaging wind over 30 yrs
- Air quality 2/10 Low 1 unhealthy d/yr today · 1 by 30 yrs out
Nearby sold comps map
Loading sold comps map…
Walkable amenities ~0.75 mi
Loading nearby amenities…
Taxation est. · year 1
- Rental income
- $18,446
- − Mortgage interest
- −$8,117
- − Property taxes
- −$2,199
- − Insurance
- −$724
- − Repairs & maintenance
- −$1,476
- − Management
- −$1,476
- − Depreciation
- −$4,215
- Taxable income
- $239
- Est. tax owed @ 24.0%
- −$57
- After-tax cash flow
- $2,473/yr
For passive investors: Depreciation is non-cash, so a rental often shows a tax loss while cash-flowing — sheltering income. Rental losses are passive: they offset passive income freely, and up to $25,000/yr can offset ordinary (W-2) income if you actively participate and your MAGI is under $100k (phasing out to $0 by $150k); unused losses carry forward. On sale, claimed depreciation is recaptured at up to 25%, and gains may owe capital-gains tax (a 1031 exchange can defer both). Figures are a year-1 estimate at your 24.0% rate — not tax advice; consult a CPA.
Schools (NCES district)
- District
- North College Hill City
- NCES district ID
- 3904451
- Math proficiency
- 13% ▼ -14.00%
- Reading proficiency
- 22% ▼ -11.00%
- Median HH income
- $40,355
- Composite
- 14.89/100
- National rank
- #9375
- State rank
- #637 of 656 in OH
Livability — North College Hill
- Score
- 74/100
- State rank
- #288
- US rank
- #4745
Category grades
Schools grade is shown separately in the Schools card above.
Census & demographics
- Census place
- North College Hill, OH
- County
- Hamilton County · 701,295 people
- Metro
- Cincinnati, OH-KY-IN
- Population (ZIP)
- 40,463
- Household income
- $71,353
- Rent vs Own
- Severe rent burden
- 846.0
Population outlook (Hamilton County) Hauer SSP2
- Today (2025)
- 826,054 people
- By 2030
- 830,947 · +0.6%
- By 2040
- 832,319 · +0.8%
- By 2050
- 822,428 · -0.4%
- By 2075
- 788,688 · -4.5%
- By 2100
- 710,674 · -14.0%
Race, ethnicity, and origin ACS 2023
- Neighborhood character
- Diverse neighborhood (Simpson 0.61)
- Race & ethnicity
- White 47% Black 40% Two or more races 8% Hispanic / Latino 3% Asian 2%
- Common ancestry
- Lithuanian 1% Slovak 1% Iranian 1%
- Foreign-born
- 5% · Canada, India
- Languages at home
- 94% English-only · Spanish 2% Other Indo-European 1% French/Haitian/Cajun 1%
Political lean MEDSL · Hamilton
- 2024 margin
- D (+14.9) · D 57.0% · R 42.1%
- 2008→2024 swing
- +7.9pp toward D · 2008: 7.0pp · 2024: 14.9pp
- All cycles
- 2024: D+14.9 2020: D+15.9 2016: D+9.5 2012: D+4.9 2008: D+7.0
Not yet ingested
- Civics
- —
Market trends
- HPI YoY
- ▼ -181.25%
- Current HPI
- 228.2912
- Rent YoY
- ▲ 6.92%
- Metro
- Cincinnati, OH-KY-IN
- State GDP YoY
- ▲ 1.98%
- F500 in state
- 48
Industry mix (Fortune 500 HQ in OH)
| Industry | F500 HQs | Revenue |
|---|---|---|
| Insurance | 3 | $145B |
|
||
| Industrial Machinery | 3 | $49B |
|
||
| Financial Services | 3 | $24B |
|
||
| Consumer Goods | 2 | $93B |
|
||
| Aerospace / Defense | 2 | $47B |
|
||
| Utilities | 2 | $33B |
|
||
Price history
+271.5% since first listed20 events — show timeline
- 2026-05-29 Listed $144,900 Cincy MLS
- 2024-12-06 Sold (Public Records) $10,723,000 Public Records
- 2018-07-31 Sold (Public Records) $1,680,600 Public Records
- 2012-10-12 Sold (MLS) $35,000 Cincy MLS
- 2012-08-09 Listed $37,000 Cincy MLS
- 2006-11-27 Sold (Public Records) $99,500 Public Records
- 2006-08-23 Sold (MLS) $75,125 Cincy MLS
- 2006-05-26 Listed $75,000 Cincy MLS
- 2005-07-16 Listing Removed — Cincy MLS
- 2005-03-15 Listed $105,800 Cincy MLS
- 2003-07-17 Sold (Public Records) $104,000 Public Records
- 2003-07-03 Sold (MLS) $104,000 Cincy MLS
- 2003-05-21 Listed $103,500 Cincy MLS
- 2003-05-19 Listing Removed — Cincy MLS
- 2003-04-14 Listed $103,900 Cincy MLS
- 1999-12-08 Sold (Public Records) $89,500 Public Records
- 1999-11-30 Sold (MLS) $89,500 Cincy MLS
- 1999-10-04 Listed $89,900 Cincy MLS
- 1995-02-01 Sold (Public Records) $55,000 Public Records
- 1985-05-01 Sold (Public Records) $39,000 Public Records
Property tax history
+9.8%/yrLatest (2025): $2,199 · +0.0% YoY. Source: county tax records.
Cash-flow waterfall
monthlySold comps — $/sqft
last 12 mo · ≤1 miLoading sold comps…