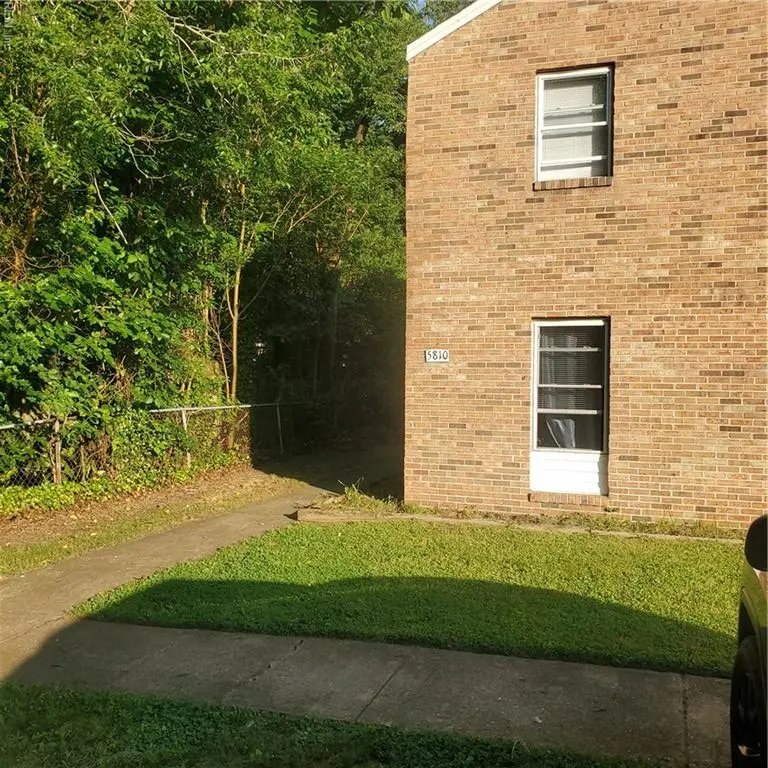
5810 Layton St · Norfolk, VA
Flood risk 1/10 · Minimal
- FEMA flood zone
- X (unshaded)
- Chance of flooding over 30 yrs
- 0.0%
- Est. flood insurance / yr
- —
Fire risk No data
- Est. fire insurance / yr
- —
Heat risk 9/10 · Severe
- Hot days now (above 105°F)
- 7 days/yr
- Hot days in 30 yrs
- 16 days/yr
Wind risk 8/10 · Major
- Chance of severe wind over 30 yrs
- 80.0%
Air-quality risk No data
- Unhealthy air days now
- —
- Unhealthy air days in 30 yrs
- —
Risk factors via First Street. Map © Google.
Why this score? — see what drove the C- grade
The composite is a weighted blend of 9 inputs, each scored 0–100. Each bar is that input's sub-score; the figure is the points it added to the 100-point composite (weight × sub-score).
- Cash flow +19.8/30.0
- ARV discount +9.0/15.0
- DSCR +6.3/10.0
- 1% rule +4.5/10.0
- Livability +4.2/5.0
- Rent growth +3.9/5.0
- Schools +3.5/10.0
- Condition / age +2.5/5.0
- Appreciation +0.0/10.0
$235,000
🖨 Deal sheet (PDF) 📄 Offer letter ✓ Due diligence
Listing remarks
Investor Special- 3 bedrooms, 2.5 baths end unit townhouse located in the Lake Edward community. Spacious living area featuring large dining room attached to kitchen that overlooks the back deck. Renovated Half bath and laundry room with washer and dryer located on the first floor. 3 bedrooms and 2 full baths upstairs. Newer windows and newer water heater are just a few listed upgrades. Very private backyard setting. No HOA fees. SOLD AS IS. Priced for a quick closing.
Key facts
- Large dining room
- Laundry room
- Renovated half bath
Tags
Property features AI
Finance
- HOA & community: No HOA or POA monthly fees listed
Exterior
- Parking: Driveway spaces for multiple cars (2 spaces listed)
- Utilities: City/County water; City/County sewer; Electric water heater
- Home design: Attached townhouse; End unit; Two stories; Slab foundation
- Construction: Brick siding; Composite roof
- Exterior features: Corner lot; Cul-de-sac location; Wooded setting; Back yard chain link fence
Interior
- Kitchen: Electric range; Refrigerator; Dishwasher
- Bedrooms: Master bedroom; Additional bedroom; No bedroom and full bathroom on the first floor
- Flooring: Carpet; Ceramic; Laminate
- Bathrooms: Two full bathrooms; One half bathroom
- Heating & cooling: Heat pump
- Interior features: Carpet, ceramic, and laminate flooring; Foyer
- Laundry & utility: Washer; Dryer; Dryer hookup; Utility room
Neighborhood map
What this means for you Summary
Snapshot
- This is a 3-bed/2.5-bath townhouse listed at $235k.
Deal economics
- At list price, monthly cash flow is $281 ($3k/yr) — positive.
- The deal already cash-flows at list — no discount required.
- To meet the 1% rule (rent ≥ 1% of price), the offer needs to be $223k (5.2% below list).
- Recommended offer: $223k (5.2% below list) — sets the bar for 1% rule.
- Cap rate 7.7% vs local median 4.0% in Norfolk — top-decile yield for the area; either an underpriced asset or a hidden risk that comps aren't pricing in. Stress-test before assuming the spread holds.
Location & tenants
- Location reads 83/100 on livability (#43 in VA, #1,026 nationally) — a professional / high-income tenant draw. Strengths: amenities A+, commute A+, health & safety A+; Watch: employment C-, crime F.
- Norfolk City Public School District (urban): math 27% / reading 56% proficiency, ranked #118 of 131 in VA (top 90%) — families likely to look elsewhere, expect single-tenant / working-renter base with shorter leases.
- Zoned schools: Norview Elementary (math 17% / reading 47%, grade F, #992 of 1,108 statewide, top 90%, 395 students, 98% FRL); Lake Taylor (math 22% / reading 45%, grade F, #984 of 1,108 statewide, top 89%, 626 students, 96% FRL); Lake Taylor High (math 38% / reading 72%, grade C, #279 of 319 statewide, top 88%, 1,030 students, 92% FRL) — zoned schools average 95% FRL vs 59% district-wide (37 pts higher); higher-poverty schools than district average — tighter screening recommended.
- Market conditions: Rents rising fast (+5.6%/yr); 229 active listings in the ZIP; 40 comparable units currently listed for rent nearby; rentals at typical pace (median 20d on market — plan ~3-4 weeks tenant-placement turnaround); 438 units permitted in Norfolk city in 2024 (273 in 5+ unit buildings).
- This rent runs 39% of the median local income ($69k/yr) — at the standard rent-burdened threshold; future hikes will face affordability resistance.
Forward outlook
- Local home prices are declining (-3.0%/yr); year-one equity from $2k of loan paydown is wiped out by about $7k of value loss. Plan a longer hold.
Negotiation context
- It's been on market 22 days — a 2% lower offer ($231k) is reasonable based on typical stale-listing flexibility.
Risks & watch-outs
- Climate carrying-cost: severe wind risk, 80% chance of damaging wind over 30y; extreme-heat days projected 7→16/yr by 2055 (HVAC capex compounding) — expect insurance premiums to compound above CPI over the hold.
Questions for the listing agent
- Built in 1971 — when were the roof, HVAC, electrical panel, plumbing, and water heater last replaced?
- Is there a deadline driving the sale (1031 exchange, divorce, estate, relocation)? That informs how much negotiation room exists.
- Schools are A-rated — typically a magnet for longer-tenancy family renters. What's the average tenant stay here, and is there a school-zone premium baked into asking?
- Crime grade is F in this area — have there been break-ins, vandalism, or insurance claims at this property in the last 3 years? What carrier currently insures it and at what premium?
- What's the average days-on-market for RENTAL listings here right now (not sales)? A rising rental-DOM trend means longer vacancies and softer asking-rent achievability than the comps imply.
- What's the recent tenant-quality profile in this submarket — average credit score on applications, eviction rate, late-payment / NSF rate, and stable-employment percentage? A property-management company in the area should have these aggregated.
- How much new for-sale + rental construction is in the pipeline within 1–3 miles? Heavy new supply typically softens prices + rents 12–24 months out; constrained supply supports both.
Investment metrics
- 1% rule
- 0.95% ✗
- Cap rate
- 7.73%
- Cash-on-cash
- 5.13%
- DSCR
- 1.23
- GRM
- 8.8
CMA / ARV
- ARV (median comp)
- $242,972
- List price
- $235,000
- Delta
- -3.28%
- Verdict
- FAIR
- Comps
- 20 within 1.0 mi
Show comp detail 12 sales within ~0.75 mi
| Address | Dist | Beds/Ba | Sqft | Sold | Price | $/sf | Match |
|---|---|---|---|---|---|---|---|
| 601 Lake Edward Dr | 0.09mi | 3/2.5 | 1,512 (0%) | 2mo | $242,000 | $160 | 94 |
| 700 Lake Edward Dr | 0.25mi | 3/2.5 | 1,512 (0%) | 2mo | $269,900 | $179 | 87 |
| 602 Red Horse Ln | 0.23mi | 3/1.5 | 1,510 (-0%) | 2mo | $251,000 | $166 | 84 |
| 617 Red Horse Ln | 0.25mi | 3/1.5 | 1,466 (-3%) | 1mo | $245,000 | $167 | 79 |
| 634 Redkirk Ln | 0.06mi | 3/1.5 | 1,400 (-7%) | 2mo | $230,000 | $164 | 79 |
| 5671 Dodington Ct | 0.52mi | 3/2.5 | 1,512 (0%) | 1mo | $280,000 | $185 | 75 |
| 712 White Hall Ln | 0.29mi | 3/1.5 | 1,400 (-7%) | 1mo | $259,000 | $185 | 69 |
| 5656 Caxton Ct | 0.52mi | 3/1.5 | 1,476 (-2%) | 2mo | $165,000 | $112 | 66 |
| 801 Pencil Box Way | 0.69mi | 3/2.5 | 1,480 (-2%) | 2mo | $271,000 | $183 | 63 |
| 809 S Buckingham Ct | 0.61mi | 3/2.5 | 1,322 (-13%) | 1mo | $270,000 | $204 | 50 |
| 5676 Weblin Dr | 0.65mi | 3/2.5 | 1,322 (-13%) | 1mo | $265,000 | $200 | 48 |
| 5465 Legacy Way | 0.70mi | 3/2.5 | 1,686 (+12%) | 2mo | $369,000 | $219 | 46 |
Match score weights: distance 35% · size 25% · config 20% · recency 20%. Top-matched comps best support the ARV.
Projected returns pro-forma
-3.0% appreciation · 5.61% rent growth · sell at horizon
- IRR
- -5.7%
- Equity multiple
- 0.78×
- Total profit
- $-14,207
- Equity at exit
- $35,039
- IRR
- 6.7%
- Equity multiple
- 1.55×
- Total profit
- $36,481
- Equity at exit
- $20,319
Cash invested: $65,800 (down + closing). Projections, not guarantees.
Landlord ↔ Tenant lean methodology
- Overall (STATE)
- 55 Moderately Landlord-Leaning
- State Virginia
- 55 Moderately Landlord-Leaning · D+2
- County
- — inherits STATE
- City
- — inherits STATE
ZIP-level market 23462
- Rents YoY
- 5.6%
- Active inventory
- 229
- Price-to-rent
- 8.8×
Monthly cashflow live
- Estimated rent
- $2,229 high interval (Pro) →
- Mortgage (P&I)
- −$1,232
- Tax from tax record
- −$149 /mo · $1,789/yr
- Insurance
- −$98
- HOA
- −$0
- Vacancy / Maint / Mgmt
- −$468
- Net cashflow
- $281
Break-even live
Sensitivity live
| Price | -10% $414 | -5% $348 | +0% $281 | +5% $215 | +10% $148 |
|---|---|---|---|---|---|
| Rent | -10% $105 | -5% $193 | +0% $281 | +5% $369 | +10% $457 |
| Rate | -1.0pp $400 | -0.5pp $341 | base $281 | +0.5pp $221 | +1.0pp $159 |
UW: 25.0% down · 7.5% · 30yr · 1.5% tax · 5.0% vac · 8.0% maint · 8.0% mgmt
Financing live
Cash to close
- Down payment
- $58,750
- Closing costs
- $7,050
- Reserves months
- —
- Total cash needed
- —
Loan-product check · same deal, 3 products live
Conventional
25% down · 7.5% · 30yr
- Down + closing
- —
- Monthly P&I
- —
- Monthly cashflow
- —
- DSCR
- —
- Eligible?
- —
Personal DTI + credit; lowest rate.
DSCR
20% down · 8.5% · 30yr
- Down + closing
- —
- Monthly P&I
- —
- Monthly cashflow
- —
- DSCR
- —
- Eligible?
- —
No personal income docs; deal must DSCR.
Hard money
10% down · 12.0% · 12mo
- Down + closing
- —
- Monthly P&I
- —
- Monthly cashflow
- —
- DSCR
- —
- Eligible?
- —
Short-term bridge; refi at stabilization.
Rent comps 40 comps
| Address | Beds | Baths | Sqft | Rent | $/sqft | DOM | Units | Dist |
|---|---|---|---|---|---|---|---|---|
| 5775 W Hastings Arch Virginia Beach, VA | 2.0 | 1.5 | 1200 | $1,700 | $1.42 | 45d | 1 | 0.25mi |
| 620 Red Horse Ln Virginia Beach, VA | 3.0 | 1.5 | 1396 | $1,550 | $1.11 | 22d | 1 | 0.26mi |
| 712 White Hall Ln Virginia Beach, VA | 3.0 | 1.5 | 1400 | $2,200 | $1.57 | 25d | 1 | 0.27mi |
| 5831 E Hastings Arch Virginia Beach, VA | 3.0 | 1.5 | 1200 | $1,950 | $1.62 | 25d | 1 | 0.28mi |
| 5781 Lake Edward Dr Virginia Beach, VA | 2.0 | 1.0–1.5 | 1075 | $1,478 | $1.37 | 4d | 15 | 0.42mi |
| 724 Hezekiah Little Dr Virginia Beach, VA | 3.0 | 2.5 | 1748 | $2,900 | $1.66 | 3d | 1 | 0.44mi |
| 6602 Stoney Point North Norfolk, VA | 3.0 | 2.0 | 1562 | $1,795 | $1.15 | 45d | 1 | 0.45mi |
| 6333 Tuttle Ave Norfolk, VA | 3.0 | 2.5 | 1800 | $2,695 | $1.50 | 6d | 1 | 0.46mi |
| 5964 Blackpoole Ln Virginia Beach, VA | 3.0 | 1.5 | 1310 | $2,100 | $1.60 | 25d | 1 | 0.48mi |
| 6647 Ethan Allen Ln Norfolk, VA | 2.0 | 1.5 | 1176 | $1,750 | $1.49 | 12d | 1 | 0.57mi |
| 616 Aubrey Dr Virginia Beach, VA | 3.0 | 1.5 | 1266 | $1,995 | $1.58 | 25d | 1 | 0.60mi |
| 6650 Stoney Point South Norfolk, VA | 3.0 | 2.5 | 1562 | $2,100 | $1.34 | 45d | 1 | 0.61mi |
| 813 S Grosvenor Ct Virginia Beach, VA | 3.0 | 2.5 | 1476 | $2,300 | $1.56 | 6d | 1 | 0.62mi |
| 5416 Safe Harbour Way Virginia Beach, VA | 3.0 | 2.5 | 1686 | $2,500 | $1.48 | 3d | 1 | 0.74mi |
| 5517 Lynbrook Lndg Virginia Beach, VA | 3.0 | 2.5 | 1360 | $2,335 | $1.72 | 25d | 1 | 0.79mi |
| 849 Gas Light Ln Virginia Beach, VA | 2.0 | 2.0 | 1250 | $1,900 | $1.52 | 19d | 1 | 0.81mi |
| 5545 Old Guard Cres Virginia Beach, VA | 3.0 | 2.5 | 1581 | $2,350 | $1.49 | 23d | 1 | 0.81mi |
| 5684 Campus Dr Virginia Beach, VA | 3.0 | 2.5 | 1356 | $2,495 | $1.84 | 6d | 1 | 0.86mi |
| 5403 Scholarship Dr Virginia Beach, VA | 3.0 | 2.5 | 1480 | $2,100 | $1.42 | 25d | 1 | 0.86mi |
| 5500 Baccalaureate Dr Virginia Beach, VA | 3.0 | 2.5 | 1400 | $1,995 | $1.43 | 16d | 1 | 0.87mi |
| 5493 Port Royal Dr Virginia Beach, VA | 3.0 | 2.5 | 2020 | $2,950 | $1.46 | 25d | 1 | 0.87mi |
| 700 Wolftrap Ln Virginia Beach, VA | 2.0 | 2.5 | 1360 | $1,795 | $1.32 | 18d | 1 | 0.88mi |
| 700 Wolftrap Ln Virginia Beach, VA | 2.0 | 2.5 | 1360 | $1,795 | $1.32 | 25d | 1 | 0.88mi |
| 700 Wolftrap Ln Virginia Beach, VA | 2.0 | 3.0 | 1360 | $1,795 | $1.32 | 14d | 1 | 0.88mi |
| 944 Gas Light Ln Virginia Beach, VA | 3.0 | 2.5 | 1690 | $2,300 | $1.36 | 19d | 1 | 0.88mi |
| 944 Gas Light Ln Unit 1 Virginia Beach, VA | 3.0 | 2.5 | 1690 | $2,300 | $1.36 | 18d | 1 | 0.88mi |
| 5632 Campus Dr Virginia Beach, VA | 3.0 | 2.5 | 1581 | $2,201 | $1.39 | 6d | 1 | 0.89mi |
| 913 Turtle Pond Ln Virginia Beach, VA | 3.0 | 2.0 | 1976 | $2,850 | $1.44 | 23d | 1 | 0.93mi |
| 5500 Goose Pond Ln Virginia Beach, VA | 2.0 | 2.0 | 1383 | $2,450 | $1.77 | 5d | 1 | 0.93mi |
| 5421 Sweetwater Ct Virginia Beach, VA | 3.0 | 2.5 | 1704 | $2,500 | $1.47 | 4d | 1 | 0.93mi |
| 5416 Sweetwater Ct Virginia Beach, VA | 4.0 | 2.5 | 1704 | $2,495 | $1.46 | 25d | 1 | 0.95mi |
| 969 Turtle Pond Ln Virginia Beach, VA | 2.0 | 2.5 | 1383 | $2,150 | $1.55 | 25d | 1 | 0.95mi |
| 5509 Bulls Bay Dr Unit 1 Virginia Beach, VA | 3.0 | 2.0 | 1694 | $2,599 | $1.53 | 6d | 1 | 0.98mi |
| 5509 Bulls Bay Dr Virginia Beach, VA | 3.0 | 2.5 | 1694 | $2,599 | $1.53 | 14d | 1 | 0.98mi |
| 1060 Kempsville Rd Norfolk, VA | 3.0 | 2.0 | 1330 | $2,975 | $2.24 | 0d | 1 | 0.99mi |
| 1060 Kempsville Rd Norfolk, VA | 2.0 | 2.0 | 1149 | $2,400 | $2.09 | 22d | 1 | 0.99mi |
| 1060 Kempsville Rd Norfolk, VA | 2.0 | 2.0 | 1070 | $2,400 | $2.24 | 46d | 1 | 0.99mi |
| 1060 Kempsville Rd Norfolk, VA | 3.0 | 2.0 | 1425 | $2,975 | $2.09 | 14d | 1 | 0.99mi |
| 1060 Kempsville Rd Norfolk, VA | 2.0 | 2.0 | 1218 | $2,400 | $1.97 | 25d | 1 | 0.99mi |
| 1060 Kempsville Rd Unit 00 08107 Norfolk, VA | 3.0 | 2.0 | 1383 | $2,479 | $1.79 | 14d | 1 | 1.00mi |
Listing history 4 events
-
2026-06-02statusdays on market $235,000 Under Contract 22 DOM
-
2026-06-01days on market $235,000 Active Under Contract 21 DOM
-
2026-05-31days on market $235,000 Active Under Contract 20 DOM
-
2026-05-11$235,000 Active 476-char remark
ⓘ Source: listings_history table (triggers on properties + properties_extension) + one-shot
backfill from property_details.listing_events for pre-trigger history.
Tax reassessment forecast VA · Resets to sale price
- Current annual tax
- $1,789 · $149/mo
- Projected year-2 tax
- $1,927 · $161/mo
- Expected delta
- +$138/yr (+$12/mo · 7.7%)
ⓘ Screening estimate from a state-policy table — verify with the county assessor before closing.
Climate risk First Street
- Flood 1/10 Low FEMA zone X (unshaded) · 0% chance over 30 yrs
- Heat 9/10 Extreme 7 d/yr ≥105°F today · 16 d/yr by 30 yrs out
- Wind 8/10 Severe 80% chance of damaging wind over 30 yrs
Nearby sold comps map
Loading sold comps map…
Walkable amenities ~0.75 mi
Loading nearby amenities…
Taxation est. · year 1
- Rental income
- $26,745
- − Mortgage interest
- −$13,164
- − Property taxes
- −$1,789
- − Insurance
- −$1,175
- − Repairs & maintenance
- −$2,140
- − Management
- −$2,140
- − Depreciation
- −$6,836
- Taxable loss
- −$497
- Est. tax savings @ 24.0%
- +$119
- After-tax cash flow
- $3,496/yr
For passive investors: Depreciation is non-cash, so a rental often shows a tax loss while cash-flowing — sheltering income. Rental losses are passive: they offset passive income freely, and up to $25,000/yr can offset ordinary (W-2) income if you actively participate and your MAGI is under $100k (phasing out to $0 by $150k); unused losses carry forward. On sale, claimed depreciation is recaptured at up to 25%, and gains may owe capital-gains tax (a 1031 exchange can defer both). Figures are a year-1 estimate at your 24.0% rate — not tax advice; consult a CPA.
Schools (NCES district)
- District
- Norfolk City Public School District
- NCES district ID
- 5102670
- Math proficiency
- 27% ▼ -44.00%
- Reading proficiency
- 56% ▼ -10.00%
- Median HH income
- $44,358
- Composite
- 35.08/100
- National rank
- #5026
- State rank
- #118 of 131 in VA
Livability — Norfolk
- Score
- 83/100
- State rank
- #43
- US rank
- #1026
Category grades
Schools grade is shown separately in the Schools card above.
Census & demographics
- Census place
- Norfolk, VA
- County
- Virginia Beach City · 448,227 people
- City population
- 214,042
- Metro
- Virginia Beach-Norfolk-Newport News, VA-NC
- Population (ZIP)
- 66,151
- Household income
- $69,040
- Rent vs Own
- Severe rent burden
- 3906.0
Population outlook (Norfolk County) Hauer SSP2
- Today (2025)
- 249,032 people
- By 2030
- 252,347 · +1.3%
- By 2040
- 253,644 · +1.9%
- By 2050
- 251,913 · +1.2%
- By 2075
- 245,281 · -1.5%
- By 2100
- 219,548 · -11.8%
Race, ethnicity, and origin ACS 2023
- Neighborhood character
- Diverse neighborhood (Simpson 0.68)
- Race & ethnicity
- White 45% Black 32% Hispanic / Latino 12% Two or more races 10% Asian 5%
- Hispanic origin (detail)
- Mexican 4% Puerto Rican 3%
- Common ancestry
- Romanian 2% Italian 1% Slovak 1%
- Foreign-born
- 9% · Canada, China, Vietnam
- Languages at home
- 87% English-only · Spanish 6% Tagalog/Filipino 2% Other Asian/Pacific 1%
Political lean MEDSL · Norfolk
- 2024 margin
- Solid D (+41.5) · D 70.0% · R 28.5% · Other 1.6%
- 2008→2024 swing
- -1.4pp toward R · 2008: 43.0pp · 2024: 41.5pp
- All cycles
- 2024: D+41.5 2020: D+45.6 2016: D+42.0 2012: D+44.0 2008: D+43.0
Not yet ingested
- Civics
- —
Market trends
- HPI YoY
- ▼ -269.19%
- Current HPI
- 333.1908
- Rent YoY
- ▲ 5.61%
- Metro
- Virginia Beach-Norfolk-Newport News, VA-NC
- State GDP YoY
- ▲ 2.40%
- F500 in state
- 50
Industry mix (Fortune 500 HQ in VA)
| Industry | F500 HQs | Revenue |
|---|---|---|
| Aerospace / Defense | 4 | $236B |
|
||
| Technology / Defense | 3 | $32B |
|
||
| Financial Services | 2 | $176B |
|
||
| Utilities | 2 | $27B |
|
||
| Insurance | 2 | $25B |
|
||
| Technology | 2 | $15B |
|
||
Price history
3 events — show timeline
- 2026-06-02 Pending — REINMLS
- 2026-05-22 Contingent — REINMLS
- 2026-05-11 Listed $235,000 REINMLS
Property tax history
+5.6%/yrLatest (2025): $1,789 · +5.4% YoY. Source: county tax records.
Cash-flow waterfall
monthlySold comps — $/sqft
last 12 mo · ≤1 miLoading sold comps…