29472 Hoover Rd Unit 42/D · Warren, MI
Flood risk 1/10 · Minimal
- FEMA flood zone
- X (unshaded)
- Chance of flooding over 30 yrs
- 0.0%
- Est. flood insurance / yr
- $507 – $1,088
Fire risk 1/10 · Minimal
- Est. fire insurance / yr
- $784 – $1,456
Heat risk 3/10 · Minor
- Hot days now (above 96°F)
- 7 days/yr
- Hot days in 30 yrs
- 15 days/yr
Wind risk 1/10 · Minimal
- Chance of severe wind over 30 yrs
- —
Air-quality risk 3/10 · Minor
- Unhealthy air days now
- 3 days/yr
- Unhealthy air days in 30 yrs
- 4 days/yr
Risk factors via First Street. Map © Google.
Why this score? — see what drove the C+ grade
The composite is a weighted blend of 9 inputs, each scored 0–100. Each bar is that input's sub-score; the figure is the points it added to the 100-point composite (weight × sub-score).
- Cash flow +26.1/30.0
- 1% rule +10.0/10.0
- DSCR +8.8/10.0
- ARV discount +7.5/15.0
- Livability +3.7/5.0
- Rent growth +3.1/5.0
- Schools +2.7/10.0
- Condition / age +2.2/5.0
- Appreciation +0.0/10.0
$69,900
🖨 Deal sheet 📄 Offer letter ✓ Due diligence
Listing remarks
A beautiful community with large grassy walking areas to enjoy and a really nice pool, always are very clean, in the basement you have a lockable storage area approximately 10x10 and a lockable laundry room privConvenient living in this economical well run, well controlled community. Home needs TLC and is priced accordingly. Large rooms, plenty of parking. private launcher room that is approximately 8 by 10:00,
Key facts
- $196 HOA
- Garage
- Built 1965
Property features AI
Finance
- Other: Pets not allowed; Acreage listed for the overall property: 13.65
- HOA & community: Part of Presidential Village association; Monthly association fee of $196; Association contact available
Exterior
- Parking: Carport (garage reported) with 1 parking space
- Utilities: Public water; Public sanitary sewer
- Home design: Condominium unit (Condo/Apt on 2nd floor or above); Unit/Building number 42/D; Built in 1965; Located in a city (Warren) within the President Village subdivision
- Construction: Brick construction; Basement foundation
- Exterior features: Brick exterior
Interior
- Kitchen: Kitchen on entry level with linoleum flooring (approx. 10 x 7); Separate dining room on entry level with carpet (approx. 10 x 10)
- Bedrooms: Bedroom on entry level with carpet (12 x 10)
- Flooring: Carpet in living areas and dining room; Linoleum in kitchen; Ceramic in bathroom; Concrete in laundry/basement
- Bathrooms: One full bathroom on entry level with ceramic flooring (approx. 8 x 7)
- Heating & cooling: Forced air heating; Central A/C; Natural gas fuel
- Interior features: Total of 5 rooms; Full basement
- Laundry & utility: Laundry room in basement with concrete flooring (approx. 12 x 8)
Neighborhood map
What this means for you Summary
Snapshot
- This is a 1-bed/1.0-bath condo listed at $70k. Condition is rated fair.
Deal economics
- At list price, monthly cash flow is $176 ($2k/yr) — positive.
- The deal already cash-flows at list — no discount required.
- Meets the 1% rule at list price ($1k rent vs $70k).
- Cap rate 9.3% vs local median 5.3% in Warren — top-decile yield for the area; either an underpriced asset or a hidden risk that comps aren't pricing in. Stress-test before assuming the spread holds.
Location & tenants
- Location reads 74/100 on livability (#171 in MI, #4,491 nationally) — a middle-class / working-renter tenant base. Strengths: commute A+, cost of living A+, housing A+; Watch: schools D, amenities D, employment D.
- Warren Woods Public Schools (urban): math 23% / reading 40% proficiency, ranked #336 of 540 in MI (top 62%) — families likely to look elsewhere, expect single-tenant / working-renter base with shorter leases.
- Market conditions: Rents rising (+2.5%/yr); 122 active listings in the ZIP; 13 comparable units currently listed for rent nearby; rentals at typical pace (median 24d on market — plan ~3-4 weeks tenant-placement turnaround); 1,321 units permitted in Macomb County in 2024 (86 in 5+ unit buildings).
Forward outlook
- Local home prices are declining (-3.0%/yr); year-one equity from $483 of loan paydown is wiped out by about $2k of value loss. Plan a longer hold.
- Macomb County population projected at +9% by 2050 — modest demand growth; plan on rents tracking national, not racing it.
Negotiation context
- Only 11 days on market — expect competitive offers; lowballing is unlikely to land.
Questions for the listing agent
- Have any recent inspections been done? Can we get a copy of the seller's disclosures and any deferred-maintenance estimates?
- Built in 1965 — when were the roof, HVAC, electrical panel, plumbing, and water heater last replaced?
- What does the HOA fee cover, when was the last increase, and are there any pending special assessments or reserve-fund shortfalls?
- Any open or pending special assessments — roof, HVAC, plumbing, elevator, façade? What's the per-unit balance and payoff schedule, and is the seller paying it off at close or rolling it to the buyer?
- Is there a deadline driving the sale (1031 exchange, divorce, estate, relocation)? That informs how much negotiation room exists.
- Schools are D-rated, which usually means shorter tenancies and higher turnover. Who's the typical renter profile here, and what's been the actual vacancy rate?
- Crime grade is D in this area — have there been break-ins, vandalism, or insurance claims at this property in the last 3 years? What carrier currently insures it and at what premium?
- What's the average days-on-market for RENTAL listings here right now (not sales)? A rising rental-DOM trend means longer vacancies and softer asking-rent achievability than the comps imply.
- What's the recent tenant-quality profile in this submarket — average credit score on applications, eviction rate, late-payment / NSF rate, and stable-employment percentage? A property-management company in the area should have these aggregated.
- How much new apartment / multifamily construction is in the pipeline within 1–3 miles? Heavy new supply (>2% of stock underway) typically softens rents 12–24 months out; light construction supports rent growth.
Investment metrics
- 1% rule
- 1.55% ✓
- Cap rate
- 9.32%
- Cash-on-cash
- 10.81%
- DSCR
- 1.48
- GRM
- 5.4
CMA / ARV
No comps found within radius.
Projected returns pro-forma
-3.0% appreciation · 2.52% rent growth · sell at horizon
- IRR
- -0.6%
- Equity multiple
- 0.98×
- Total profit
- $-477
- Equity at exit
- $10,422
- IRR
- 8.5%
- Equity multiple
- 1.64×
- Total profit
- $12,491
- Equity at exit
- $6,044
Cash invested: $19,572 (down + closing). Projections, not guarantees.
Landlord ↔ Tenant lean methodology
- Overall (STATE)
- 62 Landlord-Friendly
- State Michigan
- 62 Landlord-Friendly · EVEN
- County
- — inherits STATE
- City
- — inherits STATE
ZIP-level market 48093
- Rents YoY
- 2.5%
- Active inventory
- 122
- Price-to-rent
- 5.4×
Monthly cashflow live
- Estimated rent
- $1,083 high interval (Pro) →
- Mortgage (P&I)
- −$367
- Tax est. 1.5%
- −$87 /mo · $1,048/yr
- Insurance
- −$29
- HOA
- −$196
- Vacancy / Maint / Mgmt
- −$227
- Net cashflow
- $176
Break-even live
UW: 25.0% down · 7.5% · 30yr · 1.5% tax · 5.0% vac · 8.0% maint · 8.0% mgmt
Financing live
Cash to close
- Down payment
- $17,475
- Closing costs
- $2,097
- Reserves months
- —
- Total cash needed
- —
Loan-product check · same deal, 3 products live
Conventional
25% down · 7.5% · 30yr
- Down + closing
- —
- Monthly P&I
- —
- Monthly cashflow
- —
- DSCR
- —
- Eligible?
- —
Personal DTI + credit; lowest rate.
DSCR
20% down · 8.5% · 30yr
- Down + closing
- —
- Monthly P&I
- —
- Monthly cashflow
- —
- DSCR
- —
- Eligible?
- —
No personal income docs; deal must DSCR.
Hard money
10% down · 12.0% · 12mo
- Down + closing
- —
- Monthly P&I
- —
- Monthly cashflow
- —
- DSCR
- —
- Eligible?
- —
Short-term bridge; refi at stabilization.
Rent comps 13 comps
| Address | Beds | Baths | Sqft | Rent | $/sqft | DOM | Units | Dist |
|---|---|---|---|---|---|---|---|---|
| 28801 Imperial Dr Warren, MI | 1.0–2.0 | 1.0 | 887 | $975 | $1.10 | 16d | 6 | 0.32mi |
| 28250 Hoover Rd Warren, MI | 1.0–2.0 | 1.0–2.0 | 912 | $1,045 | $1.15 | 2d | 17 | 0.51mi |
| 29250 Longview Ave Apt 14 Warren, MI | 2.0 | 1.0 | 950 | $1,000 | $1.05 | 43d | 1 | 0.86mi |
| 29206 Longview Ave Warren, MI | 1.0 | 1.0 | 750 | $975 | $1.30 | 24d | 1 | 0.87mi |
| 29158 Longview Ave Warren, MI | 1.0 | 1.0 | 750 | $950 | $1.27 | 43d | 1 | 0.89mi |
| 29400 Towne Center Cir Warren, MI | 1.0–3.0 | 1.0–2.0 | 1114 | $1,399 | $1.26 | 1d | 1 | 0.91mi |
| 8657 Kennedy Cir #7 Warren, MI | 1.0 | 1.0 | 805 | $1,300 | $1.61 | 3d | 1 | 0.99mi |
| 27239 Hoover Rd Warren, MI | 1.0–2.0 | 1.0 | 670 | $845 | $1.26 | 43d | 1 | 1.06mi |
| 31727 Hoover Rd Unit 21 Warren, MI | 2.0 | 1.0 | 900 | $1,395 | $1.55 | 4d | 1 | 1.22mi |
| 28012 Van Dyke Ave Warren, MI | 1.0 | 1.0 | 695 | $945 | $1.36 | 24d | 1 | 1.33mi |
| 13006 E 11 Mile Rd Unit 6 Warren, MI | 2.0 | 1.0 | 850 | $1,050 | $1.24 | 43d | 1 | 1.41mi |
| 13006 E 11 Mile Rd Unit 6 Warren, MI | 2.0 | 1.0 | 850 | $1,075 | $1.26 | 14d | 1 | 1.41mi |
| 31250 Schoenherr Rd Warren, MI | 1.0–2.0 | 1.0–2.0 | 934 | $1,000 | $1.07 | 43d | 2 | 1.41mi |
HOA detail condo
- Monthly dues
- $196 · $2,352/yr
- Likely covers
- pool
- Assessments
- None detected in remarks — confirm with the listing agent.
Listing history 9 events
-
2026-06-08statusdays on market $69,900 Pending 11 DOM
-
2026-06-07days on market $69,900 Active 10 DOM
-
2026-06-04days on market $69,900 Active 7 DOM
-
2026-06-03days on market $69,900 Active 6 DOM
-
2026-06-02days on market $69,900 Active 5 DOM
-
2026-06-01days on market $69,900 Active 4 DOM
-
2026-05-31days on market $69,900 Active 3 DOM
-
2026-05-28$69,900 Active
-
2026-05-28historical $69,900
ⓘ Source: listings_history table (triggers on properties + properties_extension) + one-shot
backfill from property_details.listing_events for pre-trigger history.
Climate risk First Street
- Flood 1/10 Low FEMA zone X (unshaded) · 0% chance over 30 yrs
- Wildfire 1/10 Low
- Heat 3/10 Moderate 7 d/yr ≥96°F today · 15 d/yr by 30 yrs out
- Wind 1/10 Low
- Air quality 3/10 Moderate 3 unhealthy d/yr today · 4 by 30 yrs out
Nearby sold comps map
Loading sold comps map…
Walkable amenities ~0.75 mi
Loading nearby amenities…
Taxation est. · year 1
- Rental income
- $12,994
- − Mortgage interest
- −$3,915
- − Property taxes
- −$1,048
- − Insurance
- −$350
- − Repairs & maintenance
- −$1,040
- − Management
- −$1,040
- − HOA
- −$2,352
- − Depreciation
- −$2,033
- Taxable income
- $1,216
- Est. tax owed @ 24.0%
- −$292
- After-tax cash flow
- $1,825/yr
For passive investors: Depreciation is non-cash, so a rental often shows a tax loss while cash-flowing — sheltering income. Rental losses are passive: they offset passive income freely, and up to $25,000/yr can offset ordinary (W-2) income if you actively participate and your MAGI is under $100k (phasing out to $0 by $150k); unused losses carry forward. On sale, claimed depreciation is recaptured at up to 25%, and gains may owe capital-gains tax (a 1031 exchange can defer both). Figures are a year-1 estimate at your 24.0% rate — not tax advice; consult a CPA.
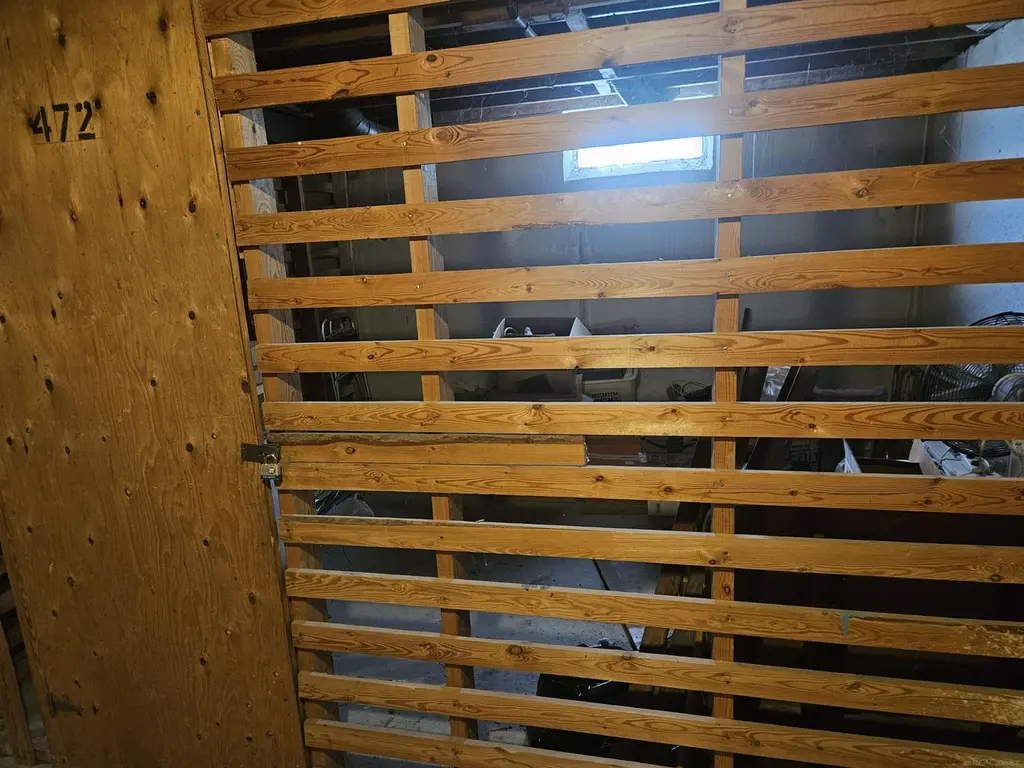
Condition & rehab AI · 12 photos
This property requires moderate renovations to improve its condition and value. Key areas for improvement include appliances, tub and sink, carpeted floors, paint, exterior siding, windows, and landscaping.
Repairs flagged
- Major Appliances — Old and worn
- Major Tub and sink — Dated and likely in need of replacement
- Major Carpeted floors — Worn and may need replacement
- Major Paint — Chipped and faded
- Major Exterior siding — Wear
- Major Windows — Old and may need replacement
- Major HVAC/mechanicals — No visible signs of condition
Value-add opportunities
- Both Painting and updating appliances — Improves both resale and rental value
- Both Replacing tub and sink — Improves both resale and rental value
- Both Replacing carpeted floors — Improves both resale and rental value
- Both Landscaping — Improves both resale and rental value
Renovation cost estimate screening
| Repair item | Severity | Est. cost |
|---|---|---|
| Appliances · Old and worn | Major | $15,000–50,000 |
| Tub and sink · Dated and likely in need of replacement | Major | $15,000–50,000 |
| Carpeted floors · Worn and may need replacement | Major | $15,000–50,000 |
| Paint · Chipped and faded | Major | $15,000–50,000 |
| Exterior siding · Wear | Major | $15,000–50,000 |
| Windows · Old and may need replacement | Major | $15,000–50,000 |
| HVAC/mechanicals · No visible signs of condition | Major | $15,000–50,000 |
| Total estimated repair cost · 7 items | $105,000–350,000 |
Value-add ROI direction
- Both Painting and updating appliances — Improves both resale and rental value ↑
- Both Replacing tub and sink — Improves both resale and rental value ↑
- Both Replacing carpeted floors — Improves both resale and rental value ↑
- Both Landscaping — Improves both resale and rental value ↑
ⓘ Cost ranges are severity-bucket heuristics (US national rule-of-thumb). Get contractor quotes + a written scope before underwriting a rehab budget.
Schools (NCES district)
- District
- Warren Woods Public Schools
- NCES district ID
- 2635220
- Math proficiency
- 23% ▼ -9.00%
- Reading proficiency
- 40% ▼ -5.00%
- Median HH income
- $49,013
- Composite
- 27.29/100
- National rank
- #7003
- State rank
- #336 of 540 in MI
Livability — Warren
- Score
- 74/100
- State rank
- #171
- US rank
- #4491
Category grades
Schools grade is shown separately in the Schools card above.
Census & demographics
- Census place
- Warren, MI
- County
- Macomb County · 638,552 people
- City population
- 114,937
- Metro
- Detroit-Warren-Dearborn, MI
- Population (ZIP)
- 25,014
- Household income
- $68,218
- Rent vs Own
- Severe rent burden
- 632.0
Population outlook (Macomb County) Hauer SSP2
- Today (2025)
- 925,296 people
- By 2030
- 948,226 · +2.5%
- By 2040
- 983,961 · +6.3%
- By 2050
- 1,010,200 · +9.2%
- By 2075
- 1,076,222 · +16.3%
- By 2100
- 1,077,065 · +16.4%
Race, ethnicity, and origin ACS 2023
- Neighborhood character
- Predominantly White (66%)
- Race & ethnicity
- White 66% Black 18% Asian 9% Two or more races 6% Hispanic / Latino 1%
- Common ancestry
- Romanian 14% Lithuanian 3% Arab 2%
- Foreign-born
- 15% · Vietnam, Canada, China
- Languages at home
- 80% English-only · Other Indo-European 5% Arabic 4% Russian/Polish/Slavic 4%
Political lean MEDSL · Macomb
- 2024 margin
- R (+13.7) · D 42.2% · R 55.9% · Other 1.9%
- 2008→2024 swing
- -22.3pp toward R · 2008: 8.6pp · 2024: -13.7pp
- All cycles
- 2024: R+13.7 2020: R+8.1 2016: R+11.6 2012: D+4.0 2008: D+8.6
Not yet ingested
- Civics
- —
Market trends
- HPI YoY
- ▼ -223.26%
- Current HPI
- 203.6554
- Rent YoY
- ▲ 2.52%
- Metro
- Detroit-Warren-Dearborn, MI
- State GDP YoY
- ▲ 1.37%
- F500 in state
- 28
Industry mix (Fortune 500 HQ in MI)
| Industry | F500 HQs | Revenue |
|---|---|---|
| Automotive Parts | 3 | $48B |
|
||
| Automotive | 2 | $372B |
|
||
| Chemicals | 1 | $45B |
|
||
| Automotive Retail | 1 | $29B |
|
||
| Healthcare / Medical Devices | 1 | $23B |
|
||
| Automotive Technology | 1 | $20B |
|
||
Price history
+0.0% since first listed2 events — show timeline
- 2026-05-28 Listed $69,900 MiRealSource-MiMLS
- 2026-05-28 Coming Soon $69,900 MiRealSource-MiMLS
Cash-flow waterfall
monthlySold comps — $/sqft
last 12 mo · ≤1 miLoading sold comps…