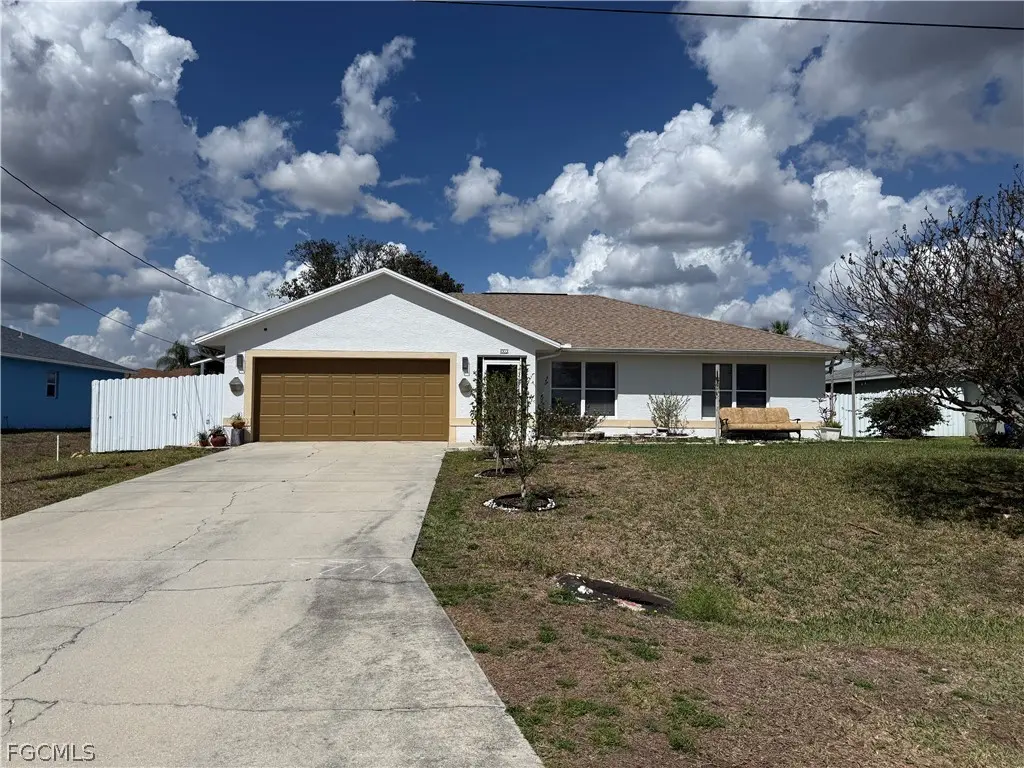
4912 Bygone St · Lehigh Acres, FL
Flood risk No data
- FEMA flood zone
- —
- Chance of flooding over 30 yrs
- —
- Est. flood insurance / yr
- —
Fire risk No data
- Est. fire insurance / yr
- —
Heat risk No data
- Hot days now (above threshold)
- —
- Hot days in 30 yrs
- —
Wind risk No data
- Chance of severe wind over 30 yrs
- —
Air-quality risk No data
- Unhealthy air days now
- —
- Unhealthy air days in 30 yrs
- —
Risk factors via First Street. Map © Google.
Why this score? — see what drove the D grade
The composite is a weighted blend of 9 inputs, each scored 0–100. Each bar is that input's sub-score; the figure is the points it added to the 100-point composite (weight × sub-score).
- Cash flow +13.8/30.0
- ARV discount +10.9/15.0
- DSCR +4.2/10.0
- Schools +4.1/10.0
- Livability +3.0/5.0
- 1% rule +2.7/10.0
- Condition / age +2.5/5.0
- Rent growth +1.3/5.0
- Appreciation +0.0/10.0
$284,900
🖨 Deal sheet (PDF) 📄 Offer letter ✓ Due diligence
Listing remarks MLS
Solid opportunity to own in the west side of Lehigh Acres. Large 3/2 floor plan with extra rooms (enclosed porch and studio room, screened porch as well). Double garage, CBS construction, built 2002, 2 HVAC units. All sit on about half an acre (2 building sites). This is NOT a short sale, this is a quick response seller. You're gonna like this one! Don't miss it! Special addenda with solid prequal through Wells Fargo or proof of cash needed with all offers. * * Underground propane gas tank in place for generator system * *
Key facts
- Screened-in lanai
- Open kitchen
- 0.25 acre lot
Tags
Property features AI
Finance
- Other: Lot is rectangular, paved road access, dimensions approximately 80 x 125 (0.25 acre); Irrigation supplied by well
- Financial info: Pets allowed
- HOA & community: Non-gated community; No association fee
Exterior
- Parking: Attached 2-car garage with garage door opener; 2 covered parking spaces
- Security: Smoke detector(s)
- Utilities: Well water; Septic tank; Cable available
- Home design: Single-story home; Resale property; Faces south; Exposed to the north
- Construction: Block, concrete and stucco construction; Shingle roof; Built on traditional foundation
- Exterior features: Fenced yard; Automatic sprinklers; Room for a pool; Lanai; Porch; Screened porch
Interior
- Kitchen: Refrigerator; Range; Microwave; Dishwasher; Pantry; Eat-in kitchen
- Bedrooms: Family room; Screened porch
- Flooring: Laminate flooring; Tile flooring
- Bathrooms: 2 full bathrooms
- Heating & cooling: Central heating (electric); Central air conditioning (electric); Ceiling fans
- Interior features: Attic with pull-down access; Eat-in kitchen; Pantry; Separate shower (shower only); Walk-in closet(s); Split bedroom layout; Sliding windows; Unfurnished
- Laundry & utility: Washer and dryer included; Indoor laundry
Neighborhood map
What this means for you Summary
Snapshot
- This is a 3-bed/2.0-bath single-family listed at $285k.
Deal economics
- At list price, monthly cash flow is $27 ($322/yr) — positive.
- The deal already cash-flows at list — no discount required.
- To meet the 1% rule (rent ≥ 1% of price), the offer needs to be $218k (23.5% below list).
- Recommended offer: $218k (23.5% below list) — sets the bar for 1% rule.
- Cap rate 6.4% vs local median 4.7% in Lehigh Acres — top-decile yield for the area; either an underpriced asset or a hidden risk that comps aren't pricing in. Stress-test before assuming the spread holds.
Location & tenants
- Location reads 59/100 on livability (#826 in FL) — a working-class tenant base; expect higher turnover. Strengths: cost of living A+, housing A+; Watch: crime C-, employment D+, amenities F.
- Lee (suburban): math 47% / reading 50% proficiency, ranked #42 of 73 in FL (top 58%) — families likely to look elsewhere, expect single-tenant / working-renter base with shorter leases.
- Zoned schools: Veterans Park Academy For The Arts (math 41% / reading 45%, grade F, #1,366 of 2,144 statewide, top 64%, 2,133 students, 36% FRL); Oak Hammock Middle School (math 43% / reading 41%, grade D-, #340 of 571 statewide, top 61%, 1,563 students, 56% FRL); Lehigh Senior High School (math 23% / reading 45%, grade F, #394 of 667 statewide, top 60%, 2,476 students, 57% FRL).
- Market conditions: Rents falling (-4.7%/yr); 1347 active listings in the ZIP; 40 comparable units currently listed for rent nearby; rentals at typical pace (median 23d on market — plan ~3-4 weeks tenant-placement turnaround); solid renter incomes; 15,411 units permitted in Lee County in 2024 (4,686 in 5+ unit buildings).
- This rent runs 34% of the median local income ($78k/yr) — at the standard rent-burdened threshold; future hikes will face affordability resistance.
Forward outlook
- Local home prices are declining (-3.0%/yr); year-one equity from $2k of loan paydown is wiped out by about $9k of value loss. Plan a longer hold.
- Lee County population projected at +44% by 2050 — long-run rental-demand tailwind backs the buy-and-hold thesis.
Negotiation context
- It's been on market 45 days — a 3% lower offer ($276k) is reasonable based on typical stale-listing flexibility.
- Current owner paid $175k; list at $285k implies a 63% gain — meaningful room to come down on a strong offer.
Questions for the listing agent
- It's been on market 45 days. Have you received any prior offers? Is the seller open to a 23% concession, seller financing, or rate buy-down credit?
- Is there a deadline driving the sale (1031 exchange, divorce, estate, relocation)? That informs how much negotiation room exists.
- Schools are D-rated, which usually means shorter tenancies and higher turnover. Who's the typical renter profile here, and what's been the actual vacancy rate?
- The area grade is low — what's the realistic commute time and amenity access for the typical tenant pool here? Any planned neighborhood developments (good or bad) we should know about?
- What's the average days-on-market for RENTAL listings here right now (not sales)? A rising rental-DOM trend means longer vacancies and softer asking-rent achievability than the comps imply.
- What's the recent tenant-quality profile in this submarket — average credit score on applications, eviction rate, late-payment / NSF rate, and stable-employment percentage? A property-management company in the area should have these aggregated.
- How much new for-sale + rental construction is in the pipeline within 1–3 miles? Heavy new supply typically softens prices + rents 12–24 months out; constrained supply supports both.
Investment metrics
- 1% rule
- 0.77% ✗
- Cap rate
- 6.41%
- Cash-on-cash
- 0.40%
- DSCR
- 1.02
- GRM
- 10.9
CMA / ARV
- ARV (on-the-fly)
- $307,944
- Comps found
- 12
Show comp detail 12 sales within ~0.75 mi
| Address | Dist | Beds/Ba | Sqft | Sold | Price | $/sf | Match |
|---|---|---|---|---|---|---|---|
| 5225 Baron St | 0.32mi | 3/2.0 | 1,512 (-8%) | 1mo | $275,000 | $182 | 72 |
| 806 Champion Ave | 0.30mi | 3/2.0 | 1,747 (+7%) | 9mo | $380,000 | $218 | 67 |
| 1109 Chaplin Ave | 0.55mi | 3/2.0 | 1,531 (-6%) | 1mo | $185,000 | $121 | 63 |
| 4903 Bygone St | 0.08mi | 3/2.0 | 1,456 (-11%) | 24mo | $355,000 | $244 | 58 |
| 906 Angelo Ave | 0.58mi | 3/2.0 | 1,527 (-7%) | 9mo | $300,000 | $196 | 54 |
| 4541 Varsity Cir | 0.48mi | 3/2.0 | 1,703 (+4%) | 21mo | $320,000 | $188 | 54 |
| 4911 Berryman St | 0.28mi | 3/2.0 | 1,408 (-14%) | 13mo | $263,000 | $187 | 52 |
| 904 Agnes Ave | 0.70mi | 3/2.0 | 1,458 (-11%) | 10mo | $240,000 | $165 | 41 |
| 1011 Cedartree Ave | 0.55mi | 4/2.0 (+1) | 1,882 (+15%) | 4mo | $333,000 | $177 | 41 |
| 703 James Ave N | 0.48mi | 4/2.0 (+1) | 1,828 (+12%) | 18mo | $353,640 | $193 | 38 |
| 5024 Baron St | 0.59mi | 4/2.0 (+1) | 1,828 (+12%) | 20mo | $317,990 | $174 | 32 |
| 5321 Bywood St | 0.71mi | 4/2.0 (+1) | 1,757 (+7%) | 23mo | $345,000 | $196 | 31 |
Match score weights: distance 35% · size 25% · config 20% · recency 20%. Top-matched comps best support the ARV.
Projected returns pro-forma
-3.0% appreciation · 0.0% rent growth · sell at horizon
- IRR
- -18.7%
- Equity multiple
- 0.36×
- Total profit
- $-50,980
- Equity at exit
- $42,480
- IRR
- -17.5%
- Equity multiple
- 0.15×
- Total profit
- $-67,432
- Equity at exit
- $24,633
Cash invested: $79,772 (down + closing). Projections, not guarantees.
Landlord ↔ Tenant lean methodology
- Overall (STATE)
- 87 Strongly Landlord-Friendly
- State Florida
- 87 Strongly Landlord-Friendly · R+3
- County
- — inherits STATE
- City
- — inherits STATE
ZIP-level market 33971
- Home prices YoY
- -8.0%
- Rents YoY
- -4.7%
- Active inventory
- 1347
- Price-to-rent
- 10.9×
Monthly cashflow live
- Estimated rent
- $2,180 high interval (Pro) →
- Mortgage (P&I)
- −$1,494
- Tax from tax record
- −$83 /mo · $995/yr
- Insurance
- −$119
- HOA
- −$0
- Vacancy / Maint / Mgmt
- −$458
- Net cashflow
- $27
Break-even live
Sensitivity live
| Price | -10% $188 | -5% $108 | +0% $27 | +5% $-54 | +10% $-134 |
|---|---|---|---|---|---|
| Rent | -10% $-145 | -5% $-59 | +0% $27 | +5% $113 | +10% $199 |
| Rate | -1.0pp $170 | -0.5pp $99 | base $27 | +0.5pp $-47 | +1.0pp $-122 |
UW: 25.0% down · 7.5% · 30yr · 1.5% tax · 5.0% vac · 8.0% maint · 8.0% mgmt
Financing live
Cash to close
- Down payment
- $71,225
- Closing costs
- $8,547
- Reserves months
- —
- Total cash needed
- —
Loan-product check · same deal, 3 products live
Conventional
25% down · 7.5% · 30yr
- Down + closing
- —
- Monthly P&I
- —
- Monthly cashflow
- —
- DSCR
- —
- Eligible?
- —
Personal DTI + credit; lowest rate.
DSCR
20% down · 8.5% · 30yr
- Down + closing
- —
- Monthly P&I
- —
- Monthly cashflow
- —
- DSCR
- —
- Eligible?
- —
No personal income docs; deal must DSCR.
Hard money
10% down · 12.0% · 12mo
- Down + closing
- —
- Monthly P&I
- —
- Monthly cashflow
- —
- DSCR
- —
- Eligible?
- —
Short-term bridge; refi at stabilization.
Rent comps 40 comps
| Address | Beds | Baths | Sqft | Rent | $/sqft | DOM | Units | Dist |
|---|---|---|---|---|---|---|---|---|
| 4914 Bywood St Lehigh Acres, FL | 3.0 | 2.0 | 1378 | $2,250 | $1.63 | 12d | 1 | 0.06mi |
| 4910 Bywood St Lehigh Acres, FL | 3.0 | 2.0 | 1858 | $2,750 | $1.48 | 25d | 1 | 0.07mi |
| 5003 Barth St Lehigh Acres, FL | 3.0 | 2.0 | 1558 | $1,816 | $1.17 | 5d | 1 | 0.10mi |
| 4903 Beauty St Lehigh Acres, FL | 3.0 | 2.0 | 1777 | $1,970 | $1.11 | 4d | 1 | 0.13mi |
| 5215 Butte St Lehigh Acres, FL | 4.0 | 2.0 | 1828 | $2,400 | $1.31 | 25d | 1 | 0.19mi |
| 826 Adeline Ave Lehigh Acres, FL | 3.0 | 2.0 | 1550 | $1,920 | $1.24 | 25d | 1 | 0.27mi |
| 910 Atherton Ave Lehigh Acres, FL | 4.0 | 3.0 | 1715 | $2,300 | $1.34 | 21d | 1 | 0.30mi |
| 1005 Adeline Ave Lehigh Acres, FL | 4.0 | 2.0 | 1819 | $2,100 | $1.15 | 5d | 1 | 0.35mi |
| 4911 7th St W Lehigh Acres, FL | 3.0 | 2.0 | 1420 | $1,800 | $1.27 | 5d | 1 | 0.44mi |
| 5134 Bristo St Lehigh Acres, FL | 3.0 | 2.0 | 1195 | $1,650 | $1.38 | 5d | 1 | 0.52mi |
| 5148 Centennial Blvd Lehigh Acres, FL | 3.0 | 2.0 | 1116 | $1,699 | $1.52 | 25d | 1 | 0.55mi |
| 5148 Centennial Blvd Lehigh Acres, FL | 3.0 | 2.0 | 1116 | $1,649 | $1.48 | 5d | 1 | 0.55mi |
| 5146 Centennial Blvd Lehigh Acres, FL | 3.0 | 2.0 | 1116 | $1,699 | $1.52 | 25d | 1 | 0.55mi |
| 5146 Centennial Blvd Lehigh Acres, FL | 3.0 | 2.0 | 1116 | $1,649 | $1.48 | 5d | 1 | 0.55mi |
| 4807 5th St W Lehigh Acres, FL | 4.0 | 2.0 | 1362 | $1,755 | $1.29 | 25d | 1 | 0.62mi |
| 1502 Scholar Ct Lehigh Acres, FL | 3.0 | 2.0 | 1730 | $2,400 | $1.39 | 25d | 1 | 0.64mi |
| 5032 Bristo St Lehigh Acres, FL | 3.0 | 2.0 | 1692 | $2,500 | $1.48 | 25d | 1 | 0.67mi |
| 1019 Angelo Ave Lehigh Acres, FL | 3.0 | 2.0 | 1704 | $2,300 | $1.35 | 25d | 1 | 0.67mi |
| 5045 Benton St Lehigh Acres, FL | 3.0 | 2.0 | 1400 | $1,850 | $1.32 | 12d | 1 | 0.69mi |
| 809 Agnes Ave Lehigh Acres, FL | 3.0 | 2.0 | 1177 | $1,950 | $1.66 | 25d | 1 | 0.70mi |
| 5229 7th St W Lehigh Acres, FL | 3.0 | 2.0 | 1793 | $2,700 | $1.51 | 25d | 1 | 0.71mi |
| 5416 Bristo St Unit 5416 Lehigh Acres, FL | 3.0 | 2.0 | 1183 | $1,595 | $1.35 | 25d | 1 | 0.74mi |
| 1024 Chauncey Ave Lehigh Acres, FL | 4.0 | 3.0 | 1715 | $2,300 | $1.34 | 21d | 1 | 0.76mi |
| 903 Albany Ave Lehigh Acres, FL | 3.0 | 2.0 | 1200 | $1,800 | $1.50 | 25d | 1 | 0.77mi |
| 5408 Berryman St Lehigh Acres, FL | 3.0 | 2.0 | 1271 | $2,035 | $1.60 | 5d | 1 | 0.78mi |
| 5231 6th St W Lehigh Acres, FL | 4.0 | 3.5 | 1801 | $2,750 | $1.53 | 25d | 1 | 0.78mi |
| 5428 Bristo St Lehigh Acres, FL | 3.0 | 2.0 | 1500 | $1,600 | $1.07 | 3d | 1 | 0.80mi |
| 4715 4th St W Lehigh Acres, FL | 3.0 | 2.0 | 1445 | $1,695 | $1.17 | 25d | 1 | 0.80mi |
| 5210 2nd St W Lehigh Acres, FL | 4.0 | 2.0 | 1612 | $1,740 | $1.08 | 25d | 1 | 0.87mi |
| 5504 Butte St Lehigh Acres, FL | 3.0 | 2.0 | 1172 | $1,800 | $1.54 | 17d | 1 | 0.88mi |
| 5227 3rd St W Lehigh Acres, FL | 4.0 | 2.5 | 2102 | $2,260 | $1.08 | 25d | 1 | 0.90mi |
| 1043 Abrams Blvd Lehigh Acres, FL | 2.0 | 2.0 | 1197 | $1,475 | $1.23 | 5d | 1 | 0.92mi |
| 4982 Fairway Ct Unit 4982 Lehigh Acres, FL | 3.0 | 2.0 | 1200 | $1,850 | $1.54 | 5d | 1 | 0.92mi |
| 4984 Fairway Ct Unit 4984 Lehigh Acres, FL | 3.0 | 2.0 | 1200 | $1,850 | $1.54 | 23d | 1 | 0.92mi |
| 4986 Fairway Ct Unit 4986 Lehigh Acres, FL | 3.0 | 2.0 | 1200 | $1,850 | $1.54 | 23d | 1 | 0.92mi |
| 4787 Golfview Blvd Lehigh Acres, FL | 3.0 | 2.0 | 1200 | $1,899 | $1.58 | 5d | 1 | 0.94mi |
| 4716 Douglas Ln Lehigh Acres, FL | 3.0 | 2.0 | 1200 | $1,850 | $1.54 | 25d | 1 | 0.95mi |
| 4770 Jordan Ave S Lehigh Acres, FL | 3.0 | 2.0 | 1083 | $1,595 | $1.47 | 25d | 1 | 0.95mi |
| 8753 Buckingham Rd Fort Myers, FL | 3.0 | 2.0 | 2172 | $1,800 | $0.83 | 5d | 1 | 0.95mi |
| 1117 Abrams Blvd Lehigh Acres, FL | 3.0 | 2.0 | 1198 | $1,660 | $1.39 | 23d | 1 | 0.96mi |
Listing history 14 events
-
2026-05-03status Pending
-
2026-04-13price $284,900
-
2026-04-08price $289,900
-
2026-04-03price $294,900
-
2026-03-26price $299,900
-
2026-03-22price $304,900
-
2026-03-17$309,900 Active
-
2019-04-23soldstatus $175,000
-
2015-03-02price $97,400
-
2009-11-20soldstatus $84,900 532-char remark
Show marketing remark (532 chars)
Solid opportunity to own in the west side of Lehigh Acres. Large 3/2 floor plan with extra rooms (enclosed porch and studio room, screened porch as well). Double garage, CBS construction, built 2002, 2 HVAC units. All sit on about half an acre (2 building sites). This is NOT a short sale, this is a quick response seller. You're gonna like this one! Don't miss it! Special addenda with solid prequal through Wells Fargo or proof of cash needed with all offers. * * Underground propane gas tank in place for generator system * *
-
2009-10-10price $89,900 532-char remark
Show marketing remark (532 chars)
Solid opportunity to own in the west side of Lehigh Acres. Large 3/2 floor plan with extra rooms (enclosed porch and studio room, screened porch as well). Double garage, CBS construction, built 2002, 2 HVAC units. All sit on about half an acre (2 building sites). This is NOT a short sale, this is a quick response seller. You're gonna like this one! Don't miss it! Special addenda with solid prequal through Wells Fargo or proof of cash needed with all offers. * * Underground propane gas tank in place for generator system * *
-
2002-05-31soldstatus $99,400
-
1986-04-01soldstatus $3,000
-
1983-04-01soldstatus $10,600
ⓘ Source: listings_history table (triggers on properties + properties_extension) + one-shot
backfill from property_details.listing_events for pre-trigger history.
Tax reassessment forecast FL · Resets to sale price
- Current annual tax
- $995 · $83/mo
- Projected year-2 tax
- $2,365 · $197/mo
- Expected delta
- +$1,370/yr (+$114/mo · 137.6%)
ⓘ Screening estimate from a state-policy table — verify with the county assessor before closing.
Nearby sold comps map
Loading sold comps map…
Walkable amenities ~0.75 mi
Loading nearby amenities…
Taxation est. · year 1
- Rental income
- $26,165
- − Mortgage interest
- −$15,959
- − Property taxes
- −$995
- − Insurance
- −$1,424
- − Repairs & maintenance
- −$2,093
- − Management
- −$2,093
- − Depreciation
- −$8,288
- Taxable loss
- −$4,688
- Est. tax savings @ 24.0%
- +$1,125
- After-tax cash flow
- $1,447/yr
For passive investors: Depreciation is non-cash, so a rental often shows a tax loss while cash-flowing — sheltering income. Rental losses are passive: they offset passive income freely, and up to $25,000/yr can offset ordinary (W-2) income if you actively participate and your MAGI is under $100k (phasing out to $0 by $150k); unused losses carry forward. On sale, claimed depreciation is recaptured at up to 25%, and gains may owe capital-gains tax (a 1031 exchange can defer both). Figures are a year-1 estimate at your 24.0% rate — not tax advice; consult a CPA.
Schools (NCES district)
- District
- Lee
- NCES district ID
- 1201080
- Math proficiency
- 47% ▼ -11.00%
- Reading proficiency
- 50% ▼ -4.00%
- Median HH income
- $49,518
- Composite
- 41.49/100
- National rank
- #3458
- State rank
- #42 of 73 in FL
Livability — Lehigh Acres
- Score
- 59/100
- State rank
- #826
- US rank
- #20055
Category grades
Schools grade is shown separately in the Schools card above.
Census & demographics
- Census place
- Lehigh Acres, FL
- County
- Lee County · 788,662 people
- City population
- 130,638
- Metro
- Cape Coral-Fort Myers, FL
- Population (ZIP)
- 30,790
- Household income
- $77,723
- Rent vs Own
- Severe rent burden
- 587.0
Population outlook (Lee County) Hauer SSP2
- Today (2025)
- 871,946 people
- By 2030
- 955,468 · +9.6%
- By 2040
- 1,113,587 · +27.7%
- By 2050
- 1,256,891 · +44.1%
- By 2075
- 1,560,270 · +78.9%
- By 2100
- 1,726,848 · +98.0%
Race, ethnicity, and origin ACS 2023
- Neighborhood character
- Diverse neighborhood (Simpson 0.65)
- Race & ethnicity
- Hispanic / Latino 49% Two or more races 32% White 26% Black 19% Asian 2%
- Hispanic origin (detail)
- Mexican 9% Puerto Rican 13% Cuban 14% Dominican 2%
- Common ancestry
- Hispanic 7% Estonian 1% Romanian 1%
- Foreign-born
- 31% · Canada, Vietnam, Guatemala
- Languages at home
- 46% English-only · Spanish 41% French/Haitian/Cajun 9% Other Indo-European 2%
Political lean MEDSL · Lee
- 2024 margin
- Strong R (+28.4) · D 35.5% · R 63.9%
- 2008→2024 swing
- -18.0pp toward R · 2008: -10.4pp · 2024: -28.4pp
- All cycles
- 2024: R+28.4 2020: R+19.2 2016: R+20.4 2012: R+16.6 2008: R+10.4
Not yet ingested
- Civics
- —
Market trends
- HPI YoY
- ▼ -27.68%
- Current HPI
- 317.7147
- Rent YoY
- ▼ -4.69%
- Metro
- Cape Coral-Fort Myers, FL
- State GDP YoY
- ▲ 3.28%
- F500 in state
- 36
Industry mix (Fortune 500 HQ in FL)
| Industry | F500 HQs | Revenue |
|---|---|---|
| Industrial Technology | 2 | $29B |
|
||
| Insurance | 2 | $17B |
|
||
| Retail | 1 | $60B |
|
||
| Technology Distribution | 1 | $58B |
|
||
| Homebuilding | 1 | $35B |
|
||
| Technology Manufacturing | 1 | $35B |
|
||
Price history
+2587.7% since first listed14 events — show timeline
- 2026-05-03 Pending — FORTMLS
- 2026-04-13 Price Changed $284,900 FORTMLS
- 2026-04-08 Price Changed $289,900 FORTMLS
- 2026-04-03 Price Changed $294,900 FORTMLS
- 2026-03-26 Price Changed $299,900 FORTMLS
- 2026-03-22 Price Changed $304,900 FORTMLS
- 2026-03-17 Listed $309,900 FORTMLS
- 2019-04-23 Sold (Public Records) $175,000 Public Records
- 2015-03-02 Price Changed $97,400 FORTMLS
- 2009-11-20 Sold (MLS) $84,900 FORTMLS
- 2009-10-10 Price Changed $89,900 FORTMLS
- 2002-05-31 Sold (MLS) $99,400 FORTMLS
- 1986-04-01 Sold (Public Records) $3,000 Public Records
- 1983-04-01 Sold (Public Records) $10,600 Public Records
Property tax history
+3.7%/yrLatest (2019): $995 · -5.8% YoY. Source: county tax records.
Cash-flow waterfall
monthlySold comps — $/sqft
last 12 mo · ≤1 miLoading sold comps…