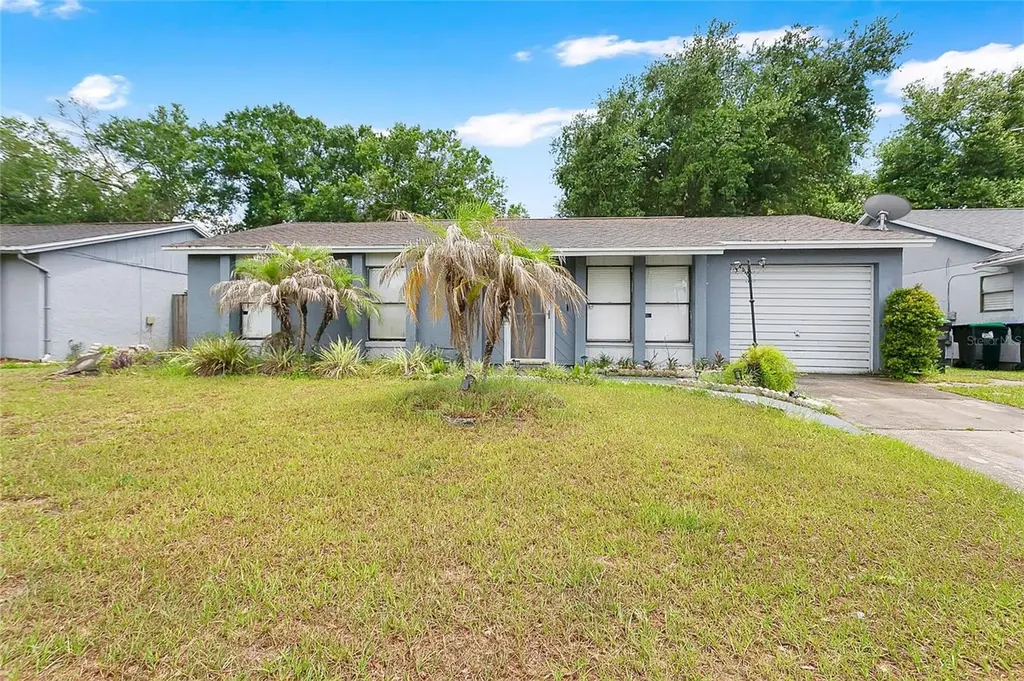
3610 Falling Leaf Ln · Lockhart, FL
Flood risk 1/10 · Minimal
- FEMA flood zone
- X (unshaded)
- Chance of flooding over 30 yrs
- 0.0%
- Est. flood insurance / yr
- $507 – $1,088
Fire risk 1/10 · Minimal
- Est. fire insurance / yr
- $947 – $1,759
Heat risk 9/10 · Severe
- Hot days now (above 108°F)
- 7 days/yr
- Hot days in 30 yrs
- 22 days/yr
Wind risk 9/10 · Severe
- Chance of severe wind over 30 yrs
- 99.0%
Air-quality risk 2/10 · Minimal
- Unhealthy air days now
- 0 days/yr
- Unhealthy air days in 30 yrs
- 1 days/yr
Risk factors via First Street. Map © Google.
Why this score? — see what drove the D+ grade
The composite is a weighted blend of 9 inputs, each scored 0–100. Each bar is that input's sub-score; the figure is the points it added to the 100-point composite (weight × sub-score).
- ARV discount +15.0/15.0
- Cash flow +13.7/30.0
- DSCR +4.1/10.0
- Schools +4.1/10.0
- Livability +3.8/5.0
- 1% rule +2.7/10.0
- Rent growth +2.6/5.0
- Condition / age +2.5/5.0
- Appreciation +0.0/10.0
$250,000
🖨 Deal sheet (PDF) 📄 Offer letter ✓ Due diligence
Listing remarks
Under contract-accepting backup offers. LOCATION, LOCATION, LOCATION! Welcome to Shady Grove a quiet neighborhood at the end of a cul-de-sac. NO HOA. Fantastic opportunity to own a home in one of Orlando's most convenient locations with access to highly rated schools and just minutes from Costco, Altamonte Mall, shopping, dining, entertainment, and major roadways. This 3-bedroom, 2-bath home offers plenty of space and endless potential for a first-time homebuyer, investor, or anyone looking to create their dream home. The garage has been converted into a 4th bedroom, providing additional living space, but can easily be converted back to a traditional garage if desired. Spacious screened e
Key facts
- Complete re-piping
- Converted garage
- New hvac system
Tags
Property features AI
Finance
- Other: Property zoned R-1; No CDD; Unfurnished
- HOA & community: No HOA association indicated; Pets allowed
Exterior
- Parking: Attached garage (1-car)
- Utilities: Public water; Public sewer; Electricity connected
- Home design: Single family residence; One story; Faces north; Homesteaded
- Construction: Block and stucco construction; Shingle roof; Slab foundation; Built on a 0.14-acre lot
- Exterior features: Sidewalk; Paved road access
Interior
- Kitchen: Range; Refrigerator; Freezer
- Bedrooms: 3 bedrooms
- Flooring: Tile; Wood
- Bathrooms: 2 full bathrooms
- Heating & cooling: Central heating (electric); Central air conditioning
- Interior features: Ceiling fans; Living room/dining room combo; Vaulted ceilings; Walk-in closets
- Laundry & utility: Interior laundry room; Washer; Dryer
Neighborhood map
What this means for you Summary
Snapshot
- This is a 3-bed/2.0-bath single-family listed at $250k.
Deal economics
- At list price, monthly cash flow is $18 ($211/yr) — positive.
- The deal already cash-flows at list — no discount required.
- To meet the 1% rule (rent ≥ 1% of price), the offer needs to be $193k (23.0% below list).
- Recommended offer: $193k (23.0% below list) — sets the bar for 1% rule.
- Cap rate 6.4% vs local median 4.6% in Lockhart — top-decile yield for the area; either an underpriced asset or a hidden risk that comps aren't pricing in. Stress-test before assuming the spread holds.
Location & tenants
- Location reads 76/100 on livability (#228 in FL, #3,605 nationally) — a middle-class / working-renter tenant base. Strengths: commute A+, cost of living A+, housing A+; Watch: amenities F, health & safety F.
- Orange (suburban): math 46% / reading 51% proficiency, ranked #43 of 73 in FL (top 59%) — families likely to look elsewhere, expect single-tenant / working-renter base with shorter leases.
- Zoned schools: Riverside Elementary (math 34% / reading 33%, grade F, #1,758 of 2,144 statewide, top 83%, 540 students, 72% FRL) — zoned schools average 72% FRL vs 56% district-wide (16 pts higher); higher-poverty schools than district average — tighter screening recommended.
- Zoned-school proficiency averages 34% at this address vs 48% district-wide (-15 pts) — the specific schools serving this property underperform the Orange average; the district grade overstates school quality for this exact location.
- Market conditions: Rents flat; 160 active listings in the ZIP; 40 comparable units currently listed for rent nearby; rentals at typical pace (median 22d on market — plan ~3-4 weeks tenant-placement turnaround); 8,053 units permitted in Orange County in 2024 (3,133 in 5+ unit buildings).
- This rent runs 38% of the median local income ($61k/yr) — at the standard rent-burdened threshold; future hikes will face affordability resistance.
Forward outlook
- Local home prices are declining (-3.0%/yr); year-one equity from $2k of loan paydown is wiped out by about $8k of value loss. Plan a longer hold.
- Orange County population projected at +52% by 2050 — long-run rental-demand tailwind backs the buy-and-hold thesis.
Negotiation context
- Only 3 days on market — expect competitive offers; lowballing is unlikely to land.
- Current owner paid $72k; list at $250k implies a 250% gain — meaningful room to come down on a strong offer.
Risks & watch-outs
- Climate carrying-cost: severe wind risk, 99% chance of damaging wind over 30y; extreme-heat days projected 7→22/yr by 2055 (HVAC capex compounding) — expect insurance premiums to compound above CPI over the hold.
Questions for the listing agent
- Is there a deadline driving the sale (1031 exchange, divorce, estate, relocation)? That informs how much negotiation room exists.
- The area grade is low — what's the realistic commute time and amenity access for the typical tenant pool here? Any planned neighborhood developments (good or bad) we should know about?
- What's the average days-on-market for RENTAL listings here right now (not sales)? A rising rental-DOM trend means longer vacancies and softer asking-rent achievability than the comps imply.
- What's the recent tenant-quality profile in this submarket — average credit score on applications, eviction rate, late-payment / NSF rate, and stable-employment percentage? A property-management company in the area should have these aggregated.
- How much new for-sale + rental construction is in the pipeline within 1–3 miles? Heavy new supply typically softens prices + rents 12–24 months out; constrained supply supports both.
Investment metrics
- 1% rule
- 0.77% ✗
- Cap rate
- 6.38%
- Cash-on-cash
- 0.30%
- DSCR
- 1.01
- GRM
- 10.8
CMA / ARV
- ARV (on-the-fly)
- $306,432
- Comps found
- 6
Show comp detail 6 sales within ~0.75 mi
| Address | Dist | Beds/Ba | Sqft | Sold | Price | $/sf | Match |
|---|---|---|---|---|---|---|---|
| 3741 Shady Grove Cir | 0.18mi | 3/2.0 | 1,044 (-9%) | 2mo | $180,000 | $172 | 74 |
| 3602 Oranole Rd | 0.33mi | 2/2.0 (-1) | 1,101 (-4%) | 4mo | $290,000 | $263 | 68 |
| 7806 Compass Dr | 0.49mi | 3/2.0 | 1,134 (-2%) | 11mo | $335,000 | $295 | 65 |
| 3509 Greatbear Ct | 0.43mi | 3/2.0 | 1,122 (-3%) | 21mo | $330,000 | $294 | 58 |
| 3504 Erie Ct | 0.52mi | 3/2.0 | 1,295 (+12%) | 22mo | $345,000 | $266 | 36 |
| 2407 Greenleaf Dr | 0.72mi | 2/1.0 (-1) | 1,064 (-8%) | 20mo | $265,000 | $249 | 28 |
Match score weights: distance 35% · size 25% · config 20% · recency 20%. Top-matched comps best support the ARV.
Projected returns pro-forma
-3.0% appreciation · 0.5% rent growth · sell at horizon
- IRR
- -18.4%
- Equity multiple
- 0.37×
- Total profit
- $-44,225
- Equity at exit
- $37,276
- IRR
- -15.8%
- Equity multiple
- 0.20×
- Total profit
- $-55,955
- Equity at exit
- $21,615
Cash invested: $70,000 (down + closing). Projections, not guarantees.
Landlord ↔ Tenant lean methodology
- Overall (STATE)
- 87 Strongly Landlord-Friendly
- State Florida
- 87 Strongly Landlord-Friendly · R+3
- County
- — inherits STATE
- City
- — inherits STATE
ZIP-level market 32810
- Home prices YoY
- -18.5%
- Rents YoY
- 0.5%
- Active inventory
- 160
- Price-to-rent
- 10.8×
Monthly cashflow live
- Estimated rent
- $1,926 high interval (Pro) →
- Mortgage (P&I)
- −$1,311
- Tax from tax record
- −$89 /mo · $1,062/yr
- Insurance
- −$104
- HOA
- −$0
- Vacancy / Maint / Mgmt
- −$404
- Net cashflow
- $18
Break-even live
Sensitivity live
| Price | -10% $159 | -5% $88 | +0% $18 | +5% $-53 | +10% $-124 |
|---|---|---|---|---|---|
| Rent | -10% $-135 | -5% $-58 | +0% $18 | +5% $94 | +10% $170 |
| Rate | -1.0pp $143 | -0.5pp $81 | base $18 | +0.5pp $-47 | +1.0pp $-113 |
UW: 25.0% down · 7.5% · 30yr · 1.5% tax · 5.0% vac · 8.0% maint · 8.0% mgmt
Financing live
Cash to close
- Down payment
- $62,500
- Closing costs
- $7,500
- Reserves months
- —
- Total cash needed
- —
Loan-product check · same deal, 3 products live
Conventional
25% down · 7.5% · 30yr
- Down + closing
- —
- Monthly P&I
- —
- Monthly cashflow
- —
- DSCR
- —
- Eligible?
- —
Personal DTI + credit; lowest rate.
DSCR
20% down · 8.5% · 30yr
- Down + closing
- —
- Monthly P&I
- —
- Monthly cashflow
- —
- DSCR
- —
- Eligible?
- —
No personal income docs; deal must DSCR.
Hard money
10% down · 12.0% · 12mo
- Down + closing
- —
- Monthly P&I
- —
- Monthly cashflow
- —
- DSCR
- —
- Eligible?
- —
Short-term bridge; refi at stabilization.
Rent comps 40 comps
| Address | Beds | Baths | Sqft | Rent | $/sqft | DOM | Units | Dist |
|---|---|---|---|---|---|---|---|---|
| 3709 Needles Dr Orlando, FL | 3.0 | 1.5 | 1250 | $1,750 | $1.40 | 16d | 1 | 0.20mi |
| 3120 Drake Dr Unit 1258738P Orlando, FL | 3.0 | 2.0 | 1442 | $6,376 | $4.42 | 3d | 1 | 0.25mi |
| 3108 Pembrook Dr Orlando, FL | 3.0 | 2.0 | 1346 | $2,210 | $1.64 | 5d | 1 | 0.30mi |
| 3806 Groome Dr Orlando, FL | 3.0 | 2.0 | 1111 | $2,400 | $2.16 | 25d | 1 | 0.50mi |
| 858 Grand Regency Pointe #103 Altamonte Springs, FL | 3.0 | 2.0 | 1194 | $1,800 | $1.51 | 4d | 1 | 0.51mi |
| 852 Grand Regency Pointe #100 Altamonte Springs, FL | 2.0 | 2.0 | 1106 | $1,600 | $1.45 | 25d | 1 | 0.51mi |
| 860 Grand Regency Pointe Altamonte Springs, FL | 3.0 | 2.0 | 1266 | $1,750 | $1.38 | 25d | 1 | 0.53mi |
| 2740 Maitland Crossing Way #201 Orlando, FL | 2.0 | 2.0 | 1064 | $1,595 | $1.50 | 25d | 1 | 0.55mi |
| 2617 Drake Dr Orlando, FL | 3.0 | 2.0 | 1347 | $2,001 | $1.49 | 25d | 1 | 0.56mi |
| 2729 Maitland Crossing Way #304 Orlando, FL | 2.0 | 2.0 | 1009 | $1,700 | $1.68 | 25d | 1 | 0.58mi |
| 3717 Clubside Pointe Dr Unit 1 Orlando, FL | 3.0 | 3.0 | 1344 | $2,100 | $1.56 | 25d | 1 | 0.60mi |
| 2705 Maitland Crossing Way Unit 5-102 Orlando, FL | 2.0 | 2.0 | 1064 | $1,725 | $1.62 | 16d | 1 | 0.61mi |
| 2705 Maitland Crossing Way Unit 303 Orlando, FL | 2.0 | 2.0 | 1009 | $1,695 | $1.68 | 16d | 1 | 0.61mi |
| 3757 Clubside Pointe Dr Orlando, FL | 3.0 | 2.0 | 1264 | $1,750 | $1.38 | 25d | 1 | 0.61mi |
| 826 Grand Regency Pointe #202 Altamonte Springs, FL | 2.0 | 2.0 | 1170 | $1,625 | $1.39 | 4d | 1 | 0.63mi |
| 826 Grand Regency Pointe #202 Altamonte Springs, FL | 2.0 | 2.0 | 1170 | $1,625 | $1.39 | 6d | 1 | 0.63mi |
| 822 Grand Regency Pointe #103 Altamonte Springs, FL | 2.0 | 2.0 | 1106 | $1,495 | $1.35 | 16d | 1 | 0.65mi |
| 822 Grand Regency Pointe #103 Altamonte Springs, FL | 2.0 | 2.0 | 1106 | $1,495 | $1.35 | 21d | 1 | 0.65mi |
| 825 Grand Regency Pointe #103 Altamonte Springs, FL | 3.0 | 2.0 | 1194 | $1,800 | $1.51 | 25d | 1 | 0.65mi |
| 823 Grand Regency Pointe Altamonte Springs, FL | 3.0 | 2.0 | 1194 | $1,700 | $1.42 | 25d | 1 | 0.66mi |
| 821 Grand Regency Pointe Altamonte Springs, FL | 2.0 | 2.0 | 1170 | $1,470 | $1.26 | 25d | 1 | 0.67mi |
| 2639 Maitland Crossing Way #206 Orlando, FL | 2.0 | 2.0 | 1009 | $1,750 | $1.73 | 25d | 1 | 0.68mi |
| 2639 Maitland Crossing Way #107 Orlando, FL | 2.0 | 2.0 | 1064 | $1,800 | $1.69 | 25d | 1 | 0.68mi |
| 7618 Forest City Rd Orlando, FL | 1.0–3.0 | 1.0–2.0 | 937 | $1,662 | $1.77 | 5d | 3 | 0.70mi |
| 2549 Maitland Crossing Way #11207 Orlando, FL | 4.0 | 2.0 | 1313 | $1,950 | $1.49 | 25d | 1 | 0.70mi |
| 2404 Calloway Dr Orlando, FL | 3.0 | 2.0 | 1224 | $2,170 | $1.77 | 25d | 1 | 0.71mi |
| 2603 Maitland Crossing Way Orlando, FL | 2.0 | 2.0 | 1064 | $1,550 | $1.46 | 9d | 1 | 0.73mi |
| 9301 Summit Centre Way Orlando, FL | 3.0 | 1.0–2.0 | 1012 | $2,945 | $2.91 | 5d | 1 | 0.77mi |
| 6998 Woodlake Dr Orlando, FL | 2.0 | 2.5 | 1053 | $1,600 | $1.52 | 25d | 1 | 0.85mi |
| 3911 Alpert Dr Orlando, FL | 3.0 | 2.0 | 1278 | $1,795 | $1.40 | 3d | 1 | 0.87mi |
| 3940 Alpert Dr Orlando, FL | 3.0 | 1.5 | 1100 | $1,695 | $1.54 | 16d | 1 | 0.91mi |
| 3908 Magnolia Pointe Ln Orlando, FL | 3.0 | 2.0 | 1208 | $1,795 | $1.49 | 25d | 1 | 0.93mi |
| 6750 Woodlake Dr Orlando, FL | 1.0–2.0 | 1.0–2.0 | 797 | $1,700 | $2.13 | 4d | 18 | 0.97mi |
| 912 Innovation Way Altamonte Springs, FL | 1.0–3.0 | 1.0–2.0 | 1055 | $2,654 | $2.52 | 3d | 28 | 0.97mi |
| 9000 Summit Centre Way Orlando, FL | 1.0–3.0 | 1.0–2.0 | 1116 | $2,375 | $2.13 | 4d | 15 | 0.99mi |
| 8636 Villa Pt Orlando, FL | 1.0–3.0 | 1.0–2.0 | 1156 | $2,225 | $1.92 | 3d | 38 | 1.00mi |
| 6741 Magnolia Pointe Cir Orlando, FL | 3.0 | 2.0 | 1248 | $1,695 | $1.36 | 25d | 1 | 1.00mi |
| 7120 Forest City Rd Orlando, FL | 1.0–3.0 | 1.0–2.0 | 912 | $1,499 | $1.64 | 9d | 11 | 1.01mi |
| 895 Broadstone Way Altamonte Springs, FL | 3.0 | 1.0–2.0 | 1025 | $2,771 | $2.70 | 3d | 33 | 1.06mi |
| 588 Brantley Terrace Way Altamonte Springs, FL | 3.0 | 2.0 | 1309 | $1,875 | $1.43 | 25d | 2 | 1.12mi |
Listing history 5 events
-
2026-06-19status $250,000 Pending 3 DOM
-
2026-06-18days on market $250,000 Active 3 DOM
-
2026-06-17days on market $250,000 Active 2 DOM
-
2026-06-16remarks 699-char remark
-
2026-06-16$250,000 Active 1 DOM
ⓘ Source: listings_history table (triggers on properties + properties_extension) + one-shot
backfill from property_details.listing_events for pre-trigger history.
Tax reassessment forecast FL · Resets to sale price
- Current annual tax
- $1,062 · $89/mo
- Projected year-2 tax
- $2,075 · $173/mo
- Expected delta
- +$1,013/yr (+$84/mo · 95.4%)
ⓘ Screening estimate from a state-policy table — verify with the county assessor before closing.
Climate risk First Street
- Flood 1/10 Low FEMA zone X (unshaded) · 0% chance over 30 yrs
- Wildfire 1/10 Low
- Heat 9/10 Extreme 7 d/yr ≥108°F today · 22 d/yr by 30 yrs out
- Wind 9/10 Extreme 99% chance of damaging wind over 30 yrs
- Air quality 2/10 Low 0 unhealthy d/yr today · 1 by 30 yrs out
Nearby sold comps map
Loading sold comps map…
Walkable amenities ~0.75 mi
Loading nearby amenities…
Taxation est. · year 1
- Rental income
- $23,108
- − Mortgage interest
- −$14,004
- − Property taxes
- −$1,062
- − Insurance
- −$1,250
- − Repairs & maintenance
- −$1,849
- − Management
- −$1,849
- − Depreciation
- −$7,273
- Taxable loss
- −$4,178
- Est. tax savings @ 24.0%
- +$1,003
- After-tax cash flow
- $1,214/yr
For passive investors: Depreciation is non-cash, so a rental often shows a tax loss while cash-flowing — sheltering income. Rental losses are passive: they offset passive income freely, and up to $25,000/yr can offset ordinary (W-2) income if you actively participate and your MAGI is under $100k (phasing out to $0 by $150k); unused losses carry forward. On sale, claimed depreciation is recaptured at up to 25%, and gains may owe capital-gains tax (a 1031 exchange can defer both). Figures are a year-1 estimate at your 24.0% rate — not tax advice; consult a CPA.
Schools (NCES district)
- District
- Orange
- NCES district ID
- 1201440
- Math proficiency
- 46% ▼ -9.00%
- Reading proficiency
- 51% ▼ -2.00%
- Median HH income
- $49,350
- Composite
- 41.47/100
- National rank
- #3461
- State rank
- #43 of 73 in FL
Livability — Lockhart
- Score
- 76/100
- State rank
- #228
- US rank
- #3605
Category grades
Schools grade is shown separately in the Schools card above.
Census & demographics
- Census place
- Lockhart, FL
- County
- Orange County · 1,471,359 people
- City population
- 37,127
- Metro
- Orlando-Kissimmee-Sanford, FL
- Population (ZIP)
- 36,927
- Household income
- $60,799
- Rent vs Own
- Severe rent burden
- 1859.0
Population outlook (Orange County) Hauer SSP2
- Today (2025)
- 1,618,226 people
- By 2030
- 1,787,404 · +10.5%
- By 2040
- 2,125,621 · +31.4%
- By 2050
- 2,454,016 · +51.6%
- By 2075
- 3,173,711 · +96.1%
- By 2100
- 3,607,781 · +122.9%
Race, ethnicity, and origin ACS 2023
- Neighborhood character
- Highly diverse neighborhood (Simpson 0.72)
- Race & ethnicity
- Black 35% Hispanic / Latino 29% White 25% Two or more races 16% Asian 3% Native American 1%
- Hispanic origin (detail)
- Mexican 2% Puerto Rican 17% Cuban 3%
- Common ancestry
- Hispanic 9% Lithuanian 1% Slovak 1%
- Foreign-born
- 19% · Canada, Vietnam, Jamaica
- Languages at home
- 67% English-only · Spanish 21% French/Haitian/Cajun 7% Other Indo-European 1%
Political lean MEDSL · Orange
- 2024 margin
- D (+13.6) · D 56.1% · R 42.5% · Other 1.3%
- 2008→2024 swing
- -5.0pp toward R · 2008: 18.6pp · 2024: 13.6pp
- All cycles
- 2024: D+13.6 2020: D+23.1 2016: D+24.6 2012: D+18.2 2008: D+18.6
Not yet ingested
- Civics
- —
Market trends
- HPI YoY
- ▼ -78.77%
- Current HPI
- 347.7447
- Rent YoY
- ▲ 0.50%
- Metro
- Orlando-Kissimmee-Sanford, FL
- State GDP YoY
- ▲ 3.28%
- F500 in state
- 36
Industry mix (Fortune 500 HQ in FL)
| Industry | F500 HQs | Revenue |
|---|---|---|
| Industrial Technology | 2 | $29B |
|
||
| Insurance | 2 | $17B |
|
||
| Retail | 1 | $60B |
|
||
| Technology Distribution | 1 | $58B |
|
||
| Homebuilding | 1 | $35B |
|
||
| Technology Manufacturing | 1 | $35B |
|
||
Price history
+331.0% since first listed3 events — show timeline
- 2026-06-15 Listed $250,000 Stellar MLS as Distributed by MLS Grid
- 1996-09-24 Sold (Public Records) $71,500 Public Records
- 1996-03-15 Sold (Public Records) $58,000 Public Records
Property tax history
+2.1%/yrLatest (2025): $1,062 · +11.8% YoY. Source: county tax records.
Cash-flow waterfall
monthlySold comps — $/sqft
last 12 mo · ≤1 miLoading sold comps…