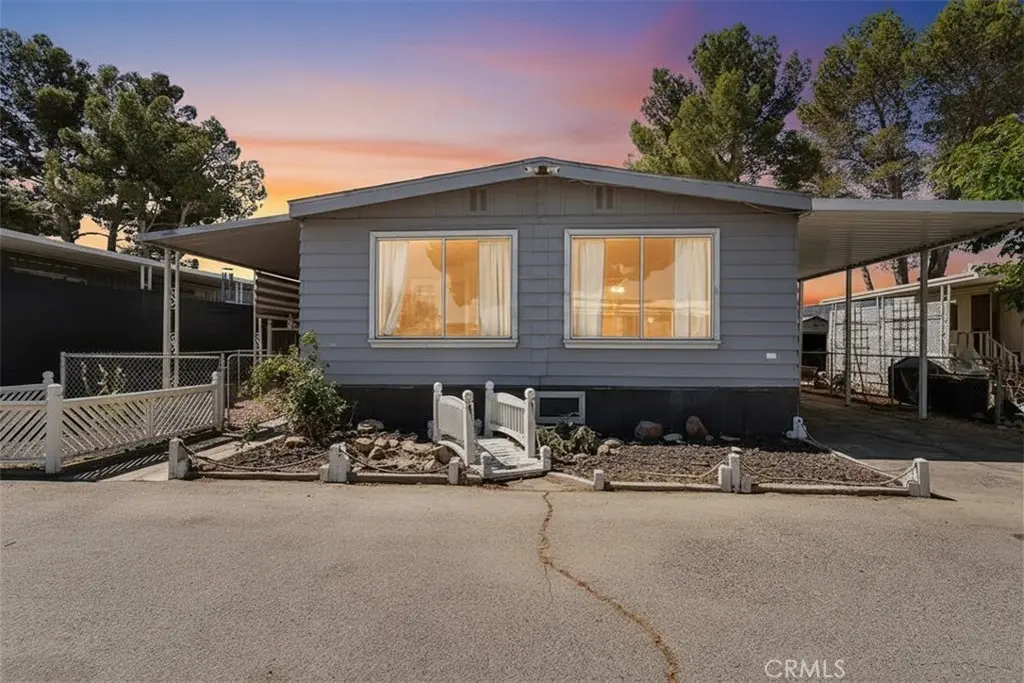
18772 Bellflower St #5 · Adelanto, CA
Flood risk 1/10 · Minimal
- FEMA flood zone
- X (shaded)
- Chance of flooding over 30 yrs
- 0.0%
- Est. flood insurance / yr
- $507 – $1,088
Fire risk 4/10 · Minor
- Est. fire insurance / yr
- $659 – $1,223
Heat risk 8/10 · Major
- Hot days now (above 99°F)
- 6 days/yr
- Hot days in 30 yrs
- 17 days/yr
Wind risk 1/10 · Minimal
- Chance of severe wind over 30 yrs
- —
Air-quality risk 8/10 · Major
- Unhealthy air days now
- 16 days/yr
- Unhealthy air days in 30 yrs
- 20 days/yr
Risk factors via First Street. Map © Google.
Why this score? — see what drove the B+ grade
The composite is a weighted blend of 9 inputs, each scored 0–100. Each bar is that input's sub-score; the figure is the points it added to the 100-point composite (weight × sub-score).
- Cash flow +30.0/30.0
- 1% rule +10.0/10.0
- DSCR +10.0/10.0
- Appreciation +10.0/10.0
- ARV discount +7.5/15.0
- Rent growth +3.7/5.0
- Livability +2.4/5.0
- Schools +2.2/10.0
- Condition / age +2.2/5.0
$96,000
🖨 Deal sheet (PDF) 📄 Offer letter ✓ Due diligence
Listing remarks
Welcome to this delightful home in the heart of Adelanto, offering comfort, style, and affordability. Featuring a cute open floor plan, this property provides a bright and airy living space perfect for relaxing or entertaining. The spacious kitchen flows seamlessly into the living and dining areas, creating a welcoming environment for everyday living. The large primary bathroom offers a touch of luxury with ample space and thoughtful design, making it a perfect retreat. With low space rent, this home is an excellent opportunity for those seeking value without compromising on comfort. Enjoy a peaceful community setting while being conveniently close to local amenities, schools, and parks. Th
Key facts
- Open floor plan
- Close to schools
- Spacious kitchen
Tags
Property features AI
Finance
- Other: Living area source: public records; Property has public records parcel number 0459084070000
- HOA & community: Located in Sierra Sands Mobile Home Park; Monthly land lease: $540 (park-managed); Community setting: Rural, mountainous; Manager approval required
Exterior
- Parking: Attached carport (1 space)
- Utilities: Public sewer; District/public water
- Home design: Single-story mobile home (mobile home remains); Mobile dimensions approximately 12 ft wide by 56 ft long; Entry level: 1
- Construction: Year built (from public records)
- Exterior features: No pool; One shed on the property; Lot in 0–1 unit per acre density
Interior
- Bathrooms: 2 full bathrooms
- Interior features: Front door entry; Single-level home
- Laundry & utility: Inside laundry
Neighborhood map
What this means for you Summary
Snapshot
- This is a 2-bed/2.0-bath manufactured listed at $96k. Condition is rated fair.
Deal economics
- At list price, monthly cash flow is $695 ($8k/yr) — positive.
- The deal already cash-flows at list — no discount required.
- Meets the 1% rule at list price ($2k rent vs $96k).
- Recommended offer: $95k (1.5% below list) — sets the bar for market timing.
- Cap rate 15.0% vs local median 4.2% in Adelanto — top-decile yield for the area; either an underpriced asset or a hidden risk that comps aren't pricing in. Stress-test before assuming the spread holds.
Location & tenants
- Location reads 47/100 on livability (#1,250 in CA) — a working-class tenant base; expect higher turnover. Strengths: housing A+; Watch: crime D, schools F, amenities F.
- Victor Valley Union High (urban): math 25% / reading 25% proficiency, ranked #407 of 517 in CA (top 79%) — low school quality limits family demand, transient renter base, plan for 1-2y turnover; 72% free/reduced lunch — lower-income household profile, screen leases tightly.
- Market conditions: Rents rising fast (+4.7%/yr); 631 active listings in the ZIP; 5 comparable units currently listed for rent nearby; rentals leasing fast (median 0d on market — plan ~1-2 weeks tenant-placement turnaround); 5,458 units permitted in San Bernardino County in 2024 (1,500 in 5+ unit buildings).
- This rent runs 30% of the median local income ($69k/yr) — at the standard rent-burdened threshold; future hikes will face affordability resistance.
Forward outlook
- In year one you build about $10k of equity ($664 loan paydown + $10k appreciation (10.0% local appreciation)).
- San Bernardino County population projected at +15% by 2050 — modest demand growth; plan on rents tracking national, not racing it.
- At projected returns (10.0% appreciation + 4.7% rent growth), your $27k cash investment doubles in ~2 years — after that, you're playing with house money.
- By year 4, paydown + projected appreciation supports a ~$36k cash-out refi (75% LTV) — recoverable capital for the next deal without selling this one.
Negotiation context
- It's been on market 26 days — a 2% lower offer ($95k) is reasonable based on typical stale-listing flexibility.
Risks & watch-outs
- Climate carrying-cost: extreme-heat days projected 6→17/yr by 2055 (HVAC capex compounding) — expect insurance premiums to compound above CPI over the hold.
Questions for the listing agent
- Have any recent inspections been done? Can we get a copy of the seller's disclosures and any deferred-maintenance estimates?
- Built in 1974 — when were the roof, HVAC, electrical panel, plumbing, and water heater last replaced?
- Is there a deadline driving the sale (1031 exchange, divorce, estate, relocation)? That informs how much negotiation room exists.
- Schools are F-rated, which usually means shorter tenancies and higher turnover. Who's the typical renter profile here, and what's been the actual vacancy rate?
- Crime grade is D in this area — have there been break-ins, vandalism, or insurance claims at this property in the last 3 years? What carrier currently insures it and at what premium?
- What's the average days-on-market for RENTAL listings here right now (not sales)? A rising rental-DOM trend means longer vacancies and softer asking-rent achievability than the comps imply.
- What's the recent tenant-quality profile in this submarket — average credit score on applications, eviction rate, late-payment / NSF rate, and stable-employment percentage? A property-management company in the area should have these aggregated.
- How much new for-sale + rental construction is in the pipeline within 1–3 miles? Heavy new supply typically softens prices + rents 12–24 months out; constrained supply supports both.
Investment metrics
- 1% rule
- 1.79% ✓
- Cap rate
- 14.98%
- Cash-on-cash
- 31.01%
- DSCR
- 2.38
- GRM
- 4.7
CMA / ARV
- ARV (on-the-fly)
- $51,072
- Comps found
- 1
Show comp detail 1 sale within ~0.75 mi
| Address | Dist | Beds/Ba | Sqft | Sold | Price | $/sf | Match |
|---|---|---|---|---|---|---|---|
| 18772 Bellflower #52 | 0.07mi | 3/2.0 (+1) | 1,440 (+7%) | 19mo | $55,000 | $38 | 64 |
Match score weights: distance 35% · size 25% · config 20% · recency 20%. Top-matched comps best support the ARV.
Projected returns pro-forma
10.0% appreciation · 4.68% rent growth · sell at horizon
- IRR
- 48.9%
- Equity multiple
- 4.70×
- Total profit
- $99,509
- Equity at exit
- $86,484
- IRR
- 43.4%
- Equity multiple
- 10.85×
- Total profit
- $264,715
- Equity at exit
- $186,507
Cash invested: $26,880 (down + closing). Projections, not guarantees.
Landlord ↔ Tenant lean methodology
- Overall (STATE)
- 18 Strongly Tenant-Friendly
- State California
- 18 Strongly Tenant-Friendly · D+13
- County
- — inherits STATE
- City
- — inherits STATE
ZIP-level market 92301
- Home prices YoY
- 10.0%
- Rents YoY
- 4.7%
- Active inventory
- 631
- Price-to-rent
- 4.7×
Monthly cashflow live
- Estimated rent
- $1,719 high interval (Pro) →
- Mortgage (P&I)
- −$503
- Tax est. 1.5%
- −$120 /mo · $1,440/yr
- Insurance
- −$40
- HOA
- −$0
- Vacancy / Maint / Mgmt
- −$361
- Net cashflow
- $695
Break-even live
Sensitivity live
| Price | -10% $761 | -5% $728 | +0% $695 | +5% $662 | +10% $628 |
|---|---|---|---|---|---|
| Rent | -10% $559 | -5% $627 | +0% $695 | +5% $763 | +10% $830 |
| Rate | -1.0pp $743 | -0.5pp $719 | base $695 | +0.5pp $670 | +1.0pp $644 |
UW: 25.0% down · 7.5% · 30yr · 1.5% tax · 5.0% vac · 8.0% maint · 8.0% mgmt
Financing live
Cash to close
- Down payment
- $24,000
- Closing costs
- $2,880
- Reserves months
- —
- Total cash needed
- —
Loan-product check · same deal, 3 products live
Conventional
25% down · 7.5% · 30yr
- Down + closing
- —
- Monthly P&I
- —
- Monthly cashflow
- —
- DSCR
- —
- Eligible?
- —
Personal DTI + credit; lowest rate.
DSCR
20% down · 8.5% · 30yr
- Down + closing
- —
- Monthly P&I
- —
- Monthly cashflow
- —
- DSCR
- —
- Eligible?
- —
No personal income docs; deal must DSCR.
Hard money
10% down · 12.0% · 12mo
- Down + closing
- —
- Monthly P&I
- —
- Monthly cashflow
- —
- DSCR
- —
- Eligible?
- —
Short-term bridge; refi at stabilization.
Rent comps 5 comps
| Address | Beds | Baths | Sqft | Rent | $/sqft | DOM | Units | Dist |
|---|---|---|---|---|---|---|---|---|
| 11159 Chaparral Ave Unit A Adelanto, CA | 2.0 | 1.0 | 884 | $1,395 | $1.58 | 0d | 1 | 0.21mi |
| 11388 Lee Ave Adelanto, CA | 3.0 | 2.0 | 1058 | $1,540 | $1.46 | 0d | 1 | 0.57mi |
| 18254 Madrone St Adelanto, CA | 3.0 | 1.0 | 1200 | $1,950 | $1.62 | 3d | 1 | 0.68mi |
| 12048 Sand Ave Unit B Adelanto, CA | 2.0 | 1.0 | 900 | $1,725 | $1.92 | 0d | 1 | 1.13mi |
| 10415 Buckboard Cir Adelanto, CA | 3.0 | 2.0 | 1126 | $2,200 | $1.95 | 0d | 1 | 1.14mi |
Listing history 15 events
-
2026-06-21days on market $96,000 Active 26 DOM
-
2026-06-18days on market $96,000 Active 23 DOM
-
2026-06-17days on market $96,000 Active 22 DOM
-
2026-06-16days on market $96,000 Active 21 DOM
-
2026-06-15days on market $96,000 Active 20 DOM
-
2026-06-13days on market $96,000 Active 18 DOM
-
2026-06-09days on market $96,000 Active 14 DOM
-
2026-06-08days on market $96,000 Active 13 DOM
-
2026-06-07days on market $96,000 Active 12 DOM
-
2026-06-04days on market $96,000 Active 9 DOM
-
2026-06-03days on market $96,000 Active 8 DOM
-
2026-06-02days on market $96,000 Active 7 DOM
-
2026-06-01days on market $96,000 Active 6 DOM
-
2026-05-31days on market $96,000 Active 5 DOM
-
2026-05-26$96,000 Active
ⓘ Source: listings_history table (triggers on properties + properties_extension) + one-shot
backfill from property_details.listing_events for pre-trigger history.
Climate risk First Street
- Flood 1/10 Low FEMA zone X (shaded) · 0% chance over 30 yrs
- Wildfire 4/10 Moderate
- Heat 8/10 Severe 6 d/yr ≥99°F today · 17 d/yr by 30 yrs out
- Wind 1/10 Low
- Air quality 8/10 Severe 16 unhealthy d/yr today · 20 by 30 yrs out
Nearby sold comps map
Loading sold comps map…
Walkable amenities ~0.75 mi
Loading nearby amenities…
Taxation est. · year 1
- Rental income
- $20,630
- − Mortgage interest
- −$5,377
- − Property taxes
- −$1,440
- − Insurance
- −$480
- − Repairs & maintenance
- −$1,650
- − Management
- −$1,650
- − Depreciation
- −$2,793
- Taxable income
- $7,239
- Est. tax owed @ 24.0%
- −$1,737
- After-tax cash flow
- $6,599/yr
For passive investors: Depreciation is non-cash, so a rental often shows a tax loss while cash-flowing — sheltering income. Rental losses are passive: they offset passive income freely, and up to $25,000/yr can offset ordinary (W-2) income if you actively participate and your MAGI is under $100k (phasing out to $0 by $150k); unused losses carry forward. On sale, claimed depreciation is recaptured at up to 25%, and gains may owe capital-gains tax (a 1031 exchange can defer both). Figures are a year-1 estimate at your 24.0% rate — not tax advice; consult a CPA.
Condition & rehab AI · 24 photos
This home requires moderate renovations to improve its condition and increase its value. The interior and exterior need significant updates, including new cabinets, fixtures, and flooring, to make it move-in ready.
Repairs flagged
- Major kitchen cabinets — severely dated and worn
- Major bathroom fixtures — dated and small
- Moderate exterior siding — weathered and needs repainting
- Major flooring — carpeted and worn
Value-add opportunities
- Both paint interior walls — refreshes the interior and improves curb appeal
- Both replace kitchen cabinets — modernizes the kitchen and improves functionality
- Both repair exterior siding — enhances curb appeal and improves home value
- Both replace bathroom fixtures — modernizes the bathroom and improves functionality
- Both replace flooring — modernizes the interior and improves functionality
Renovation cost estimate screening
| Repair item | Severity | Est. cost |
|---|---|---|
| kitchen cabinets · severely dated and worn | Major | $15,000–50,000 |
| bathroom fixtures · dated and small | Major | $15,000–50,000 |
| exterior siding · weathered and needs repainting | Moderate | $3,000–15,000 |
| flooring · carpeted and worn | Major | $15,000–50,000 |
| Total estimated repair cost · 4 items | $48,000–165,000 |
Value-add ROI direction
- Both paint interior walls — refreshes the interior and improves curb appeal ↑
- Both replace kitchen cabinets — modernizes the kitchen and improves functionality ↑
- Both repair exterior siding — enhances curb appeal and improves home value ↑
- Both replace bathroom fixtures — modernizes the bathroom and improves functionality ↑
- Both replace flooring — modernizes the interior and improves functionality ↑
ⓘ Cost ranges are severity-bucket heuristics (US national rule-of-thumb). Get contractor quotes + a written scope before underwriting a rehab budget.
Schools (NCES district)
- District
- Victor Valley Union High
- NCES district ID
- 0636972
- Math proficiency
- 25% ▲ 6.00%
- Reading proficiency
- 25% ▼ -12.00%
- Median HH income
- $45,112
- Composite
- 21.6/100
- National rank
- #8296
- State rank
- #407 of 517 in CA
Livability — Adelanto
- Score
- 47/100
- State rank
- #1250
- US rank
- #26338
Category grades
Schools grade is shown separately in the Schools card above.
Census & demographics
- Census place
- Adelanto, CA
- County
- San Bernardino County · 2,030,291 people
- City population
- 38,577
- Metro
- Riverside-San Bernardino-Ontario, CA
- Population (ZIP)
- 38,577
- Household income
- $68,676
- Rent vs Own
- Severe rent burden
- 1345.0
Population outlook (San Bernardino County) Hauer SSP2
- Today (2025)
- 2,300,329 people
- By 2030
- 2,378,907 · +3.4%
- By 2040
- 2,523,137 · +9.7%
- By 2050
- 2,642,388 · +14.9%
- By 2075
- 2,880,769 · +25.2%
- By 2100
- 2,909,436 · +26.5%
Race, ethnicity, and origin ACS 2023
- Neighborhood character
- Predominantly Hispanic (69%)
- Race & ethnicity
- Hispanic / Latino 69% Two or more races 34% Black 15% White 9% Asian 2% Native American 1%
- Hispanic origin (detail)
- Mexican 58%
- Foreign-born
- 18% · Canada
- Languages at home
- 52% English-only · Spanish 46%
Political lean MEDSL · San Bernardino
- 2024 margin
- Toss-up / Even · D 47.5% · R 49.7% · Other 2.8%
- 2008→2024 swing
- -8.5pp toward R · 2008: 6.3pp · 2024: -2.1pp
- All cycles
- 2024: R+2.1 2020: D+10.7 2016: D+9.8 2012: D+5.4 2008: D+6.3
Not yet ingested
- Civics
- —
Market trends
- HPI YoY
- ▲ 41.09%
- Current HPI
- 453.6071
- Rent YoY
- ▲ 4.68%
- Metro
- Riverside-San Bernardino-Ontario, CA
- State GDP YoY
- ▲ 3.21%
- F500 in state
- 116
Industry mix (Fortune 500 HQ in CA)
| Industry | F500 HQs | Revenue |
|---|---|---|
| Technology | 27 | $1,492B |
|
||
| Financial Services | 3 | $174B |
|
||
| Retail | 3 | $44B |
|
||
| Insurance | 3 | $26B |
|
||
| Media / Entertainment | 2 | $115B |
|
||
| Pharmaceuticals / Biotech | 2 | $62B |
|
||
Price history
1 event — show timeline
- 2026-05-26 Listed $96,000 CRMLS
Cash-flow waterfall
monthlySold comps — $/sqft
last 12 mo · ≤1 miLoading sold comps…