4201 Blake Space #41 Rd SW · Albuquerque, NM
Flood risk 1/10 · Minimal
- FEMA flood zone
- X (unshaded)
- Chance of flooding over 30 yrs
- 0.0%
- Est. flood insurance / yr
- $507 – $1,088
Fire risk 2/10 · Minimal
- Est. fire insurance / yr
- $706 – $1,312
Heat risk 5/10 · Moderate
- Hot days now (above 95°F)
- 7 days/yr
- Hot days in 30 yrs
- 19 days/yr
Wind risk 1/10 · Minimal
- Chance of severe wind over 30 yrs
- —
Air-quality risk 2/10 · Minimal
- Unhealthy air days now
- 1 days/yr
- Unhealthy air days in 30 yrs
- 1 days/yr
Risk factors via First Street. Map © Google.
Why this score? — see what drove the B grade
The composite is a weighted blend of 9 inputs, each scored 0–100. Each bar is that input's sub-score; the figure is the points it added to the 100-point composite (weight × sub-score).
- Cash flow +30.0/30.0
- 1% rule +10.0/10.0
- DSCR +10.0/10.0
- ARV discount +7.5/15.0
- Schools +5.3/10.0
- Livability +3.6/5.0
- Condition / age +2.5/5.0
- Rent growth +2.0/5.0
- Appreciation +0.0/10.0
$105,000
🖨 Deal sheet 📄 Offer letter ✓ Due diligence
Listing remarks MLS
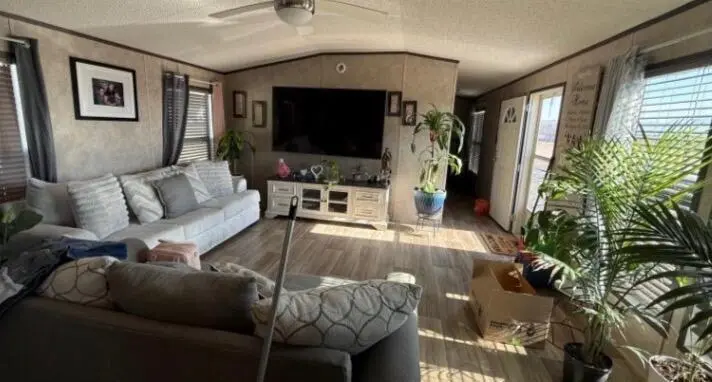
Newly remodeled home newer floors. Fresh paint. Upgraded appliances, Large yard. Two car parking Mobile home can stay on property or moved. Mobile home lot is $600 per month which includes water, sewer and garbage All rooms have mini splits and on cold winter night's you can warm up by the cozy fire place. This mobile home can come furnished or unfurnished. All appliances included.
Key facts
- Built 2024
- Listed 49 days
Property features AI
Finance
- Other: Zoning: R-MC*
- Financial info: Monthly land lease: $585
- HOA & community: Property has a monthly land lease
Exterior
- Utilities: Electricity connected; Natural gas connected; Public water; Public sewer
- Home design: Single-story home; Faces east; Resale property; Mobile home model C-1680-32B (76' x 16')
- Construction: Pitched shingle roof; Built as a mobile home (model C-1680-32B)
- Exterior features: No special exterior features listed
Interior
- Kitchen: Kitchen on main level; Room dimensions approximately 17.4 by 10
- Bedrooms: Primary bedroom on the main level
- Flooring: Carpet; Laminate
- Bathrooms: 2 full bathrooms
- Heating & cooling: Electric heating
- Interior features: Single-pane windows; Main level primary bedroom
- Laundry & utility: Electric dryer hookup
Neighborhood map
What this means for you Summary
Snapshot
- This is a 3-bed/2.0-bath land listed at $105k.
Deal economics
- At list price, monthly cash flow is $757 ($9k/yr) — positive.
- The deal already cash-flows at list — no discount required.
- Meets the 1% rule at list price ($2k rent vs $105k).
- Recommended offer: $102k (3.0% below list) — sets the bar for market timing.
- Cap rate 14.9% vs local median 3.7% in Albuquerque — top-decile yield for the area; either an underpriced asset or a hidden risk that comps aren't pricing in. Stress-test before assuming the spread holds.
Location & tenants
- Location reads 72/100 on livability (#13 in NM) — a middle-class / working-renter tenant base. Strengths: amenities A+, commute A+, cost of living A+; Watch: schools D-, crime F.
- Albuquerque Public Schools (urban): math 51% / reading 75% proficiency, ranked #3 of 29 in NM (top 10%) — acceptable for families but not a draw, mixed tenant base, ~2y average lease; 60% free/reduced lunch — lower-income household profile, screen leases tightly.
- Market conditions: Rents soft (-1.9%/yr); 259 active listings in the ZIP; 7 comparable units currently listed for rent nearby; rentals at typical pace (median 15d on market — plan ~3-4 weeks tenant-placement turnaround); 1,316 units permitted in Bernalillo County in 2024 (546 in 5+ unit buildings).
- This rent runs 37% of the median local income ($61k/yr) — at the standard rent-burdened threshold; future hikes will face affordability resistance.
Forward outlook
- Local home prices are declining (-3.0%/yr); year-one equity from $726 of loan paydown is wiped out by about $3k of value loss. Plan a longer hold.
- At projected returns (-3.0% appreciation + 0.0% rent growth), your $29k cash investment doubles in ~5 years — after that, you're playing with house money.
Negotiation context
- It's been on market 50 days — a 3% lower offer ($102k) is reasonable based on typical stale-listing flexibility.
- 2 sale attempts; this cycle's ask is 162% above the opening price — seller raised mid-cycle; expect resistance to lowballs.
Risks & watch-outs
- Climate carrying-cost: extreme-heat days projected 7→19/yr by 2055 (HVAC capex compounding) — expect insurance premiums to compound above CPI over the hold.
Questions for the listing agent
- It's been on market 50 days. Have you received any prior offers? Is the seller open to a 3% concession, seller financing, or rate buy-down credit?
- Is there a deadline driving the sale (1031 exchange, divorce, estate, relocation)? That informs how much negotiation room exists.
- Schools are D-rated, which usually means shorter tenancies and higher turnover. Who's the typical renter profile here, and what's been the actual vacancy rate?
- Crime grade is F in this area — have there been break-ins, vandalism, or insurance claims at this property in the last 3 years? What carrier currently insures it and at what premium?
- What's the average days-on-market for RENTAL listings here right now (not sales)? A rising rental-DOM trend means longer vacancies and softer asking-rent achievability than the comps imply.
- What's the recent tenant-quality profile in this submarket — average credit score on applications, eviction rate, late-payment / NSF rate, and stable-employment percentage? A property-management company in the area should have these aggregated.
- How much new for-sale + rental construction is in the pipeline within 1–3 miles? Heavy new supply typically softens prices + rents 12–24 months out; constrained supply supports both.
Investment metrics
- 1% rule
- 1.79% ✓
- Cap rate
- 14.95%
- Cash-on-cash
- 30.91%
- DSCR
- 2.38
- GRM
- 4.7
CMA / ARV
- ARV (median comp)
- $243,066
- List price
- $105,000
- Delta
- -56.80%
- Verdict
- UNDERPRICED
- Comps
- 8 within 1.0 mi
Projected returns pro-forma
-3.0% appreciation · 0.0% rent growth · sell at horizon
- IRR
- 22.2%
- Equity multiple
- 1.88×
- Total profit
- $25,748
- Equity at exit
- $15,656
- IRR
- 28.2%
- Equity multiple
- 3.16×
- Total profit
- $63,387
- Equity at exit
- $9,078
Cash invested: $29,400 (down + closing). Projections, not guarantees.
Landlord ↔ Tenant lean methodology
- Overall (STATE)
- 55 Moderately Landlord-Leaning
- State New Mexico
- 55 Moderately Landlord-Leaning · D+3
- County
- — inherits STATE
- City
- — inherits STATE
ZIP-level market 87121
- Home prices YoY
- -19.4%
- Rents YoY
- -1.9%
- Active inventory
- 259
- Price-to-rent
- 4.7×
Monthly cashflow live
- Estimated rent
- $1,877 high interval (Pro) →
- Mortgage (P&I)
- −$551
- Tax est. 1.5%
- −$131 /mo · $1,575/yr
- Insurance
- −$44
- HOA
- −$0
- Vacancy / Maint / Mgmt
- −$394
- Net cashflow
- $757
Break-even live
UW: 25.0% down · 7.5% · 30yr · 1.5% tax · 5.0% vac · 8.0% maint · 8.0% mgmt
Financing live
Cash to close
- Down payment
- $26,250
- Closing costs
- $3,150
- Reserves months
- —
- Total cash needed
- —
Loan-product check · same deal, 3 products live
Conventional
25% down · 7.5% · 30yr
- Down + closing
- —
- Monthly P&I
- —
- Monthly cashflow
- —
- DSCR
- —
- Eligible?
- —
Personal DTI + credit; lowest rate.
DSCR
20% down · 8.5% · 30yr
- Down + closing
- —
- Monthly P&I
- —
- Monthly cashflow
- —
- DSCR
- —
- Eligible?
- —
No personal income docs; deal must DSCR.
Hard money
10% down · 12.0% · 12mo
- Down + closing
- —
- Monthly P&I
- —
- Monthly cashflow
- —
- DSCR
- —
- Eligible?
- —
Short-term bridge; refi at stabilization.
Rent comps 7 comps
| Address | Beds | Baths | Sqft | Rent | $/sqft | DOM | Units | Dist |
|---|---|---|---|---|---|---|---|---|
| 4301 Riley Rd SW Albuquerque, NM | 2.0 | 2.0 | 963 | $1,400 | $1.45 | 3d | 1 | 0.16mi |
| 8401 Winter Sage Rd SW Albuquerque, NM | 3.0 | 2.0 | 1350 | $1,900 | $1.41 | 44d | 1 | 0.51mi |
| 2763 Butch Cassidy Dr SW Albuquerque, NM | 3.0 | 2.0 | 1350 | $2,000 | $1.48 | 14d | 1 | 0.56mi |
| 1604 Corriz Dr SW Albuquerque, NM | 3.0 | 2.0 | 1175 | $1,925 | $1.64 | 44d | 1 | 0.72mi |
| 2300 Diamond Mesa Trl SW Albuquerque, NM | 1.0–4.0 | 1.0–2.5 | 1176 | $2,334 | $1.98 | 3d | 26 | 0.85mi |
| 1312 Quartz Dr SW Albuquerque, NM | 4.0 | 2.0 | 1456 | $2,098 | $1.44 | 14d | 1 | 0.95mi |
| 1327 Ojo Feliz St SW Albuquerque, NM | 2.0 | 1.0 | 924 | $1,695 | $1.83 | 21d | 1 | 1.35mi |
Listing history 15 events
-
2026-06-18days on market $105,000 Active 50 DOM
-
2026-06-17days on market $105,000 Active 49 DOM
-
2026-06-16days on market $105,000 Active 48 DOM
-
2026-06-15days on market $105,000 Active 47 DOM
-
2026-06-13days on market $105,000 Active 45 DOM
-
2026-06-10days on market $105,000 Active 42 DOM
-
2026-06-09days on market $105,000 Active 41 DOM
-
2026-06-08days on market $105,000 Active 40 DOM
-
2026-06-07days on market $105,000 Active 39 DOM
-
2026-06-05days on market $105,000 Active 36 DOM
-
2026-06-03days on market $105,000 Active 35 DOM
-
2026-06-02days on market $105,000 Active 34 DOM
-
2026-06-01days on market $105,000 Active 33 DOM
-
2026-05-31days on market $105,000 Active 32 DOM
-
2026-04-10$105,000 Active 176-char remark
ⓘ Source: listings_history table (triggers on properties + properties_extension) + one-shot
backfill from property_details.listing_events for pre-trigger history.
Climate risk First Street
- Flood 1/10 Low FEMA zone X (unshaded) · 0% chance over 30 yrs
- Wildfire 2/10 Low
- Heat 5/10 Major 7 d/yr ≥95°F today · 19 d/yr by 30 yrs out
- Wind 1/10 Low
- Air quality 2/10 Low 1 unhealthy d/yr today · 1 by 30 yrs out
Nearby sold comps map
Loading sold comps map…
Walkable amenities ~0.75 mi
Loading nearby amenities…
Taxation est. · year 1
- Rental income
- $22,526
- − Mortgage interest
- −$5,882
- − Property taxes
- −$1,575
- − Insurance
- −$525
- − Repairs & maintenance
- −$1,802
- − Management
- −$1,802
- − Depreciation
- −$3,055
- Taxable income
- $7,886
- Est. tax owed @ 24.0%
- −$1,893
- After-tax cash flow
- $7,196/yr
For passive investors: Depreciation is non-cash, so a rental often shows a tax loss while cash-flowing — sheltering income. Rental losses are passive: they offset passive income freely, and up to $25,000/yr can offset ordinary (W-2) income if you actively participate and your MAGI is under $100k (phasing out to $0 by $150k); unused losses carry forward. On sale, claimed depreciation is recaptured at up to 25%, and gains may owe capital-gains tax (a 1031 exchange can defer both). Figures are a year-1 estimate at your 24.0% rate — not tax advice; consult a CPA.
Schools (NCES district)
- District
- Albuquerque Public Schools
- NCES district ID
- 3500060
- Math proficiency
- 51% ▲ 30.00%
- Reading proficiency
- 75% ▲ 45.00%
- Median HH income
- $48,151
- Composite
- 53.29/100
- National rank
- #1487
- State rank
- #3 of 29 in NM
Livability — Albuquerque
- Score
- 72/100
- State rank
- #13
- US rank
- #6219
Category grades
Schools grade is shown separately in the Schools card above.
Census & demographics
- County
- Bernalillo County · 647,165 people
- City population
- 647,165
- Metro
- Albuquerque, NM
- Population (ZIP)
- 75,510
- Household income
- $60,796
- Rent vs Own
- Severe rent burden
- 1617.0
Population outlook (Bernalillo County) Hauer SSP2
- Today (2025)
- 704,528 people
- By 2030
- 711,723 · +1.0%
- By 2040
- 714,522 · +1.4%
- By 2050
- 709,274 · +0.7%
- By 2075
- 680,015 · -3.5%
- By 2100
- 619,879 · -12.0%
Race, ethnicity, and origin ACS 2023
- Neighborhood character
- Predominantly Hispanic (82%)
- Race & ethnicity
- Hispanic / Latino 82% Two or more races 32% White 9% Native American 4% Black 2% Asian 1%
- Hispanic origin (detail)
- Mexican 60%
- Common ancestry
- Italian 1% Lithuanian 1%
- Foreign-born
- 18% · Canada
- Languages at home
- 53% English-only · Spanish 44% Tagalog/Filipino 1%
Political lean MEDSL · Bernalillo
- 2024 margin
- Strong D (+21.0) · D 59.2% · R 38.2% · Other 2.6%
- 2008→2024 swing
- -0.3pp no change · 2008: 21.4pp · 2024: 21.0pp
- All cycles
- 2024: D+21.0 2020: D+24.4 2016: D+17.8 2012: D+16.2 2008: D+21.4
Not yet ingested
- Civics
- —
Market trends
- HPI YoY
- ▼ -62.80%
- Current HPI
- 261.8123
- Rent YoY
- ▼ -1.86%
- Metro
- Albuquerque, NM
- State GDP YoY
- —
- F500 in state
- 0
Price history
-61.9% since first listed2 events — show timeline
- 2026-05-24 Listed $40,000 FSBO.com
- 2026-04-10 Listed $105,000 Southwest MLS
Property tax history
+3.9%/yrLatest (2025): $11,844 · +1.7% YoY. Source: county tax records.
Cash-flow waterfall
monthlySold comps — $/sqft
last 12 mo · ≤1 miLoading sold comps…