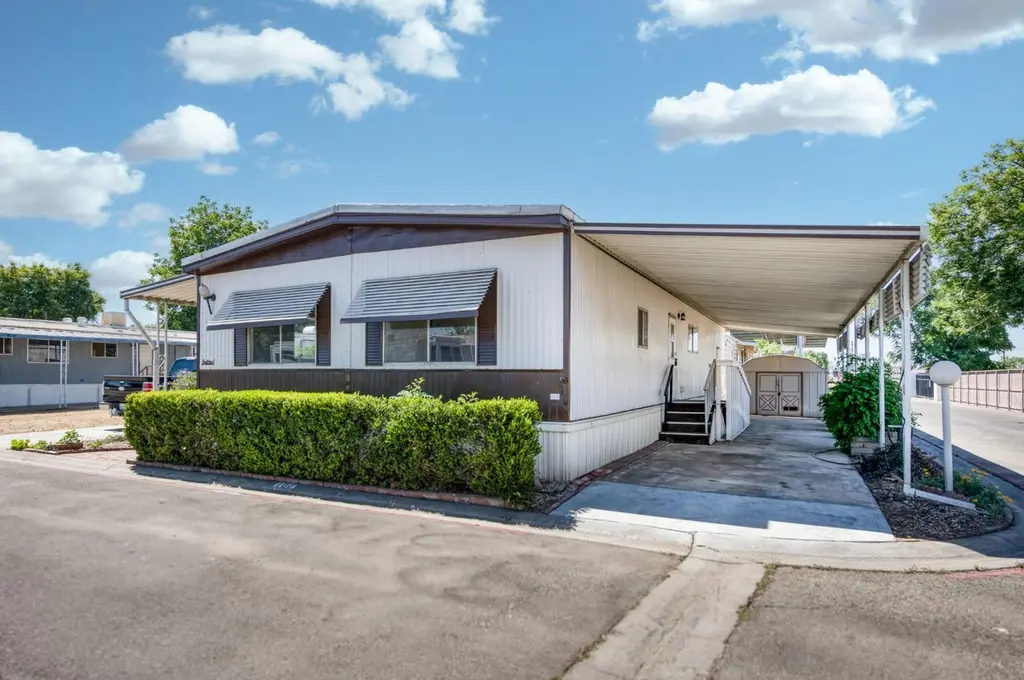
3138 W Dakota Ave Unit SP107 · Fresno, CA
Flood risk 1/10 · Minimal
- FEMA flood zone
- X (unshaded)
- Chance of flooding over 30 yrs
- 0.0%
- Est. flood insurance / yr
- $507 – $1,088
Fire risk 1/10 · Minimal
- Est. fire insurance / yr
- $659 – $1,223
Heat risk 8/10 · Major
- Hot days now (above 105°F)
- 7 days/yr
- Hot days in 30 yrs
- 17 days/yr
Wind risk 1/10 · Minimal
- Chance of severe wind over 30 yrs
- —
Air-quality risk 10/10 · Severe
- Unhealthy air days now
- 48 days/yr
- Unhealthy air days in 30 yrs
- 50 days/yr
Risk factors via First Street. Map © Google.
Why this score? — see what drove the C+ grade
The composite is a weighted blend of 9 inputs, each scored 0–100. Each bar is that input's sub-score; the figure is the points it added to the 100-point composite (weight × sub-score).
- Cash flow +30.0/30.0
- 1% rule +10.0/10.0
- DSCR +10.0/10.0
- Condition / age +4.0/5.0
- Rent growth +3.5/5.0
- Livability +3.1/5.0
- Schools +2.7/10.0
- ARV discount +0.0/15.0
- Appreciation +0.0/10.0
$118,250
🖨 Deal sheet 📄 Offer letter ✓ Due diligence
Listing remarks
Experience comfortable living in this beautifully updated 3-bedroom, 2-bathroom manufactured home, ideally located in the Four Seasons Mobile Home Park. This residence has been thoughtfully refreshed with new paint, modern laminate flooring, and updated countertops, creating a bright and inviting atmosphere. The functional layout includes a gas stove, breakfast bar, formal dining room, indoor laundry, and a spacious living area perfect for family gatherings and relaxation. Beyond your doorstep, Four Seasons offers an array of desirable amenities, from a refreshing pool and playground to basketball courts. Enjoy the ultimate convenience with proximity to Vallarta Supermarket, Freeway 99, and
Key facts
- Formal dining room
- Spacious living area
- Gas stove
Tags
Property features AI
Finance
- HOA & community: Community pool; Playground; Gated community; Monthly association fee
Exterior
- Parking: Carport; Has carport
- Utilities: Electric service on; Public sewer; Public utilities
- Home design: Manufactured home; Mobile home
- Construction: Vinyl siding; Other construction materials; Fiberglass roof; Wood subfloor foundation
- Exterior features: One level; Private in-ground pool (fenced; community); Urban setting; Park space rented
Interior
- Kitchen: Built-in range/oven; Refrigerator; Disposal
- Flooring: Carpet; Laminate; Vinyl
- Bathrooms: 2 bathrooms; Tub/shower
- Heating & cooling: Floor or wall heating units; Evaporative cooling
- Interior features: Disposal; Refrigerator; Gas and electric appliances; Built-in range/oven
- Laundry & utility: Inside laundry
Neighborhood map
What this means for you Summary
Snapshot
- This is a 3-bed/2.0-bath manufactured listed at $118k. Condition is rated good.
Deal economics
- At list price, monthly cash flow is $790 ($9k/yr) — positive.
- The deal already cash-flows at list — no discount required.
- Meets the 1% rule at list price ($2k rent vs $118k).
- Cap rate 14.3% vs local median 3.7% in Fresno — top-decile yield for the area; either an underpriced asset or a hidden risk that comps aren't pricing in. Stress-test before assuming the spread holds.
Location & tenants
- Location reads 62/100 on livability (#469 in CA) — a middle-class / working-renter tenant base. Strengths: commute A+, housing A+; Watch: amenities D+, employment D+, crime F.
- Fresno Unified (urban): math 18% / reading 47% proficiency, ranked #327 of 517 in CA (top 63%) — families likely to look elsewhere, expect single-tenant / working-renter base with shorter leases; 77% free/reduced lunch — lower-income household profile, screen leases tightly.
- Zoned schools: Wishon Elementary (513 students, 93% FRL); Fort Miller Middle (623 students, 98% FRL); Fresno High (math 10% / reading 38%, grade F, #934 of 1,170 statewide, top 80%, 2,092 students, 90% FRL) — zoned schools average 94% FRL vs 77% district-wide (17 pts higher); higher-poverty schools than district average — tighter screening recommended.
- Market conditions: Rents rising (+3.8%/yr); 191 active listings in the ZIP; 20 comparable units currently listed for rent nearby; rentals at typical pace (median 21d on market — plan ~3-4 weeks tenant-placement turnaround); solid renter incomes; 2,426 units permitted in Fresno County in 2024 (296 in 5+ unit buildings).
- This rent runs 30% of the median local income ($80k/yr) — at the standard rent-burdened threshold; future hikes will face affordability resistance.
Forward outlook
- Local home prices are declining (-3.0%/yr); year-one equity from $818 of loan paydown is wiped out by about $4k of value loss. Plan a longer hold.
- Fresno County population projected at +11% by 2050 — modest demand growth; plan on rents tracking national, not racing it.
- At projected returns (-3.0% appreciation + 3.8% rent growth), your $33k cash investment doubles in ~5 years — after that, you're playing with house money.
Negotiation context
- Only 12 days on market — expect competitive offers; lowballing is unlikely to land.
Risks & watch-outs
- Climate carrying-cost: extreme-heat days projected 7→17/yr by 2055 (HVAC capex compounding) — expect insurance premiums to compound above CPI over the hold.
Questions for the listing agent
- Built in 1972 — when were the roof, HVAC, electrical panel, plumbing, and water heater last replaced?
- Is there a deadline driving the sale (1031 exchange, divorce, estate, relocation)? That informs how much negotiation room exists.
- Schools are D-rated, which usually means shorter tenancies and higher turnover. Who's the typical renter profile here, and what's been the actual vacancy rate?
- Crime grade is F in this area — have there been break-ins, vandalism, or insurance claims at this property in the last 3 years? What carrier currently insures it and at what premium?
- What's the average days-on-market for RENTAL listings here right now (not sales)? A rising rental-DOM trend means longer vacancies and softer asking-rent achievability than the comps imply.
- What's the recent tenant-quality profile in this submarket — average credit score on applications, eviction rate, late-payment / NSF rate, and stable-employment percentage? A property-management company in the area should have these aggregated.
- How much new for-sale + rental construction is in the pipeline within 1–3 miles? Heavy new supply typically softens prices + rents 12–24 months out; constrained supply supports both.
Investment metrics
- 1% rule
- 1.72% ✓
- Cap rate
- 14.31%
- Cash-on-cash
- 28.63%
- DSCR
- 2.27
- GRM
- 4.8
CMA / ARV
- ARV (on-the-fly)
- $98,208
- Comps found
- 12
Show comp detail 12 sales within ~0.75 mi
| Address | Dist | Beds/Ba | Sqft | Sold | Price | $/sf | Match |
|---|---|---|---|---|---|---|---|
| 3138 W Dakota Ave #210 | 0.08mi | 3/2.0 | 1,344 (-10%) | 4mo | $42,500 | $32 | 77 |
| 2706 W Ashlan Ave #156 | 0.66mi | 3/2.0 | 1,440 (-3%) | 0mo | $127,500 | $89 | 64 |
| 2706 W Ashlan Ave #200 | 0.58mi | 3/2.0 | 1,440 (-3%) | 7mo | $53,500 | $37 | 62 |
| 2706 W Ashlan Ave #158 | 0.66mi | 2/2.0 (-1) | 1,488 (0%) | 6mo | $80,000 | $54 | 59 |
| 2706 W Ashlan Ave #86 | 0.66mi | 2/2.0 (-1) | 1,440 (-3%) | 4mo | $50,000 | $35 | 56 |
| 2706 W Ashlan Ave #11 | 0.61mi | 2/2.0 (-1) | 1,440 (-3%) | 7mo | $98,000 | $68 | 56 |
| 2706 W Ashlan Ave #144 | 0.74mi | 2/2.0 (-1) | 1,440 (-3%) | 0mo | $136,000 | $94 | 55 |
| 2706 W Ashlan Ave #46 | 0.74mi | 2/2.0 (-1) | 1,440 (-3%) | 1mo | $89,000 | $62 | 54 |
| 2706 W Ashlan Ave #266 | 0.74mi | 2/2.0 (-1) | 1,440 (-3%) | 2mo | $124,900 | $87 | 53 |
| 2706 W Ashlan Ave #175 | 0.74mi | 2/2.0 (-1) | 1,436 (-4%) | 3mo | $94,900 | $66 | 52 |
| 2706 W Ashlan Ave #281 | 0.74mi | 2/2.0 (-1) | 1,344 (-10%) | 1mo | $89,000 | $66 | 44 |
| 2706 W Ashlan Ave #299 | 0.73mi | 2/2.0 (-1) | 1,310 (-12%) | 1mo | $165,000 | $126 | 40 |
Match score weights: distance 35% · size 25% · config 20% · recency 20%. Top-matched comps best support the ARV.
Projected returns pro-forma
-3.0% appreciation · 3.82% rent growth · sell at horizon
- IRR
- 23.9%
- Equity multiple
- 1.99×
- Total profit
- $32,874
- Equity at exit
- $17,631
- IRR
- 32.3%
- Equity multiple
- 4.04×
- Total profit
- $100,596
- Equity at exit
- $10,224
Cash invested: $33,110 (down + closing). Projections, not guarantees.
Landlord ↔ Tenant lean methodology
- Overall (STATE)
- 18 Strongly Tenant-Friendly
- State California
- 18 Strongly Tenant-Friendly · D+13
- County
- — inherits STATE
- City
- — inherits STATE
ZIP-level market 93722
- Rents YoY
- 3.8%
- Active inventory
- 191
- Price-to-rent
- 4.8×
Monthly cashflow live
- Estimated rent
- $2,034 high interval (Pro) →
- Mortgage (P&I)
- −$620
- Tax est. 1.5%
- −$148 /mo · $1,774/yr
- Insurance
- −$49
- HOA
- −$0
- Vacancy / Maint / Mgmt
- −$427
- Net cashflow
- $790
Break-even live
UW: 25.0% down · 7.5% · 30yr · 1.5% tax · 5.0% vac · 8.0% maint · 8.0% mgmt
Financing live
Cash to close
- Down payment
- $29,562
- Closing costs
- $3,548
- Reserves months
- —
- Total cash needed
- —
Loan-product check · same deal, 3 products live
Conventional
25% down · 7.5% · 30yr
- Down + closing
- —
- Monthly P&I
- —
- Monthly cashflow
- —
- DSCR
- —
- Eligible?
- —
Personal DTI + credit; lowest rate.
DSCR
20% down · 8.5% · 30yr
- Down + closing
- —
- Monthly P&I
- —
- Monthly cashflow
- —
- DSCR
- —
- Eligible?
- —
No personal income docs; deal must DSCR.
Hard money
10% down · 12.0% · 12mo
- Down + closing
- —
- Monthly P&I
- —
- Monthly cashflow
- —
- DSCR
- —
- Eligible?
- —
Short-term bridge; refi at stabilization.
Rent comps 20 comps
| Address | Beds | Baths | Sqft | Rent | $/sqft | DOM | Units | Dist |
|---|---|---|---|---|---|---|---|---|
| 3818 N Cheryl Ave Fresno, CA | 4.0 | 3.0 | 1649 | $2,500 | $1.52 | 23d | 1 | 0.35mi |
| 3274 W Ashlan Ave Fresno, CA | 2.0 | 1.0 | 975 | $1,535 | $1.57 | 2d | 5 | 0.51mi |
| 4144 N Valentine Ave Fresno, CA | 2.0 | 1.0 | 960 | $1,450 | $1.51 | 16d | 1 | 0.60mi |
| 4144 N Valentine Ave Unit 60-147 Fresno, CA | 2.0 | 1.0 | 960 | $1,695 | $1.77 | 19d | 1 | 0.60mi |
| 4144 N Valentine Ave Unit 84-118 Fresno, CA | 2.0 | 1.0 | 960 | $1,695 | $1.77 | 43d | 1 | 0.60mi |
| 4144 N Valentine Ave Unit 60-158 Fresno, CA | 2.0 | 1.0 | 960 | $1,695 | $1.77 | 23d | 1 | 0.60mi |
| 4184 N Briarwood Ave Fresno, CA | 3.0 | 2.0 | 1628 | $2,195 | $1.35 | 43d | 1 | 0.62mi |
| 3207 W Shields Ave Fresno, CA | 1.0–3.0 | 1.0–2.0 | 959 | $1,725 | $1.80 | 1d | 3 | 0.66mi |
| 3058 W San Gabriel Ave Fresno, CA | 3.0 | 2.0 | 1284 | $2,450 | $1.91 | 43d | 1 | 1.10mi |
| 4597 N Emerson Ave Apt 103 Fresno, CA | 2.0 | 2.0 | 1100 | $1,700 | $1.55 | 23d | 1 | 1.10mi |
| 1668 W Ashlan Ave Fresno, CA | 2.0 | 1.0 | 877 | $1,185 | $1.35 | 23d | 1 | 1.13mi |
| 4264 N Bengston Ave Unit 101 Fresno, CA | 2.0 | 1.0 | 950 | $1,450 | $1.53 | 43d | 1 | 1.16mi |
| 3572 N Blythe Ave Fresno, CA | 3.0 | 2.0 | 1026 | $2,095 | $2.04 | 1d | 6 | 1.23mi |
| 2264 N Marks Ave Fresno, CA | 2.0–3.0 | 1.0–2.0 | 950 | $1,600 | $1.68 | 1d | 1 | 1.35mi |
| 3326 N West Ave Fresno, CA | 2.0 | 1.0 | 950 | $1,225 | $1.29 | 21d | 1 | 1.36mi |
| 1212 W Andrews Ave Fresno, CA | 2.0 | 1.0 | 950 | $1,300 | $1.37 | 16d | 1 | 1.40mi |
| 4942 N Holt Ave #103 Fresno, CA | 2.0 | 1.0 | 1000 | $1,395 | $1.40 | 23d | 1 | 1.41mi |
| 941 W Dakota Ave Fresno, CA | 3.0 | 2.0 | 960 | $1,895 | $1.97 | 10d | 2 | 1.45mi |
| 6338 N Cecelia Ave Fresno, CA | 2.0 | 2.0 | 1130 | $2,050 | $1.81 | 1d | 1 | 1.49mi |
| 4467 N Van Dyke Ave Fresno, CA | 3.0 | 2.0 | 1292 | $2,195 | $1.70 | 3d | 1 | 1.50mi |
Listing history 10 events
-
2026-06-18days on market $118,250 Active 12 DOM
-
2026-06-17days on market $118,250 Active 11 DOM
-
2026-06-16days on market $118,250 Active 10 DOM
-
2026-06-15days on market $118,250 Active 9 DOM
-
2026-06-13days on market $118,250 Active 7 DOM
-
2026-06-10days on market $118,250 Active 4 DOM
-
2026-06-09days on market $118,250 Active 3 DOM
-
2026-06-08days on market $118,250 Active 2 DOM
-
2026-06-07remarks 699-char remark
-
2026-06-07$118,250 Active 1 DOM
ⓘ Source: listings_history table (triggers on properties + properties_extension) + one-shot
backfill from property_details.listing_events for pre-trigger history.
Climate risk First Street
- Flood 1/10 Low FEMA zone X (unshaded) · 0% chance over 30 yrs
- Wildfire 1/10 Low
- Heat 8/10 Severe 7 d/yr ≥105°F today · 17 d/yr by 30 yrs out
- Wind 1/10 Low
- Air quality 10/10 Extreme 48 unhealthy d/yr today · 50 by 30 yrs out
Nearby sold comps map
Loading sold comps map…
Walkable amenities ~0.75 mi
Loading nearby amenities…
Taxation est. · year 1
- Rental income
- $24,412
- − Mortgage interest
- −$6,624
- − Property taxes
- −$1,774
- − Insurance
- −$591
- − Repairs & maintenance
- −$1,953
- − Management
- −$1,953
- − Depreciation
- −$3,440
- Taxable income
- $8,078
- Est. tax owed @ 24.0%
- −$1,939
- After-tax cash flow
- $7,541/yr
For passive investors: Depreciation is non-cash, so a rental often shows a tax loss while cash-flowing — sheltering income. Rental losses are passive: they offset passive income freely, and up to $25,000/yr can offset ordinary (W-2) income if you actively participate and your MAGI is under $100k (phasing out to $0 by $150k); unused losses carry forward. On sale, claimed depreciation is recaptured at up to 25%, and gains may owe capital-gains tax (a 1031 exchange can defer both). Figures are a year-1 estimate at your 24.0% rate — not tax advice; consult a CPA.
Condition & rehab AI · 14 photos
This well-maintained and updated manufactured home is in good condition and ready for immediate occupancy. It offers a good return on investment with minimal repairs and maintenance required.
Value-add opportunities
- Resale Painting the exterior and interior walls — Fresh paint can enhance the home's curb appeal and make it more attractive to potential buyers.
- Resale Updating the flooring — New flooring can improve the home's appearance and make it more appealing to potential buyers.
- Resale Upgrading the kitchen appliances — Modern appliances can make the home more attractive to potential buyers and increase its value.
- Resale Upgrading the bathroom fixtures — Modern bathroom fixtures can make the home more attractive to potential buyers and increase its value.
Renovation cost estimate screening
Value-add ROI direction
- Resale Painting the exterior and interior walls — Fresh paint can enhance the home's curb appeal and make it more attractive to potential buyers. ↑
- Resale Updating the flooring — New flooring can improve the home's appearance and make it more appealing to potential buyers. ↑
- Resale Upgrading the kitchen appliances — Modern appliances can make the home more attractive to potential buyers and increase its value. ↑
- Resale Upgrading the bathroom fixtures — Modern bathroom fixtures can make the home more attractive to potential buyers and increase its value. ↑
ⓘ Cost ranges are severity-bucket heuristics (US national rule-of-thumb). Get contractor quotes + a written scope before underwriting a rehab budget.
Schools (NCES district)
- District
- Fresno Unified
- NCES district ID
- 0614550
- Math proficiency
- 18% ▼ -12.00%
- Reading proficiency
- 47% ▲ 9.00%
- Median HH income
- $36,095
- Composite
- 26.83/100
- National rank
- #7111
- State rank
- #327 of 517 in CA
Livability — Fresno
- Score
- 62/100
- State rank
- #469
- US rank
- #15907
Category grades
Schools grade is shown separately in the Schools card above.
Census & demographics
- Census place
- Fresno, CA
- County
- Fresno County · 834,801 people
- City population
- 593,114
- Metro
- Fresno, CA
- Population (ZIP)
- 86,110
- Household income
- $80,285
- Rent vs Own
- Severe rent burden
- 3033.0
Population outlook (Fresno County) Hauer SSP2
- Today (2025)
- 1,042,971 people
- By 2030
- 1,072,198 · +2.8%
- By 2040
- 1,122,408 · +7.6%
- By 2050
- 1,157,251 · +11.0%
- By 2075
- 1,182,575 · +13.4%
- By 2100
- 1,105,899 · +6.0%
Race, ethnicity, and origin ACS 2023
- Neighborhood character
- Diverse neighborhood (Simpson 0.68)
- Race & ethnicity
- Hispanic / Latino 50% Two or more races 26% White 22% Asian 15% Black 9% Native American 1%
- Hispanic origin (detail)
- Mexican 46%
- Common ancestry
- Russian 1% Lithuanian 1% Slovak 1%
- Foreign-born
- 20% · Canada, Vietnam
- Languages at home
- 57% English-only · Spanish 28% Other Indo-European 8% Other Asian/Pacific 3%
Political lean MEDSL · Fresno
- 2024 margin
- Toss-up / Even · D 46.5% · R 50.9% · Other 2.6%
- 2008→2024 swing
- -6.5pp toward R · 2008: 2.1pp · 2024: -4.4pp
- All cycles
- 2024: R+4.4 2020: D+7.8 2016: D+3.9 2012: R+2.9 2008: D+2.1
Not yet ingested
- Civics
- —
Market trends
- HPI YoY
- ▼ -409.00%
- Current HPI
- 364.934
- Rent YoY
- ▲ 3.82%
- Metro
- Fresno, CA
- State GDP YoY
- ▲ 3.21%
- F500 in state
- 116
Industry mix (Fortune 500 HQ in CA)
| Industry | F500 HQs | Revenue |
|---|---|---|
| Technology | 27 | $1,492B |
|
||
| Financial Services | 3 | $174B |
|
||
| Retail | 3 | $44B |
|
||
| Insurance | 3 | $26B |
|
||
| Media / Entertainment | 2 | $115B |
|
||
| Pharmaceuticals / Biotech | 2 | $62B |
|
||
Price history
1 event — show timeline
- 2026-06-06 Listed $118,250 FRESNOMLS
Cash-flow waterfall
monthlySold comps — $/sqft
last 12 mo · ≤1 miLoading sold comps…