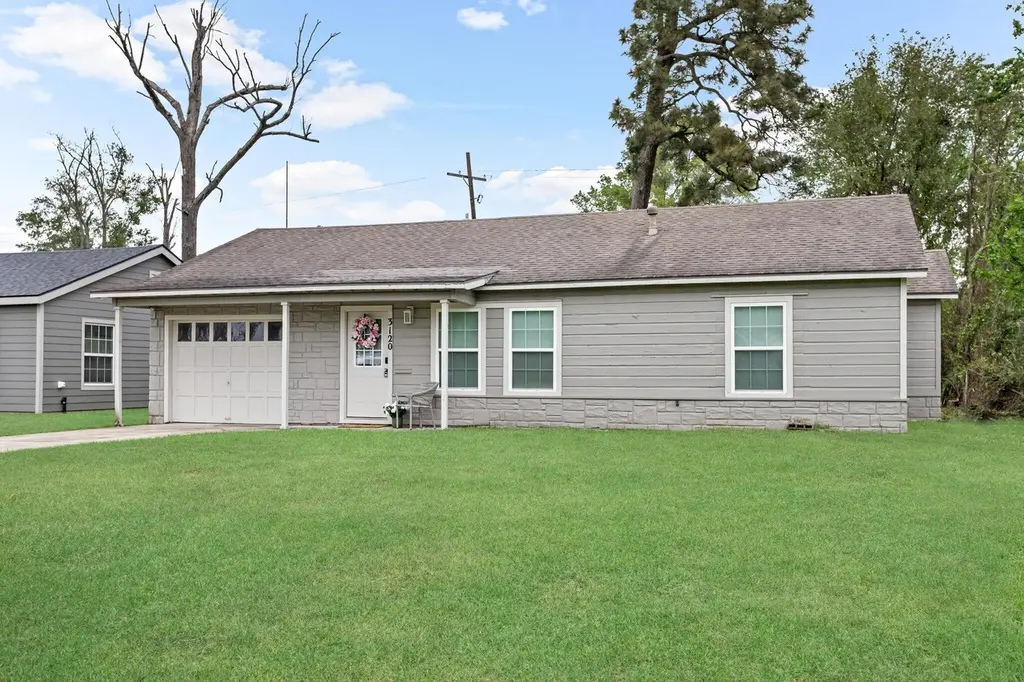
3120 Timberwood Ln · Beaumont, TX
Flood risk 6/10 · Moderate
- FEMA flood zone
- X
- Chance of flooding over 30 yrs
- 0.69%
- Est. flood insurance / yr
- $507 – $1,088
Fire risk 1/10 · Minimal
- Est. fire insurance / yr
- $1,222 – $2,270
Heat risk 9/10 · Severe
- Hot days now (above 109°F)
- 7 days/yr
- Hot days in 30 yrs
- 24 days/yr
Wind risk 9/10 · Severe
- Chance of severe wind over 30 yrs
- 99.0%
Air-quality risk 2/10 · Minimal
- Unhealthy air days now
- 1 days/yr
- Unhealthy air days in 30 yrs
- 1 days/yr
Risk factors via First Street. Map © Google.
Why this score? — see what drove the F grade
The composite is a weighted blend of 9 inputs, each scored 0–100. Each bar is that input's sub-score; the figure is the points it added to the 100-point composite (weight × sub-score).
- Cash flow +7.7/30.0
- Appreciation +7.7/10.0
- Livability +3.2/5.0
- Rent growth +2.5/5.0
- Condition / age +2.5/5.0
- 1% rule +2.2/10.0
- DSCR +1.8/10.0
- Schools +1.5/10.0
- ARV discount +0.0/15.0
$144,690
🖨 Deal sheet 📄 Offer letter ✓ Due diligence
Listing remarks
Phenomenal home with a cool vibe in Minglewood Addition. Beautiful restored hardwood floors add warmth to this quaint home. It is a great choice for a family seeking a starter home or for empty nesters. Extensive remodeling to prepare it for use as a short-term rental. It is staged and ready to view. Very close to all the medical facilities in Beaumont, TX and easy access to IH 10 or Hwy 69. Central AC and central gas heat for year around comfort. Call for a tour today.
Key facts
- Central ac
- Easy access to ih 10
- Extensive remodeling
Tags
Neighborhood map
What this means for you Summary
Snapshot
- This is a 2-bed/1.0-bath single-family listed at $145k.
Deal economics
- At list price, monthly cash flow is $-165 ($-2k/yr) — negative.
- To cash-flow at today's rent, offer at most $116k (20.1% below list).
- To meet the 1% rule (rent ≥ 1% of price), the offer needs to be $105k (27.6% below list).
- Recommended offer: $105k (27.6% below list) — sets the bar for 1% rule.
Location & tenants
- Location reads 64/100 on livability (#739 in TX) — a middle-class / working-renter tenant base. Strengths: cost of living A+, housing A+, health & safety A+; Watch: employment D, schools D-, crime F.
- Beaumont ISD (urban): math 14% / reading 22% proficiency, ranked #789 of 826 in TX (top 96%) — low school quality limits family demand, transient renter base, plan for 1-2y turnover; 69% free/reduced lunch — lower-income household profile, screen leases tightly.
- Market conditions: 79 active listings in the ZIP; 25 comparable units currently listed for rent nearby; rentals at typical pace (median 23d on market — plan ~3-4 weeks tenant-placement turnaround); 40% of comp listings sitting > 30 days — soft ceiling on asking rent; lower-income renter base — watch delinquency; 343 units permitted in Jefferson County in 2024 (0 in 5+ unit buildings).
- This rent runs 40% of the median local income ($32k/yr) — at the standard rent-burdened threshold; future hikes will face affordability resistance.
Forward outlook
- In year one you build about $9k of equity ($1k loan paydown + $8k appreciation (5.4% local appreciation)).
- By year 4, paydown + projected appreciation supports a ~$30k cash-out refi (75% LTV) — recoverable capital for the next deal without selling this one.
Negotiation context
- Only 12 days on market — expect competitive offers; lowballing is unlikely to land.
- 2 sale attempts since 2y ago with the ask held roughly flat each time — persistent listings suggest the price (not the market) is what's stuck; bring a comps-based counter.
Risks & watch-outs
- Climate carrying-cost: major flood risk; severe wind risk, 99% chance of damaging wind over 30y; extreme-heat days projected 7→24/yr by 2055 (HVAC capex compounding) — expect insurance premiums to compound above CPI over the hold.
Questions for the listing agent
- What do current leases actually rent for vs. the listed asking? Can we see a recent rent roll and the last 12 months of T-12 income?
- Built in 1962 — when were the roof, HVAC, electrical panel, plumbing, and water heater last replaced?
- Is there a deadline driving the sale (1031 exchange, divorce, estate, relocation)? That informs how much negotiation room exists.
- Schools are D-rated, which usually means shorter tenancies and higher turnover. Who's the typical renter profile here, and what's been the actual vacancy rate?
- Crime grade is F in this area — have there been break-ins, vandalism, or insurance claims at this property in the last 3 years? What carrier currently insures it and at what premium?
- The area grade is low — what's the realistic commute time and amenity access for the typical tenant pool here? Any planned neighborhood developments (good or bad) we should know about?
- What's the average days-on-market for RENTAL listings here right now (not sales)? A rising rental-DOM trend means longer vacancies and softer asking-rent achievability than the comps imply.
- What's the recent tenant-quality profile in this submarket — average credit score on applications, eviction rate, late-payment / NSF rate, and stable-employment percentage? A property-management company in the area should have these aggregated.
- How much new for-sale + rental construction is in the pipeline within 1–3 miles? Heavy new supply typically softens prices + rents 12–24 months out; constrained supply supports both.
Investment metrics
- 1% rule
- 0.72% ✗
- Cap rate
- 4.93%
- Cash-on-cash
- -4.88%
- DSCR
- 0.78
- GRM
- 11.5
CMA / ARV
- ARV (on-the-fly)
- $108,130
- Comps found
- 3
Show comp detail 3 sales within ~0.75 mi
| Address | Dist | Beds/Ba | Sqft | Sold | Price | $/sf | Match |
|---|---|---|---|---|---|---|---|
| 3630 Steelton St | 0.38mi | 2/1.0 | 856 (-13%) | 3mo | $115,000 | $134 | 58 |
| 3975 Steelton St | 0.54mi | 3/1.0 (+1) | 908 (-8%) | 14mo | $99,900 | $110 | 45 |
| 4045 Dallas Ave | 0.51mi | 3/1.0 (+1) | 1,083 (+10%) | 16mo | $49,999 | $46 | 41 |
Match score weights: distance 35% · size 25% · config 20% · recency 20%. Top-matched comps best support the ARV.
Projected returns pro-forma
5.43% appreciation · 3.0% rent growth · sell at horizon
- IRR
- 9.9%
- Equity multiple
- 1.65×
- Total profit
- $26,486
- Equity at exit
- $85,846
- IRR
- 11.3%
- Equity multiple
- 3.16×
- Total profit
- $87,586
- Equity at exit
- $151,445
Cash invested: $40,513 (down + closing). Projections, not guarantees.
Landlord ↔ Tenant lean methodology
- Overall (STATE)
- 87 Strongly Landlord-Friendly
- State Texas
- 87 Strongly Landlord-Friendly · R+5
- County
- — inherits STATE
- City
- — inherits STATE
ZIP-level market 77703
- Home prices YoY
- 3.7%
- Active inventory
- 79
- Price-to-rent
- 11.5×
Monthly cashflow live
- Estimated rent
- $1,048 high interval (Pro) →
- Mortgage (P&I)
- −$759
- Tax from tax record
- −$174 /mo · $2,082/yr
- Insurance
- −$60
- HOA
- −$0
- Vacancy / Maint / Mgmt
- −$220
- Net cashflow
- $-165
Break-even live
UW: 25.0% down · 7.5% · 30yr · 1.5% tax · 5.0% vac · 8.0% maint · 8.0% mgmt
Financing live
Cash to close
- Down payment
- $36,172
- Closing costs
- $4,341
- Reserves months
- —
- Total cash needed
- —
Loan-product check · same deal, 3 products live
Conventional
25% down · 7.5% · 30yr
- Down + closing
- —
- Monthly P&I
- —
- Monthly cashflow
- —
- DSCR
- —
- Eligible?
- —
Personal DTI + credit; lowest rate.
DSCR
20% down · 8.5% · 30yr
- Down + closing
- —
- Monthly P&I
- —
- Monthly cashflow
- —
- DSCR
- —
- Eligible?
- —
No personal income docs; deal must DSCR.
Hard money
10% down · 12.0% · 12mo
- Down + closing
- —
- Monthly P&I
- —
- Monthly cashflow
- —
- DSCR
- —
- Eligible?
- —
Short-term bridge; refi at stabilization.
Rent comps 25 comps
| Address | Beds | Baths | Sqft | Rent | $/sqft | DOM | Units | Dist |
|---|---|---|---|---|---|---|---|---|
| 2575 Primrose St Unit 3 Beaumont, TX | 2.0 | 1.0 | 800 | $900 | $1.12 | 23d | 1 | 0.36mi |
| 3155 French Rd Beaumont, TX | 1.0–3.0 | 1.0–2.0 | 905 | $917 | $1.01 | 13d | 9 | 0.67mi |
| 2450 N Lynwood Dr Beaumont, TX | 3.0 | 1.0 | 1015 | $1,175 | $1.16 | 23d | 1 | 0.69mi |
| 2125 Earl St Beaumont, TX | 2.0 | 1.0 | 785 | $995 | $1.27 | 43d | 1 | 0.73mi |
| 2125 Earl St Beaumont, TX | 2.0 | 1.0 | 785 | $900 | $1.15 | 23d | 1 | 0.73mi |
| 2555 Pierce St Unit Rear Down Beaumont, TX | 1.0 | 1.0 | 650 | $795 | $1.22 | 43d | 1 | 0.75mi |
| 2550 Pierce St Beaumont, TX | 2.0 | 1.0 | 1044 | $1,050 | $1.01 | 43d | 1 | 0.77mi |
| 2530 Pierce St Beaumont, TX | 2.0 | 1.0 | 950 | $1,000 | $1.05 | 43d | 1 | 0.78mi |
| 2270 Johnson St Beaumont, TX | 2.0 | 1.0 | 700 | $800 | $1.14 | 23d | 1 | 0.84mi |
| 2570 Sweetgum Ln Beaumont, TX | 1.0–2.0 | 1.0–1.5 | 876 | $1,599 | $1.82 | 13d | 15 | 0.85mi |
| 4565 Detroit St Beaumont, TX | 2.0 | 1.0 | 880 | $995 | $1.13 | 44d | 1 | 0.87mi |
| 4110 Arthur Ln Apt 24 Beaumont, TX | 1.0 | 1.0 | 676 | $725 | $1.07 | 43d | 1 | 0.90mi |
| 2420 Wilson St Beaumont, TX | 2.0 | 1.0 | 840 | $1,200 | $1.43 | 43d | 1 | 0.93mi |
| 2020 Cottonwood St Beaumont, TX | 2.0–4.0 | 1.0 | 928 | $1,123 | $1.21 | 13d | 9 | 0.98mi |
| 1215 Longfellow Dr Beaumont, TX | 1.0–2.0 | 1.0–2.0 | 834 | $1,545 | $1.85 | 13d | 15 | 1.15mi |
| 5070 Wilshire St Beaumont, TX | 2.0 | 1.0 | 1042 | $1,295 | $1.24 | 13d | 1 | 1.19mi |
| 5080 Helbig Rd Beaumont, TX | 2.0–3.0 | 1.0 | 775 | $450 | $0.58 | 13d | 1 | 1.21mi |
| 4162 Treadway Rd Beaumont, TX | 1.0 | 1.0 | 722 | $975 | $1.35 | 23d | 1 | 1.22mi |
| 4162 Treadway Rd #12 Beaumont, TX | 1.0 | 1.0 | 722 | $950 | $1.32 | 23d | 1 | 1.22mi |
| 4162 Treadway Rd Beaumont, TX | 1.0 | 1.0 | 722 | $975 | $1.35 | 43d | 1 | 1.22mi |
| 3910 Treadway Rd Beaumont, TX | 2.0–3.0 | 1.0–1.5 | 1019 | $1,349 | $1.32 | 13d | 10 | 1.25mi |
| 4164 Treadway Rd #1 Beaumont, TX | 1.0 | 1.0 | 722 | $975 | $1.35 | 43d | 1 | 1.27mi |
| 1160 N 7th St Beaumont, TX | 1.0 | 1.0 | 700 | $600 | $0.86 | 13d | 1 | 1.41mi |
| 4695 Collier St #8 Beaumont, TX | 2.0 | 1.5 | 1121 | $1,150 | $1.03 | 43d | 1 | 1.48mi |
| 2290 Long Ave Unit 05 Beaumont, TX | 2.0 | 1.0 | 1055 | $950 | $0.90 | 23d | 1 | 1.49mi |
Listing history 8 events
-
2026-04-28status Pending
-
2026-04-16$144,690 Active
-
2024-03-07historical $1,295
-
2024-02-29$1,295
-
2022-12-14historical
-
2022-11-16soldstatus
-
2022-07-22soldstatus
-
2022-07-18soldstatus
ⓘ Source: listings_history table (triggers on properties + properties_extension) + one-shot
backfill from property_details.listing_events for pre-trigger history.
Tax reassessment forecast TX · Resets to sale price
- Current annual tax
- $2,082 · $174/mo
- Projected year-2 tax
- $2,648 · $221/mo
- Expected delta
- +$566/yr (+$47/mo · 27.2%)
ⓘ Screening estimate from a state-policy table — verify with the county assessor before closing.
Climate risk First Street
- Flood 6/10 Major FEMA zone X · 69% chance over 30 yrs
- Wildfire 1/10 Low
- Heat 9/10 Extreme 7 d/yr ≥109°F today · 24 d/yr by 30 yrs out
- Wind 9/10 Extreme 99% chance of damaging wind over 30 yrs
- Air quality 2/10 Low 1 unhealthy d/yr today · 1 by 30 yrs out
Nearby sold comps map
Loading sold comps map…
Walkable amenities ~0.75 mi
Loading nearby amenities…
Taxation est. · year 1
- Rental income
- $12,574
- − Mortgage interest
- −$8,105
- − Property taxes
- −$2,082
- − Insurance
- −$723
- − Repairs & maintenance
- −$1,006
- − Management
- −$1,006
- − Depreciation
- −$4,209
- Taxable loss
- −$4,557
- Est. tax savings @ 24.0%
- +$1,094
- After-tax cash flow
- $-884/yr
For passive investors: Depreciation is non-cash, so a rental often shows a tax loss while cash-flowing — sheltering income. Rental losses are passive: they offset passive income freely, and up to $25,000/yr can offset ordinary (W-2) income if you actively participate and your MAGI is under $100k (phasing out to $0 by $150k); unused losses carry forward. On sale, claimed depreciation is recaptured at up to 25%, and gains may owe capital-gains tax (a 1031 exchange can defer both). Figures are a year-1 estimate at your 24.0% rate — not tax advice; consult a CPA.
Schools (NCES district)
- District
- Beaumont ISD
- NCES district ID
- 4809670
- Math proficiency
- 14% ▼ -13.00%
- Reading proficiency
- 22% ▼ -7.00%
- Median HH income
- $41,683
- Composite
- 15.43/100
- National rank
- #9316
- State rank
- #789 of 826 in TX
Livability — Beaumont
- Score
- 64/100
- State rank
- #739
- US rank
- #13710
Category grades
Schools grade is shown separately in the Schools card above.
Census & demographics
- Census place
- Beaumont, TX
- County
- Jefferson County · 203,592 people
- City population
- 125,901
- Metro
- Beaumont-Port Arthur, TX
- Population (ZIP)
- 11,004
- Household income
- $31,803
- Rent vs Own
- Severe rent burden
- 657.0
Population outlook (Jefferson County) Hauer SSP2
- Today (2025)
- 259,015 people
- By 2030
- 260,685 · +0.6%
- By 2040
- 263,309 · +1.7%
- By 2050
- 265,237 · +2.4%
- By 2075
- 270,193 · +4.3%
- By 2100
- 255,628 · -1.3%
Race, ethnicity, and origin ACS 2023
- Neighborhood character
- Majority Black (60%)
- Race & ethnicity
- Black 60% Hispanic / Latino 31% Two or more races 7% White 5%
- Hispanic origin (detail)
- Mexican 25%
- Common ancestry
- Serbian 1%
- Foreign-born
- 13% · Canada
- Languages at home
- 70% English-only · Spanish 29% French/Haitian/Cajun 1%
Political lean MEDSL · Jefferson
- 2024 margin
- Lean R (+8.9) · D 45.1% · R 54.0%
- 2008→2024 swing
- -11.1pp toward R · 2008: 2.2pp · 2024: -8.9pp
- All cycles
- 2024: R+8.9 2020: R+1.6 2016: R+0.5 2012: D+1.6 2008: D+2.2
Not yet ingested
- Civics
- —
Market trends
- HPI YoY
- ▲ 5.43%
- Current HPI
- 151.9888
- Rent YoY
- —
- Metro
- Beaumont-Port Arthur, TX
- State GDP YoY
- ▲ 3.95%
- F500 in state
- 110
Industry mix (Fortune 500 HQ in TX)
| Industry | F500 HQs | Revenue |
|---|---|---|
| Energy | 16 | $1,198B |
|
||
| Technology | 5 | $198B |
|
||
| Engineering / Construction | 4 | $72B |
|
||
| Energy Services | 3 | $60B |
|
||
| Utilities | 3 | $41B |
|
||
| Healthcare | 2 | $330B |
|
||
Price history
+11073.0% since first listed8 events — show timeline
- 2026-04-28 Pending — BBOR
- 2026-04-16 Listed $144,690 BBOR
- 2024-03-07 Rental Removed $1,295 BBOR
- 2024-02-29 Listed for Rent $1,295 BBOR
- 2022-12-14 Rental Removed — RENT.
- 2022-11-16 Sold (Public Records) — Public Records
- 2022-07-22 Sold (Public Records) — Public Records
- 2022-07-18 Sold (Public Records) — Public Records
Property tax history
+3.6%/yrLatest (2025): $2,082 · +1.7% YoY. Source: county tax records.
Cash-flow waterfall
monthlySold comps — $/sqft
last 12 mo · ≤1 miLoading sold comps…