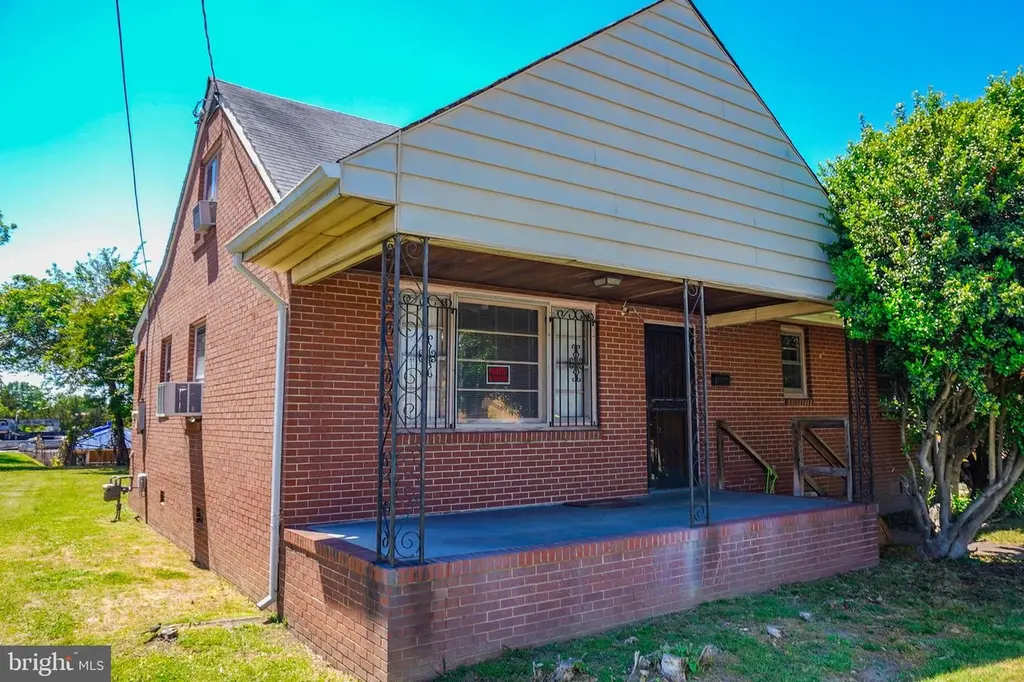
18 S Little Church St · Petersburg, VA
Flood risk 1/10 · Minimal
- FEMA flood zone
- X (unshaded)
- Chance of flooding over 30 yrs
- 0.0%
- Est. flood insurance / yr
- $507 – $1,088
Fire risk 3/10 · Minor
- Est. fire insurance / yr
- $666 – $1,236
Heat risk 8/10 · Major
- Hot days now (above 109°F)
- 7 days/yr
- Hot days in 30 yrs
- 17 days/yr
Wind risk 6/10 · Moderate
- Chance of severe wind over 30 yrs
- 42.0%
Air-quality risk 2/10 · Minimal
- Unhealthy air days now
- 0 days/yr
- Unhealthy air days in 30 yrs
- 1 days/yr
Risk factors via First Street. Map © Google.
Why this score? — see what drove the B- grade
The composite is a weighted blend of 9 inputs, each scored 0–100. Each bar is that input's sub-score; the figure is the points it added to the 100-point composite (weight × sub-score).
- Cash flow +20.8/30.0
- ARV discount +15.0/15.0
- DSCR +6.6/10.0
- Appreciation +5.7/10.0
- 1% rule +5.1/10.0
- Rent growth +4.0/5.0
- Livability +3.1/5.0
- Schools +2.9/10.0
- Condition / age +2.5/5.0
$150,000
🖨 Deal sheet (PDF) 📄 Offer letter ✓ Due diligence
Listing remarks
Back on the Market - Pending Release. Price Just Reduced! This all-brick rambler is a rare find in today’s market. Featuring four spacious bedrooms and two baths, with handcrafted bookshelves located in the main bedroom. This home boasts original oak kitchen cabinets, oak paneling along the dining room wall, and beautiful hardwood floors throughout. In addition to central AC, the property also comes with 3 additional window units. The expansive backyard offers ample space for creating a relaxing retreat or an ideal area for entertaining guests. While some minor updates may be needed, the property is overall in good condition. This is an estate sale, and the home is being sold “a
Key facts
- 6,098 sq ft lot
- 2 parking spots
- Built 1953
Property features AI
Exterior
- Parking: Two total garage/parking spaces; Two off-street spaces; On-street parking available
- Utilities: Public water; Public sewer; Natural gas for heating and hot water; Electric cooling
- Home design: Detached property; Shingle roof
- Construction: Brick construction; Brick/mortar foundation; Above-grade structure
- Exterior features: No tidal water
Interior
- Kitchen: Refrigerator; Stove; Oven (wall); Dishwasher; Disposal; Exhaust fan
- Bedrooms: Two main-level bedrooms; Two upper-level bedrooms
- Flooring: Hardwood
- Bathrooms: One full bathroom on the main level; One half bathroom on the upper level
- Heating & cooling: Forced air heating (natural gas); Central air conditioning; Ceiling fan(s); Window unit(s)
- Interior features: Drywall walls and ceilings; Estimated living area
- Laundry & utility: Washer/dryer hookup
Neighborhood map
What this means for you Summary
Snapshot
- This is a 3-bed/1.0-bath single-family listed at $150k.
Deal economics
- At list price, monthly cash flow is $205 ($2k/yr) — positive.
- The deal already cash-flows at list — no discount required.
- Meets the 1% rule at list price ($2k rent vs $150k).
- Recommended offer: $148k (1.5% below list) — sets the bar for market timing.
- Cap rate 7.9% vs local median 4.5% in Petersburg — top-decile yield for the area; either an underpriced asset or a hidden risk that comps aren't pricing in. Stress-test before assuming the spread holds.
Location & tenants
- Location reads 61/100 on livability (#413 in VA) — a middle-class / working-renter tenant base. Strengths: cost of living A+, housing A; Watch: schools D+, crime F, amenities F.
- Petersburg City Public School District (suburban): math 26% / reading 44% proficiency, ranked #131 of 131 in VA (top 100%) — families likely to look elsewhere, expect single-tenant / working-renter base with shorter leases; 79% free/reduced lunch — lower-income household profile, screen leases tightly.
- Market conditions: Rents rising fast (+5.9%/yr); 290 active listings in the ZIP; 31 comparable units currently listed for rent nearby; rentals at typical pace (median 22d on market — plan ~3-4 weeks tenant-placement turnaround); 118 units permitted in Petersburg city in 2024 (84 in 5+ unit buildings).
- This rent runs 31% of the median local income ($58k/yr) — at the standard rent-burdened threshold; future hikes will face affordability resistance.
Forward outlook
- In year one you build about $3k of equity ($1k loan paydown + $2k appreciation (1.4% local appreciation)).
- Petersburg County population projected at -10% by 2050 — secular population decline; favor cash flow + early exit over multi-decade hold.
- At projected returns (1.4% appreciation + 5.9% rent growth), your $42k cash investment doubles in ~6 years — after that, you're playing with house money.
- By year 10, paydown + projected appreciation supports a ~$32k cash-out refi (75% LTV) — recoverable capital for the next deal without selling this one.
Negotiation context
- It's been on market 26 days — a 2% lower offer ($148k) is reasonable based on typical stale-listing flexibility.
Risks & watch-outs
- Watch-outs: built in 1953 — expect roof / HVAC / electrical / plumbing capex.
- Climate carrying-cost: major wind risk, 42% chance of damaging wind over 30y; extreme-heat days projected 7→17/yr by 2055 (HVAC capex compounding) — expect insurance premiums to compound above CPI over the hold.
Questions for the listing agent
- Built in 1953 — when were the roof, HVAC, electrical panel, plumbing, and water heater last replaced?
- Is there a deadline driving the sale (1031 exchange, divorce, estate, relocation)? That informs how much negotiation room exists.
- Schools are D-rated, which usually means shorter tenancies and higher turnover. Who's the typical renter profile here, and what's been the actual vacancy rate?
- Crime grade is F in this area — have there been break-ins, vandalism, or insurance claims at this property in the last 3 years? What carrier currently insures it and at what premium?
- What's the average days-on-market for RENTAL listings here right now (not sales)? A rising rental-DOM trend means longer vacancies and softer asking-rent achievability than the comps imply.
- What's the recent tenant-quality profile in this submarket — average credit score on applications, eviction rate, late-payment / NSF rate, and stable-employment percentage? A property-management company in the area should have these aggregated.
- How much new for-sale + rental construction is in the pipeline within 1–3 miles? Heavy new supply typically softens prices + rents 12–24 months out; constrained supply supports both.
Investment metrics
- 1% rule
- 1.01% ✓
- Cap rate
- 7.94%
- Cash-on-cash
- 5.87%
- DSCR
- 1.26
- GRM
- 8.2
CMA / ARV
- ARV (on-the-fly)
- $250,675
- Comps found
- 12
Show comp detail 12 sales within ~0.75 mi
| Address | Dist | Beds/Ba | Sqft | Sold | Price | $/sf | Match |
|---|---|---|---|---|---|---|---|
| 24 N Old Church St | 0.17mi | 3/2.5 | 1,344 (-1%) | 4mo | $274,000 | $204 | 81 |
| 722 Cameron St | 0.23mi | 3/2.0 | 1,275 (-6%) | 5mo | $88,950 | $70 | 72 |
| 23 N Old Church St | 0.19mi | 3/2.0 | 1,222 (-10%) | 4mo | $259,000 | $212 | 67 |
| 449 Roundtop Ave | 0.52mi | 3/2.0 | 1,363 (+1%) | 7mo | $205,000 | $150 | 65 |
| 1048 Amelia St | 0.52mi | 3/1.5 | 1,384 (+2%) | 9mo | $140,000 | $101 | 63 |
| 528 Windham St | 0.64mi | 3/1.0 | 1,404 (+4%) | 3mo | $110,000 | $78 | 61 |
| 801 E Bank St | 0.29mi | 3/2.0 | 1,200 (-11%) | 5mo | $240,000 | $200 | 59 |
| 457 Roundtop Ave | 0.54mi | 4/2.0 (+1) | 1,296 (-4%) | 5mo | $250,000 | $193 | 54 |
| 515 Clinton St | 0.63mi | 3/2.5 | 1,320 (-3%) | 7mo | $269,950 | $205 | 54 |
| 412 Roundtop Ave | 0.46mi | 3/1.5 | 1,196 (-12%) | 8mo | $124,999 | $105 | 50 |
| 958 Old Wythe St | 0.41mi | 3/2.0 | 1,530 (+13%) | 7mo | $283,000 | $185 | 50 |
| 230 Terrace Ave | 0.26mi | 4/3.0 (+1) | 1,536 (+13%) | 5mo | $278,000 | $181 | 48 |
Match score weights: distance 35% · size 25% · config 20% · recency 20%. Top-matched comps best support the ARV.
Projected returns pro-forma
1.45% appreciation · 5.89% rent growth · sell at horizon
- IRR
- 10.6%
- Equity multiple
- 1.57×
- Total profit
- $23,736
- Equity at exit
- $54,741
- IRR
- 15.7%
- Equity multiple
- 3.13×
- Total profit
- $89,573
- Equity at exit
- $75,561
Cash invested: $42,000 (down + closing). Projections, not guarantees.
Landlord ↔ Tenant lean methodology
- Overall (STATE)
- 55 Moderately Landlord-Leaning
- State Virginia
- 55 Moderately Landlord-Leaning · D+2
- County
- — inherits STATE
- City
- — inherits STATE
ZIP-level market 23803
- Home prices YoY
- 0.3%
- Rents YoY
- 5.9%
- Active inventory
- 290
- Price-to-rent
- 8.2×
Monthly cashflow live
- Estimated rent
- $1,516 high interval (Pro) →
- Mortgage (P&I)
- −$787
- Tax from tax record
- −$143 /mo · $1,713/yr
- Insurance
- −$62
- HOA
- −$0
- Vacancy / Maint / Mgmt
- −$318
- Net cashflow
- $205
Break-even live
Sensitivity live
| Price | -10% $290 | -5% $248 | +0% $205 | +5% $163 | +10% $120 |
|---|---|---|---|---|---|
| Rent | -10% $86 | -5% $146 | +0% $205 | +5% $265 | +10% $325 |
| Rate | -1.0pp $281 | -0.5pp $244 | base $205 | +0.5pp $167 | +1.0pp $127 |
UW: 25.0% down · 7.5% · 30yr · 1.5% tax · 5.0% vac · 8.0% maint · 8.0% mgmt
Financing live
Cash to close
- Down payment
- $37,500
- Closing costs
- $4,500
- Reserves months
- —
- Total cash needed
- —
Loan-product check · same deal, 3 products live
Conventional
25% down · 7.5% · 30yr
- Down + closing
- —
- Monthly P&I
- —
- Monthly cashflow
- —
- DSCR
- —
- Eligible?
- —
Personal DTI + credit; lowest rate.
DSCR
20% down · 8.5% · 30yr
- Down + closing
- —
- Monthly P&I
- —
- Monthly cashflow
- —
- DSCR
- —
- Eligible?
- —
No personal income docs; deal must DSCR.
Hard money
10% down · 12.0% · 12mo
- Down + closing
- —
- Monthly P&I
- —
- Monthly cashflow
- —
- DSCR
- —
- Eligible?
- —
Short-term bridge; refi at stabilization.
Rent comps 31 comps
| Address | Beds | Baths | Sqft | Rent | $/sqft | DOM | Units | Dist |
|---|---|---|---|---|---|---|---|---|
| 250 E Bank St Petersburg, VA | 2.0 | 1.0–2.0 | 862 | $1,509 | $1.75 | 2d | 19 | 0.36mi |
| 212 E Wythe St Unit 1 Petersburg, VA | 4.0 | 1.5 | 1400 | $1,295 | $0.93 | 24d | 1 | 0.38mi |
| 212 E Wythe St Unit 1 Petersburg, VA | 4.0 | 1.5 | 1400 | $1,295 | $0.93 | 44d | 1 | 0.38mi |
| 30 Franklin St Petersburg, VA | 2.0 | 1.0–2.0 | 755 | $1,550 | $2.05 | 20d | 1 | 0.52mi |
| 424 Roundtop Ave Petersburg, VA | 3.0 | 1.0 | 988 | $1,350 | $1.37 | 44d | 1 | 0.52mi |
| 462 Reservoir Hts Petersburg, VA | 4.0 | 2.0 | 1640 | $1,895 | $1.16 | 24d | 1 | 0.62mi |
| 147 Witten St Petersburg, VA | 3.0 | 1.0 | 1170 | $1,495 | $1.28 | 11d | 1 | 0.65mi |
| 331 Glenwood Ct Petersburg, VA | 4.0 | 1.0 | 1242 | $1,800 | $1.45 | 3d | 1 | 0.72mi |
| 16 S Market St Petersburg, VA | 1.0–2.0 | 1.0–2.0 | 769 | $2,312 | $3.01 | 2d | 17 | 0.83mi |
| 109 Perry St Petersburg, VA | 1.0–2.0 | 1.0–2.0 | 787 | $1,577 | $2.00 | 2d | 15 | 0.92mi |
| 211 Jefferson Ave Colonial Heights, VA | 4.0 | 2.0 | 1507 | $1,900 | $1.26 | 2d | 1 | 0.93mi |
| 325 Brown St Petersburg, VA | 1.0–2.0 | 1.0–2.0 | 775 | $1,310 | $1.69 | 22d | 2 | 0.93mi |
| 325 Brown St Petersburg, VA | 1.0–2.0 | 1.0–2.0 | 797 | $1,395 | $1.75 | 15d | 9 | 0.93mi |
| 531 N Azalea Rd Petersburg, VA | 3.0 | 2.0 | 1600 | $1,595 | $1.00 | 24d | 1 | 1.06mi |
| 115 Pine St Unit 115 Petersburg, VA | 3.0 | 1.5 | 1400 | $1,462 | $1.04 | 44d | 1 | 1.17mi |
| 500 Floral Ave Colonial Heights, VA | 3.0 | 2.0 | 1196 | $1,895 | $1.58 | 24d | 1 | 1.20mi |
| 712 W Washington St Unit B Petersburg, VA | 2.0 | 1.0 | 1209 | $1,250 | $1.03 | 24d | 1 | 1.26mi |
| 714 High St Apt E Petersburg, VA | 2.0 | 2.0 | 924 | $1,300 | $1.41 | 22d | 1 | 1.31mi |
| 114 Lee Ave Colonial Heights, VA | 2.0 | 1.5 | 1088 | $1,750 | $1.61 | 24d | 1 | 1.31mi |
| 801 Hinton St Petersburg, VA | 1.0–2.0 | 1.0–2.0 | 745 | $1,395 | $1.87 | 2d | 8 | 1.32mi |
| 801 Hinton St Petersburg, VA | 1.0–2.0 | 1.0–2.0 | 834 | $1,399 | $1.68 | 20d | 2 | 1.32mi |
| 1025 S Crater Rd Petersburg, VA | 1.0–3.0 | 1.0–2.0 | 795 | $1,409 | $1.77 | 2d | 10 | 1.34mi |
| 707 Hamilton Ave Colonial Heights, VA | 2.0 | 1.0 | 999 | $1,325 | $1.33 | 12d | 1 | 1.37mi |
| 815 Floral Ave Colonial Heights, VA | 3.0 | 1.0 | 908 | $1,500 | $1.65 | 21d | 1 | 1.42mi |
| 214 N Dunlop St Apt 305 Petersburg, VA | 2.0 | 2.0 | 945 | $1,350 | $1.43 | 45d | 1 | 1.43mi |
| 214 N Dunlop St Petersburg, VA | 1.0–2.0 | 1.0–2.0 | 799 | $1,395 | $1.74 | 2d | 11 | 1.43mi |
| 214 N Dunlop St Unit 119 Petersburg, VA | 2.0 | 2.0 | 988 | $1,399 | $1.42 | 44d | 1 | 1.43mi |
| 406 Bradsher Ave Unit A Colonial Heights, VA | 2.0 | 1.0 | 940 | $1,050 | $1.12 | 24d | 1 | 1.46mi |
| 838 S Jones St Unit B Petersburg, VA | 2.0 | 1.0 | 1296 | $1,100 | $0.85 | 44d | 1 | 1.47mi |
| 310 Saint Luke St Petersburg, VA | 3.0 | 2.0 | 1020 | $1,491 | $1.46 | 24d | 1 | 1.49mi |
| 214 N Dunlop St Unit 400 Petersburg, VA | 2.0 | 2.0 | 892 | $1,500 | $1.68 | 44d | 1 | 1.50mi |
Listing history 15 events
-
2026-06-18days on market $150,000 Active 26 DOM
-
2026-06-17days on market $150,000 Active 25 DOM
-
2026-06-16days on market $150,000 Active 24 DOM
-
2026-06-15days on market $150,000 Active 23 DOM
-
2026-06-13remarks 687-char remark
-
2026-06-13pricestatusdays on market $150,000 Active 21 DOM
-
2026-06-08status $165,000 Pending 19 DOM
-
2026-06-07days on market $165,000 Active 19 DOM
-
2026-06-05days on market $165,000 Active 16 DOM
-
2026-06-03days on market $165,000 Active 15 DOM
-
2026-06-02days on market $165,000 Active 14 DOM
-
2026-06-01days on market $165,000 Active 13 DOM
-
2026-05-31days on market $165,000 Active 12 DOM
-
2026-05-20$165,000 Active
-
2026-05-17historical $165,000
ⓘ Source: listings_history table (triggers on properties + properties_extension) + one-shot
backfill from property_details.listing_events for pre-trigger history.
Tax reassessment forecast VA · Resets to sale price
- Current annual tax
- $1,713 · $143/mo
- Projected year-2 tax
- $1,713 · $143/mo
- Expected delta
- $0/yr ($0/mo · 0.0%)
ⓘ Screening estimate from a state-policy table — verify with the county assessor before closing.
Climate risk First Street
- Flood 1/10 Low FEMA zone X (unshaded) · 0% chance over 30 yrs
- Wildfire 3/10 Moderate
- Heat 8/10 Severe 7 d/yr ≥109°F today · 17 d/yr by 30 yrs out
- Wind 6/10 Major 42% chance of damaging wind over 30 yrs
- Air quality 2/10 Low 0 unhealthy d/yr today · 1 by 30 yrs out
Nearby sold comps map
Loading sold comps map…
Walkable amenities ~0.75 mi
Loading nearby amenities…
Taxation est. · year 1
- Rental income
- $18,186
- − Mortgage interest
- −$8,402
- − Property taxes
- −$1,713
- − Insurance
- −$750
- − Repairs & maintenance
- −$1,455
- − Management
- −$1,455
- − Depreciation
- −$4,364
- Taxable income
- $47
- Est. tax owed @ 24.0%
- −$11
- After-tax cash flow
- $2,453/yr
For passive investors: Depreciation is non-cash, so a rental often shows a tax loss while cash-flowing — sheltering income. Rental losses are passive: they offset passive income freely, and up to $25,000/yr can offset ordinary (W-2) income if you actively participate and your MAGI is under $100k (phasing out to $0 by $150k); unused losses carry forward. On sale, claimed depreciation is recaptured at up to 25%, and gains may owe capital-gains tax (a 1031 exchange can defer both). Figures are a year-1 estimate at your 24.0% rate — not tax advice; consult a CPA.
Schools (NCES district)
- District
- Petersburg City Public School District
- NCES district ID
- 5102910
- Math proficiency
- 26% ▼ -27.00%
- Reading proficiency
- 44% ▼ -8.00%
- Median HH income
- $34,362
- Composite
- 28.78/100
- National rank
- #6670
- State rank
- #131 of 131 in VA
Livability — Petersburg
- Score
- 61/100
- State rank
- #413
- US rank
- #17309
Category grades
Schools grade is shown separately in the Schools card above.
Census & demographics
- Census place
- Petersburg, VA
- County
- Chesterfield County · 406,988 people
- City population
- 63,420
- Metro
- Richmond, VA
- Population (ZIP)
- 42,012
- Household income
- $57,813
- Rent vs Own
- Severe rent burden
- 2485.0
Population outlook (Petersburg County) Hauer SSP2
- Today (2025)
- 30,488 people
- By 2030
- 29,771 · -2.4%
- By 2040
- 28,401 · -6.8%
- By 2050
- 27,279 · -10.5%
- By 2075
- 25,877 · -15.1%
- By 2100
- 24,288 · -20.3%
Race, ethnicity, and origin ACS 2023
- Neighborhood character
- Diverse neighborhood (Simpson 0.57)
- Race & ethnicity
- Black 58% White 31% Hispanic / Latino 6% Two or more races 5%
- Hispanic origin (detail)
- Mexican 1% Puerto Rican 2%
- Common ancestry
- Italian 1% Romanian 1% Slovak 1%
- Foreign-born
- 4% · Canada
- Languages at home
- 93% English-only · Spanish 5%
Political lean MEDSL · Petersburg
- 2024 margin
- Solid D (+72.8) · D 85.8% · R 13.0% · Other 1.2%
- 2008→2024 swing
- -5.7pp toward R · 2008: 78.5pp · 2024: 72.8pp
- All cycles
- 2024: D+72.8 2020: D+76.5 2016: D+77.0 2012: D+80.4 2008: D+78.5
Not yet ingested
- Civics
- —
Market trends
- HPI YoY
- ▲ 1.45%
- Current HPI
- 480.5365
- Rent YoY
- ▲ 5.89%
- Metro
- Richmond, VA
- State GDP YoY
- ▲ 2.40%
- F500 in state
- 50
Industry mix (Fortune 500 HQ in VA)
| Industry | F500 HQs | Revenue |
|---|---|---|
| Aerospace / Defense | 4 | $236B |
|
||
| Technology / Defense | 3 | $32B |
|
||
| Financial Services | 2 | $176B |
|
||
| Utilities | 2 | $27B |
|
||
| Insurance | 2 | $25B |
|
||
| Technology | 2 | $15B |
|
||
Price history
+0.0% since first listed2 events — show timeline
- 2026-05-20 Listed $165,000 BRIGHT MLS
- 2026-05-17 Coming Soon $165,000 BRIGHT MLS
Property tax history
+2.6%/yrLatest (2025): $1,713 · +42.1% YoY. Source: county tax records.
Cash-flow waterfall
monthlySold comps — $/sqft
last 12 mo · ≤1 miLoading sold comps…