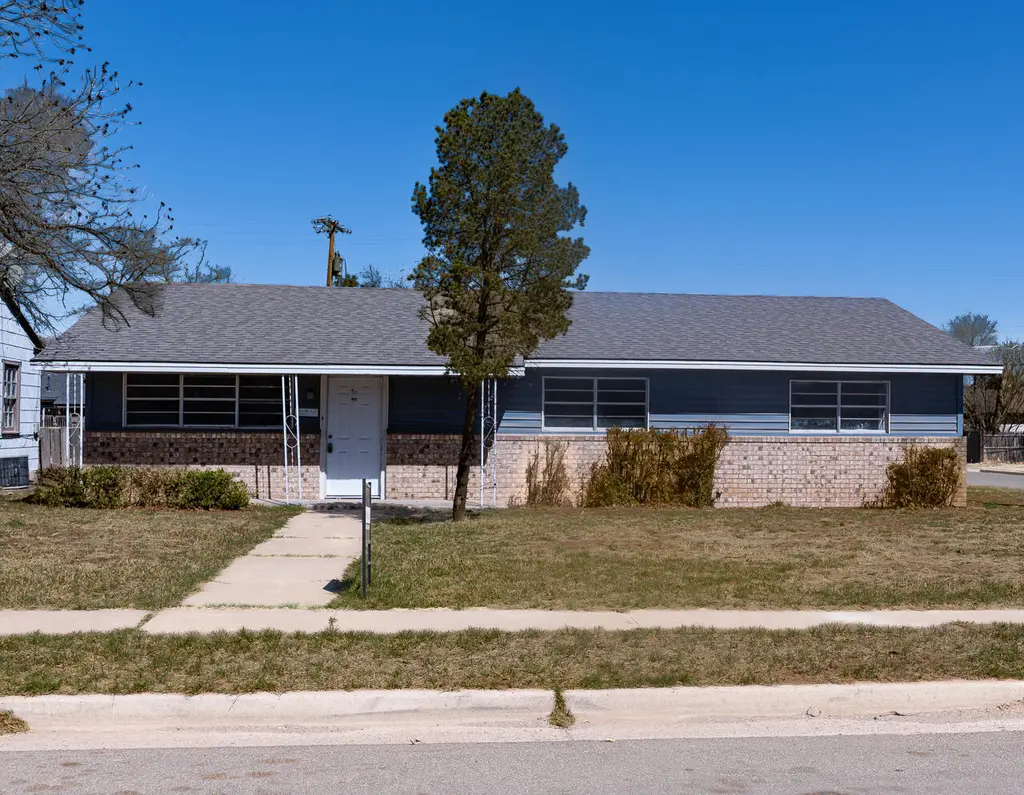
2802 40th St · Lubbock, TX
Flood risk 1/10 · Minimal
- FEMA flood zone
- X (unshaded)
- Chance of flooding over 30 yrs
- 0.0%
- Est. flood insurance / yr
- $507 – $1,088
Fire risk 1/10 · Minimal
- Est. fire insurance / yr
- $1,222 – $2,270
Heat risk 5/10 · Moderate
- Hot days now (above 99°F)
- 7 days/yr
- Hot days in 30 yrs
- 21 days/yr
Wind risk 2/10 · Minimal
- Chance of severe wind over 30 yrs
- —
Air-quality risk 2/10 · Minimal
- Unhealthy air days now
- 1 days/yr
- Unhealthy air days in 30 yrs
- 1 days/yr
Risk factors via First Street. Map © Google.
Why this score? — see what drove the C- grade
The composite is a weighted blend of 9 inputs, each scored 0–100. Each bar is that input's sub-score; the figure is the points it added to the 100-point composite (weight × sub-score).
- Cash flow +19.1/30.0
- ARV discount +10.4/15.0
- DSCR +6.0/10.0
- 1% rule +4.5/10.0
- Livability +4.0/5.0
- Condition / age +3.8/5.0
- Schools +3.1/10.0
- Rent growth +3.0/5.0
- Appreciation +0.0/10.0
$145,000
🖨 Deal sheet (PDF) 📄 Offer letter ✓ Due diligence
Listing remarks MLS
Recently updated investment opportunity in an established Lubbock neighborhood. This property features new flooring throughout majority of the home and updated bathrooms with granite vanities, and new granite countertops in the kitchen as well. Functional layout with solid rental potential and minimal immediate maintenance needs. Suitable for both long-term hold or resale.
Key facts
- New flooring
- Granite vanities
- Updated bathrooms
Tags
Neighborhood map
What this means for you Summary
Snapshot
- This is a 3-bed/2.0-bath single-family listed at $145k. Condition is rated good.
Deal economics
- At list price, monthly cash flow is $153 ($2k/yr) — positive.
- The deal already cash-flows at list — no discount required.
- To meet the 1% rule (rent ≥ 1% of price), the offer needs to be $138k (5.1% below list).
- Recommended offer: $136k (6.0% below list) — sets the bar for market timing.
Location & tenants
- Location reads 80/100 on livability (#37 in TX, #1,749 nationally) — a professional / high-income tenant draw. Strengths: commute A+, cost of living A+, housing A+; Watch: employment C-, crime F.
- Lubbock ISD (urban): math 36% / reading 39% proficiency, ranked #481 of 826 in TX (top 58%) — families likely to look elsewhere, expect single-tenant / working-renter base with shorter leases; 60% free/reduced lunch — lower-income household profile, screen leases tightly.
- Zoned schools: Wheelock El (math 32% / reading 32%, grade F, #2,268 of 4,322 statewide, top 55%, 323 students, 92% FRL); Slaton Middle (math 13% / reading 16%, grade F, #1,583 of 1,662 statewide, top 96%, 355 students, 96% FRL); Monterey H S (math 28% / reading 37%, grade F, #1,029 of 1,632 statewide, top 64%, 2,114 students, 72% FRL) — zoned schools average 86% FRL vs 60% district-wide (26 pts higher); higher-poverty schools than district average — tighter screening recommended.
- Market conditions: Rents rising (+1.9%/yr); 187 active listings in the ZIP; 40 comparable units currently listed for rent nearby; rentals at typical pace (median 23d on market — plan ~3-4 weeks tenant-placement turnaround); 45% of comp listings sitting > 30 days — soft ceiling on asking rent; 2,219 units permitted in Lubbock County in 2024 (252 in 5+ unit buildings).
Forward outlook
- Local home prices are declining (-3.0%/yr); year-one equity from $1k of loan paydown is wiped out by about $4k of value loss. Plan a longer hold.
- Lubbock County population projected at +39% by 2050 — long-run rental-demand tailwind backs the buy-and-hold thesis.
Negotiation context
- It's been on market 90 days — a 6% lower offer ($136k) is reasonable based on typical stale-listing flexibility.
- 2 sale attempts; this cycle's ask has dropped $20k (12%) from the opening price — seller is motivated, your offer sets the floor, not the list.
Risks & watch-outs
- Climate carrying-cost: extreme-heat days projected 7→21/yr by 2055 (HVAC capex compounding) — expect insurance premiums to compound above CPI over the hold.
Questions for the listing agent
- It's been on market 90 days. Have you received any prior offers? Is the seller open to a 6% concession, seller financing, or rate buy-down credit?
- Built in 1971 — when were the roof, HVAC, electrical panel, plumbing, and water heater last replaced?
- Why hasn't it sold? Are there any deal-killer items the seller is aware of (foundation, flood, title, zoning, code violations)?
- Is there a deadline driving the sale (1031 exchange, divorce, estate, relocation)? That informs how much negotiation room exists.
- Schools are D-rated, which usually means shorter tenancies and higher turnover. Who's the typical renter profile here, and what's been the actual vacancy rate?
- Crime grade is F in this area — have there been break-ins, vandalism, or insurance claims at this property in the last 3 years? What carrier currently insures it and at what premium?
- What's the average days-on-market for RENTAL listings here right now (not sales)? A rising rental-DOM trend means longer vacancies and softer asking-rent achievability than the comps imply.
- What's the recent tenant-quality profile in this submarket — average credit score on applications, eviction rate, late-payment / NSF rate, and stable-employment percentage? A property-management company in the area should have these aggregated.
- How much new for-sale + rental construction is in the pipeline within 1–3 miles? Heavy new supply typically softens prices + rents 12–24 months out; constrained supply supports both.
Investment metrics
- 1% rule
- 0.95% ✗
- Cap rate
- 7.56%
- Cash-on-cash
- 4.53%
- DSCR
- 1.20
- GRM
- 8.8
CMA / ARV
- ARV (median comp)
- $155,067
- List price
- $145,000
- Delta
- -6.49%
- Verdict
- FAIR
- Comps
- 3 within 1.0 mi
Show comp detail 1 sale within ~0.75 mi
| Address | Dist | Beds/Ba | Sqft | Sold | Price | $/sf | Match |
|---|---|---|---|---|---|---|---|
| 2619 44th St | 0.32mi | 3/2.0 | 1,460 (-1%) | 13mo | $199,000 | $136 | 72 |
Match score weights: distance 35% · size 25% · config 20% · recency 20%. Top-matched comps best support the ARV.
Projected returns pro-forma
-3.0% appreciation · 1.94% rent growth · sell at horizon
- IRR
- -10.4%
- Equity multiple
- 0.63×
- Total profit
- $-15,205
- Equity at exit
- $21,620
- IRR
- -2.5%
- Equity multiple
- 0.84×
- Total profit
- $-6,588
- Equity at exit
- $12,537
Cash invested: $40,600 (down + closing). Projections, not guarantees.
Landlord ↔ Tenant lean methodology
- Overall (STATE)
- 87 Strongly Landlord-Friendly
- State Texas
- 87 Strongly Landlord-Friendly · R+5
- County
- — inherits STATE
- City
- — inherits STATE
ZIP-level market 79413
- Rents YoY
- 1.9%
- Active inventory
- 187
- Price-to-rent
- 8.8×
Monthly cashflow live
- Estimated rent
- $1,376 high interval (Pro) →
- Mortgage (P&I)
- −$760
- Tax from tax record
- −$113 /mo · $1,358/yr
- Insurance
- −$60
- HOA
- −$0
- Vacancy / Maint / Mgmt
- −$289
- Net cashflow
- $153
Break-even live
Sensitivity live
| Price | -10% $235 | -5% $194 | +0% $153 | +5% $112 | +10% $71 |
|---|---|---|---|---|---|
| Rent | -10% $45 | -5% $99 | +0% $153 | +5% $208 | +10% $262 |
| Rate | -1.0pp $226 | -0.5pp $190 | base $153 | +0.5pp $116 | +1.0pp $78 |
UW: 25.0% down · 7.5% · 30yr · 1.5% tax · 5.0% vac · 8.0% maint · 8.0% mgmt
Financing live
Cash to close
- Down payment
- $36,250
- Closing costs
- $4,350
- Reserves months
- —
- Total cash needed
- —
Loan-product check · same deal, 3 products live
Conventional
25% down · 7.5% · 30yr
- Down + closing
- —
- Monthly P&I
- —
- Monthly cashflow
- —
- DSCR
- —
- Eligible?
- —
Personal DTI + credit; lowest rate.
DSCR
20% down · 8.5% · 30yr
- Down + closing
- —
- Monthly P&I
- —
- Monthly cashflow
- —
- DSCR
- —
- Eligible?
- —
No personal income docs; deal must DSCR.
Hard money
10% down · 12.0% · 12mo
- Down + closing
- —
- Monthly P&I
- —
- Monthly cashflow
- —
- DSCR
- —
- Eligible?
- —
Short-term bridge; refi at stabilization.
Rent comps 40 comps
| Address | Beds | Baths | Sqft | Rent | $/sqft | DOM | Units | Dist |
|---|---|---|---|---|---|---|---|---|
| 2712 37th St Lubbock, TX | 3.0 | 1.0 | 1136 | $1,300 | $1.14 | 45d | 1 | 0.20mi |
| 2812 43rd St Unit 6 Lubbock, TX | 2.0 | 1.0 | 1104 | $700 | $0.63 | 45d | 1 | 0.21mi |
| 2812 43rd St Unit 7 Lubbock, TX | 2.0 | 1.0 | 1104 | $750 | $0.68 | 23d | 1 | 0.22mi |
| 2609 41st St Lubbock, TX | 3.0 | 2.0 | 1469 | $1,550 | $1.06 | 23d | 1 | 0.22mi |
| 2801 36th St Lubbock, TX | 3.0 | 2.0 | 1446 | $2,700 | $1.87 | 45d | 1 | 0.23mi |
| 2605 41st St Lubbock, TX | 2.0 | 1.0 | 882 | $995 | $1.13 | 15d | 1 | 0.24mi |
| 2616 37th St Lubbock, TX | 2.0 | 1.0 | 950 | $1,200 | $1.26 | 23d | 1 | 0.25mi |
| 2815 43rd St Unit 11 Lubbock, TX | 2.0 | 1.0 | 1085 | $800 | $0.74 | 23d | 1 | 0.26mi |
| 2521 40th St Lubbock, TX | 2.0 | 1.0 | 902 | $1,195 | $1.32 | 23d | 1 | 0.26mi |
| 2706 44th St Apt C Lubbock, TX | 2.0 | 1.0 | 900 | $680 | $0.76 | 45d | 1 | 0.27mi |
| 2521 41st St Lubbock, TX | 2.0 | 1.0 | 990 | $925 | $0.93 | 45d | 1 | 0.28mi |
| 3019 42nd St Lubbock, TX | 3.0 | 1.0 | 1053 | $1,250 | $1.19 | 23d | 1 | 0.28mi |
| 3108 39th St Lubbock, TX | 3.0 | 2.0 | 1504 | $1,295 | $0.86 | 23d | 1 | 0.30mi |
| 2701 44th St Lubbock, TX | 1.0–3.0 | 1.0–1.5 | 657 | $1,075 | $1.64 | 15d | 25 | 0.33mi |
| 2514 42nd St Lubbock, TX | 3.0 | 1.0 | 943 | $950 | $1.01 | 15d | 1 | 0.33mi |
| 2611 44th St Lubbock, TX | 3.0 | 1.0 | 1200 | $1,395 | $1.16 | 45d | 1 | 0.33mi |
| 2607 44th St Lubbock, TX | 2.0 | 2.0 | 988 | $1,325 | $1.34 | 45d | 1 | 0.34mi |
| 3114 40th St Lubbock, TX | 3.0 | 2.0 | 1488 | $1,375 | $0.92 | 45d | 1 | 0.34mi |
| 2513 43rd St Lubbock, TX | 2.0 | 1.0 | 912 | $1,150 | $1.26 | 45d | 1 | 0.36mi |
| 2513 43rd St Lubbock, TX | 2.0 | 1.0 | 912 | $1,150 | $1.26 | 15d | 1 | 0.36mi |
| 3126 38th St Lubbock, TX | 2.0 | 1.0 | 1248 | $1,195 | $0.96 | 45d | 1 | 0.37mi |
| 3114 37th St Lubbock, TX | 3.0 | 1.0 | 988 | $1,095 | $1.11 | 45d | 1 | 0.38mi |
| 2508 37th St Lubbock, TX | 3.0 | 2.5 | 1495 | $1,700 | $1.14 | 45d | 1 | 0.38mi |
| 3105 44th St Lubbock, TX | 3.0 | 2.0 | 1348 | $1,375 | $1.02 | 23d | 1 | 0.39mi |
| 2506 37th St Lubbock, TX | 3.0 | 1.0 | 1053 | $1,550 | $1.47 | 23d | 1 | 0.39mi |
| 3006 46th St Lubbock, TX | 2.0 | 1.0 | 1047 | $995 | $0.95 | 23d | 1 | 0.40mi |
| 2504 44th St Lubbock, TX | 2.0 | 1.0 | 939 | $995 | $1.06 | 45d | 1 | 0.43mi |
| 2823 33rd St Lubbock, TX | 3.0 | 1.0 | 1105 | $950 | $0.86 | 45d | 1 | 0.43mi |
| 3006 47th St Lubbock, TX | 3.0 | 1.0 | 1016 | $1,150 | $1.13 | 23d | 1 | 0.46mi |
| 3019 33rd St Lubbock, TX | 3.0 | 1.5 | 1573 | $1,500 | $0.95 | 15d | 1 | 0.48mi |
| 3101 33rd St Lubbock, TX | 3.0 | 3.0 | 1250 | $999 | $0.80 | 45d | 1 | 0.49mi |
| 2403 38th St Lubbock, TX | 3.0 | 1.5 | 1786 | $1,700 | $0.95 | 45d | 1 | 0.49mi |
| 2400 44th St Lubbock, TX | 1.0–3.0 | 1.0–2.0 | 1015 | $1,225 | $1.21 | 15d | 23 | 0.51mi |
| 3007 32nd St Lubbock, TX | 3.0 | 1.0 | 1353 | $1,325 | $0.98 | 23d | 1 | 0.52mi |
| 3019 47th St Lubbock, TX | 3.0 | 2.0 | 1298 | $1,400 | $1.08 | 23d | 1 | 0.52mi |
| 2408 35th St Lubbock, TX | 2.0 | 1.0 | 1072 | $995 | $0.93 | 23d | 1 | 0.56mi |
| 3116 33rd St Lubbock, TX | 2.0 | 1.0 | 912 | $1,195 | $1.31 | 45d | 1 | 0.56mi |
| 2412 46th St Apt A Lubbock, TX | 2.0 | 1.0 | 945 | $795 | $0.84 | 23d | 1 | 0.58mi |
| 2406 46th St Unit A Lubbock, TX | 2.0 | 1.0 | 943 | $775 | $0.82 | 23d | 1 | 0.60mi |
| 2614 31st St Lubbock, TX | 3.0 | 2.0 | 1549 | $1,650 | $1.07 | 45d | 1 | 0.61mi |
Listing history 22 events
-
2026-06-22days on market $145,000 Active 90 DOM
-
2026-06-18days on market $145,000 Active 87 DOM
-
2026-06-17days on market $145,000 Active 86 DOM
-
2026-06-16days on market $145,000 Active 85 DOM
-
2026-06-15days on market $145,000 Active 84 DOM
-
2026-06-14days on market $145,000 Active 82 DOM
-
2026-06-13status $145,000 Active 81 DOM
-
2026-06-07statusdays on market $145,000 Pending 81 DOM
-
2026-06-05days on market $145,000 Active 79 DOM
-
2026-06-03days on market $145,000 Active 78 DOM
-
2026-06-02days on market $145,000 Active 77 DOM
-
2026-06-01days on market $145,000 Active 76 DOM
-
2026-05-31days on market $145,000 Active 75 DOM
-
2026-05-30days on market $145,000 Active 74 DOM
-
2026-05-16price $145,000 375-char remark
Show marketing remark (375 chars)
Recently updated investment opportunity in an established Lubbock neighborhood. This property features new flooring throughout majority of the home and updated bathrooms with granite vanities, and new granite countertops in the kitchen as well. Functional layout with solid rental potential and minimal immediate maintenance needs. Suitable for both long-term hold or resale.
-
2026-03-18price $1,600
-
2026-03-17$165,000 Active 375-char remark
Show marketing remark (375 chars)
Recently updated investment opportunity in an established Lubbock neighborhood. This property features new flooring throughout majority of the home and updated bathrooms with granite vanities, and new granite countertops in the kitchen as well. Functional layout with solid rental potential and minimal immediate maintenance needs. Suitable for both long-term hold or resale.
-
2026-01-09$1,650
-
2025-10-07soldstatus
-
2023-01-20price $97,000
-
2023-01-12price $98,000
-
2000-11-13soldstatus
ⓘ Source: listings_history table (triggers on properties + properties_extension) + one-shot
backfill from property_details.listing_events for pre-trigger history.
Tax reassessment forecast TX · Resets to sale price
- Current annual tax
- $1,358 · $113/mo
- Projected year-2 tax
- $2,654 · $221/mo
- Expected delta
- +$1,296/yr (+$108/mo · 95.4%)
ⓘ Screening estimate from a state-policy table — verify with the county assessor before closing.
Climate risk First Street
- Flood 1/10 Low FEMA zone X (unshaded) · 0% chance over 30 yrs
- Wildfire 1/10 Low
- Heat 5/10 Major 7 d/yr ≥99°F today · 21 d/yr by 30 yrs out
- Wind 2/10 Low
- Air quality 2/10 Low 1 unhealthy d/yr today · 1 by 30 yrs out
Nearby sold comps map
Loading sold comps map…
Walkable amenities ~0.75 mi
Loading nearby amenities…
Taxation est. · year 1
- Rental income
- $16,515
- − Mortgage interest
- −$8,122
- − Property taxes
- −$1,358
- − Insurance
- −$725
- − Repairs & maintenance
- −$1,321
- − Management
- −$1,321
- − Depreciation
- −$4,218
- Taxable loss
- −$550
- Est. tax savings @ 24.0%
- +$132
- After-tax cash flow
- $1,972/yr
For passive investors: Depreciation is non-cash, so a rental often shows a tax loss while cash-flowing — sheltering income. Rental losses are passive: they offset passive income freely, and up to $25,000/yr can offset ordinary (W-2) income if you actively participate and your MAGI is under $100k (phasing out to $0 by $150k); unused losses carry forward. On sale, claimed depreciation is recaptured at up to 25%, and gains may owe capital-gains tax (a 1031 exchange can defer both). Figures are a year-1 estimate at your 24.0% rate — not tax advice; consult a CPA.
Condition & rehab AI · 12 photos
This recently updated single-family home in Lubbock, TX, offers a good investment opportunity with minimal immediate maintenance needs and solid rental potential. The property features new flooring, updated bathrooms, and granite countertops, making it ready for move-in.
Value-add opportunities
- Both landscaping and curb appeal improvements — enhances curb appeal and could attract more buyers
- Both painting exterior and interior walls — fresh paint can make the home look more inviting and modern
- Both upgrading windows — newer windows can improve energy efficiency and increase home value
Renovation cost estimate screening
Value-add ROI direction
- Both landscaping and curb appeal improvements — enhances curb appeal and could attract more buyers ↑
- Both painting exterior and interior walls — fresh paint can make the home look more inviting and modern ↑
- Both upgrading windows — newer windows can improve energy efficiency and increase home value ↑
ⓘ Cost ranges are severity-bucket heuristics (US national rule-of-thumb). Get contractor quotes + a written scope before underwriting a rehab budget.
Schools (NCES district)
- District
- Lubbock ISD
- NCES district ID
- 4828500
- Math proficiency
- 36% ▼ -8.00%
- Reading proficiency
- 39% ▼ -1.00%
- Median HH income
- $39,820
- Composite
- 31.44/100
- National rank
- #5984
- State rank
- #481 of 826 in TX
Livability — Lubbock
- Score
- 80/100
- State rank
- #37
- US rank
- #1749
Category grades
Schools grade is shown separately in the Schools card above.
Census & demographics
- Census place
- Lubbock, TX
- County
- Lubbock County · 293,542 people
- City population
- 283,030
- Metro
- Lubbock, TX
- Population (ZIP)
- 23,343
- Household income
- $69,400
- Rent vs Own
- Severe rent burden
- 1211.0
Population outlook (Lubbock County) Hauer SSP2
- Today (2025)
- 345,960 people
- By 2030
- 371,449 · +7.4%
- By 2040
- 424,539 · +22.7%
- By 2050
- 481,150 · +39.1%
- By 2075
- 633,467 · +83.1%
- By 2100
- 746,853 · +115.9%
Race, ethnicity, and origin ACS 2023
- Neighborhood character
- Diverse neighborhood (Simpson 0.59)
- Race & ethnicity
- White 54% Hispanic / Latino 34% Two or more races 18% Black 6%
- Hispanic origin (detail)
- Mexican 25%
- Common ancestry
- Slovak 2% Italian 2% Serbian 1%
- Foreign-born
- 3% · Canada, China
- Languages at home
- 88% English-only · Spanish 10% Chinese 1%
Political lean MEDSL · Lubbock
- 2024 margin
- Solid R (+39.5) · D 29.7% · R 69.2% · Other 1.0%
- 2008→2024 swing
- -2.8pp toward R · 2008: -36.7pp · 2024: -39.5pp
- All cycles
- 2024: R+39.5 2020: R+32.2 2016: R+38.4 2012: R+40.9 2008: R+36.7
Not yet ingested
- Civics
- —
Market trends
- HPI YoY
- ▼ -145.52%
- Current HPI
- 239.8854
- Rent YoY
- ▲ 1.94%
- Metro
- Lubbock, TX
- State GDP YoY
- ▲ 3.95%
- F500 in state
- 110
Industry mix (Fortune 500 HQ in TX)
| Industry | F500 HQs | Revenue |
|---|---|---|
| Energy | 16 | $1,198B |
|
||
| Technology | 5 | $198B |
|
||
| Engineering / Construction | 4 | $72B |
|
||
| Energy Services | 3 | $60B |
|
||
| Utilities | 3 | $41B |
|
||
| Healthcare | 2 | $330B |
|
||
Price history
+48.0% since first listed8 events — show timeline
- 2026-05-16 Price Changed $145,000 LARMLS
- 2026-03-18 Price Changed $1,600 LARMLS
- 2026-03-17 Listed $165,000 LARMLS
- 2026-01-09 Listed for Rent $1,650 LARMLS
- 2025-10-07 Sold (Public Records) — Public Records
- 2023-01-20 Price Changed $97,000 LARMLS
- 2023-01-12 Price Changed $98,000 LARMLS
- 2000-11-13 Sold (Public Records) — Public Records
Property tax history
+1.2%/yrLatest (2025): $1,358 · -4.9% YoY. Source: county tax records.
Cash-flow waterfall
monthlySold comps — $/sqft
last 12 mo · ≤1 miLoading sold comps…