106 Davis Ln · Economy, PA
Flood risk 1/10 · Minimal
- FEMA flood zone
- X (unshaded)
- Chance of flooding over 30 yrs
- 0.0%
- Est. flood insurance / yr
- $507 – $1,088
Fire risk 1/10 · Minimal
- Est. fire insurance / yr
- $511 – $949
Heat risk 3/10 · Minor
- Hot days now (above 97°F)
- 7 days/yr
- Hot days in 30 yrs
- 17 days/yr
Wind risk 2/10 · Minimal
- Chance of severe wind over 30 yrs
- —
Air-quality risk 3/10 · Minor
- Unhealthy air days now
- 2 days/yr
- Unhealthy air days in 30 yrs
- 4 days/yr
Risk factors via First Street. Map © Google.
Why this score? — see what drove the C grade
The composite is a weighted blend of 9 inputs, each scored 0–100. Each bar is that input's sub-score; the figure is the points it added to the 100-point composite (weight × sub-score).
- Cash flow +24.1/30.0
- DSCR +7.8/10.0
- ARV discount +7.5/15.0
- 1% rule +5.7/10.0
- Livability +3.5/5.0
- Schools +3.0/10.0
- Rent growth +2.5/5.0
- Condition / age +2.5/5.0
- Appreciation +0.0/10.0
$184,900
🖨 Deal sheet (PDF) 📄 Offer letter ✓ Due diligence
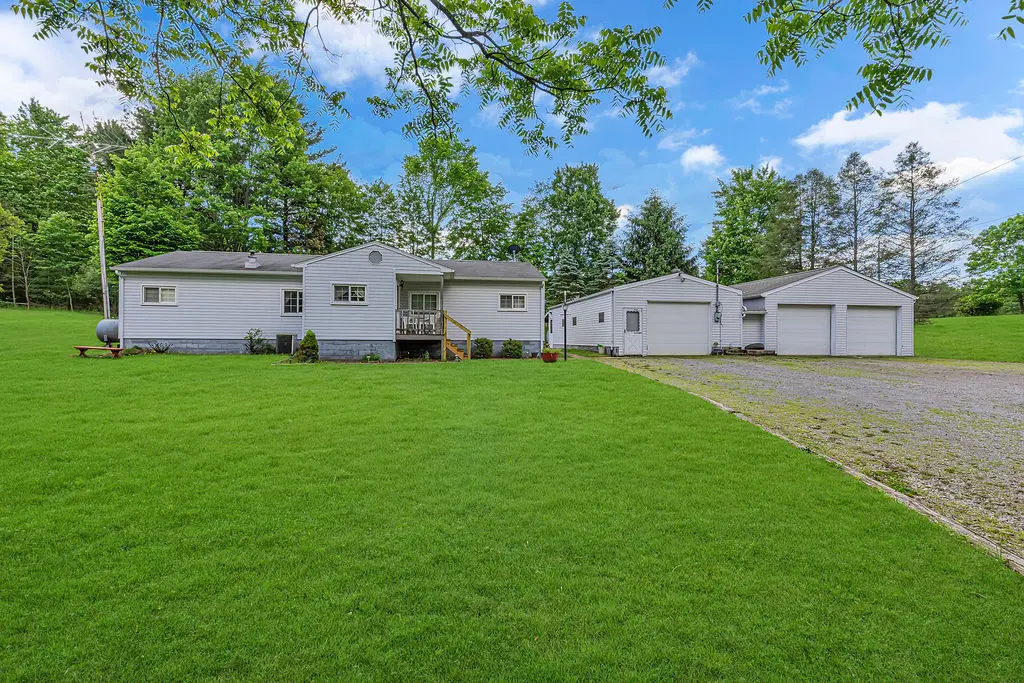
Listing remarks
Beautiful 2-Acre Setting with Dream Garage and Expanded One-Level Home Set on two gorgeous, level acres, this inviting property offers privacy, space, and an incredible garage setup perfect for hobbyists or professionals. Originally a mobile home, the residence has been thoughtfully transformed into a solid, vinyl-sided, block-foundation, 3-bed / 1-bath home with valuable additions and updates throughout. Inside, you’ll find one-level living with a convenient mudroom/laundry area upon entry. The spacious family room features a gas fireplace and gas wall heater, creating a warm and comfortable gathering space. Step outside to the 12x24 covered patio, ideal for relaxing and enjoying th
Key facts
- One level home
- Mudroom laundry area
- Dream garage
Tags
Property features AI
Exterior
- Parking: Detached garage; Garage parking with capacity for 6 vehicles (total)
- Security: Security system
- Utilities: Well water; Septic tank
- Home design: Single-story home; Vinyl siding
- Construction: Built with vinyl siding; Asphalt roof
- Exterior features: 2-acre lot; Lot dimensions approximately 461 x 171 x 461 x 171
Interior
- Kitchen: Refrigerator; Stove; Some gas appliances
- Bedrooms: Bedroom 2 (main level); Bedroom 3 (main level)
- Flooring: Vinyl flooring; Carpet
- Heating & cooling: Forced air heating (oil); Central air conditioning
- Interior features: Window screens; Window treatments; Security system
- Laundry & utility: Main-level laundry room
Neighborhood map
What this means for you Summary
Snapshot
- This is a 2-bed/1.0-bath manufactured listed at $185k.
Deal economics
- At list price, monthly cash flow is $364 ($4k/yr) — positive.
- The deal already cash-flows at list — no discount required.
- Meets the 1% rule at list price ($2k rent vs $185k).
- Cap rate 8.7% vs local median 2.8% in Economy — top-decile yield for the area; either an underpriced asset or a hidden risk that comps aren't pricing in. Stress-test before assuming the spread holds.
Location & tenants
- Location reads 69/100 on livability (#855 in PA) — a middle-class / working-renter tenant base. Strengths: crime A+, employment A+, cost of living A+; Watch: amenities F, commute F, health & safety F.
- Freedom Area SD (suburban): math 24% / reading 45% proficiency, ranked #416 of 539 in PA (top 77%) — families likely to look elsewhere, expect single-tenant / working-renter base with shorter leases.
- Zoned schools: Freedom Area El Sch (math 27% / reading 52%, grade F, #947 of 1,518 statewide, top 65%, 438 students, 53% FRL); Freedom Area Ms (math 19% / reading 42%, grade F, #376 of 512 statewide, top 74%, 370 students, 60% FRL); Freedom Area Shs (math 37% / reading 24%, grade F, #344 of 437 statewide, top 79%, 402 students, 48% FRL) — zoned schools average 54% FRL vs 38% district-wide (16 pts higher); higher-poverty schools than district average — tighter screening recommended.
- Market conditions: 35 active listings in the ZIP; 2 comparable units currently listed for rent nearby; 272 units permitted in Beaver County in 2024 (80 in 5+ unit buildings).
Forward outlook
- Local home prices are declining (-3.0%/yr); year-one equity from $1k of loan paydown is wiped out by about $6k of value loss. Plan a longer hold.
- Beaver County population projected at -14% by 2050 — secular population decline; favor cash flow + early exit over multi-decade hold.
Negotiation context
- Only 5 days on market — expect competitive offers; lowballing is unlikely to land.
Questions for the listing agent
- Built in 1968 — when were the roof, HVAC, electrical panel, plumbing, and water heater last replaced?
- Is there a deadline driving the sale (1031 exchange, divorce, estate, relocation)? That informs how much negotiation room exists.
- Schools are D-rated, which usually means shorter tenancies and higher turnover. Who's the typical renter profile here, and what's been the actual vacancy rate?
- What's the average days-on-market for RENTAL listings here right now (not sales)? A rising rental-DOM trend means longer vacancies and softer asking-rent achievability than the comps imply.
- What's the recent tenant-quality profile in this submarket — average credit score on applications, eviction rate, late-payment / NSF rate, and stable-employment percentage? A property-management company in the area should have these aggregated.
- How much new for-sale + rental construction is in the pipeline within 1–3 miles? Heavy new supply typically softens prices + rents 12–24 months out; constrained supply supports both.
Investment metrics
- 1% rule
- 1.07% ✓
- Cap rate
- 8.66%
- Cash-on-cash
- 8.45%
- DSCR
- 1.38
- GRM
- 7.8
CMA / ARV
No comps found within radius.
Projected returns pro-forma
-3.0% appreciation · 3.0% rent growth · sell at horizon
- IRR
- -3.5%
- Equity multiple
- 0.87×
- Total profit
- $-6,772
- Equity at exit
- $27,569
- IRR
- 6.2%
- Equity multiple
- 1.46×
- Total profit
- $23,920
- Equity at exit
- $15,987
Cash invested: $51,772 (down + closing). Projections, not guarantees.
Landlord ↔ Tenant lean methodology
- Overall (STATE)
- 62 Landlord-Friendly
- State Pennsylvania
- 62 Landlord-Friendly · EVEN
- County
- — inherits STATE
- City
- — inherits STATE
ZIP-level market 15042
- Active inventory
- 35
- Price-to-rent
- 7.8×
Monthly cashflow live
- Estimated rent
- $1,984 medium interval (Pro) →
- Mortgage (P&I)
- −$970
- Tax from tax record
- −$156 /mo · $1,878/yr
- Insurance
- −$77
- HOA
- −$0
- Vacancy / Maint / Mgmt
- −$417
- Net cashflow
- $364
Break-even live
Sensitivity live
| Price | -10% $469 | -5% $417 | +0% $364 | +5% $312 | +10% $260 |
|---|---|---|---|---|---|
| Rent | -10% $208 | -5% $286 | +0% $364 | +5% $443 | +10% $521 |
| Rate | -1.0pp $457 | -0.5pp $411 | base $364 | +0.5pp $316 | +1.0pp $268 |
UW: 25.0% down · 7.5% · 30yr · 1.5% tax · 5.0% vac · 8.0% maint · 8.0% mgmt
Financing live
Cash to close
- Down payment
- $46,225
- Closing costs
- $5,547
- Reserves months
- —
- Total cash needed
- —
Loan-product check · same deal, 3 products live
Conventional
25% down · 7.5% · 30yr
- Down + closing
- —
- Monthly P&I
- —
- Monthly cashflow
- —
- DSCR
- —
- Eligible?
- —
Personal DTI + credit; lowest rate.
DSCR
20% down · 8.5% · 30yr
- Down + closing
- —
- Monthly P&I
- —
- Monthly cashflow
- —
- DSCR
- —
- Eligible?
- —
No personal income docs; deal must DSCR.
Hard money
10% down · 12.0% · 12mo
- Down + closing
- —
- Monthly P&I
- —
- Monthly cashflow
- —
- DSCR
- —
- Eligible?
- —
Short-term bridge; refi at stabilization.
Rent comps 2 comps
| Address | Beds | Baths | Sqft | Rent | $/sqft | DOM | Units | Dist |
|---|---|---|---|---|---|---|---|---|
| 90 Berkley Manor Dr Cranberry Township, PA | 1.0–3.0 | 1.0–2.0 | 1023 | $1,874 | $1.83 | 3d | 16 | 1.28mi |
| 26 Monmouth Dr Cranberry Township, PA | 3.0 | 1.5 | 1470 | $2,150 | $1.46 | 3d | 1 | 1.42mi |
Listing history 6 events
-
2026-06-07statusdays on market $184,900 Pending 5 DOM
-
2026-06-05days on market $184,900 Active 4 DOM
-
2026-06-03days on market $184,900 Active 3 DOM
-
2026-06-02days on market $184,900 Active 2 DOM
-
2026-06-01remarks 693-char remark
-
2026-06-01$184,900 Active 1 DOM
ⓘ Source: listings_history table (triggers on properties + properties_extension) + one-shot
backfill from property_details.listing_events for pre-trigger history.
Tax reassessment forecast PA · Partial reset (capped growth)
- Current annual tax
- $1,878 · $156/mo
- Projected year-2 tax
- $2,400 · $200/mo
- Expected delta
- +$522/yr (+$43/mo · 27.8%)
ⓘ Screening estimate from a state-policy table — verify with the county assessor before closing.
Climate risk First Street
- Flood 1/10 Low FEMA zone X (unshaded) · 0% chance over 30 yrs
- Wildfire 1/10 Low
- Heat 3/10 Moderate 7 d/yr ≥97°F today · 17 d/yr by 30 yrs out
- Wind 2/10 Low
- Air quality 3/10 Moderate 2 unhealthy d/yr today · 4 by 30 yrs out
Nearby sold comps map
Loading sold comps map…
Walkable amenities ~0.75 mi
Loading nearby amenities…
Taxation est. · year 1
- Rental income
- $23,811
- − Mortgage interest
- −$10,357
- − Property taxes
- −$1,878
- − Insurance
- −$924
- − Repairs & maintenance
- −$1,905
- − Management
- −$1,905
- − Depreciation
- −$5,379
- Taxable income
- $1,462
- Est. tax owed @ 24.0%
- −$351
- After-tax cash flow
- $4,021/yr
For passive investors: Depreciation is non-cash, so a rental often shows a tax loss while cash-flowing — sheltering income. Rental losses are passive: they offset passive income freely, and up to $25,000/yr can offset ordinary (W-2) income if you actively participate and your MAGI is under $100k (phasing out to $0 by $150k); unused losses carry forward. On sale, claimed depreciation is recaptured at up to 25%, and gains may owe capital-gains tax (a 1031 exchange can defer both). Figures are a year-1 estimate at your 24.0% rate — not tax advice; consult a CPA.
Schools (NCES district)
- District
- Freedom Area SD
- NCES district ID
- 4210380
- Math proficiency
- 24% ▼ -18.00%
- Reading proficiency
- 45% ▼ -13.00%
- Median HH income
- $51,392
- Composite
- 29.98/100
- National rank
- #6369
- State rank
- #416 of 539 in PA
Livability — Economy
- Score
- 69/100
- State rank
- #855
- US rank
- #8973
Category grades
Schools grade is shown separately in the Schools card above.
Census & demographics
- City population
- 9,574
- Population (ZIP)
- 7,859
Population outlook (Beaver County) Hauer SSP2
- Today (2025)
- 164,976 people
- By 2030
- 161,449 · -2.1%
- By 2040
- 151,752 · -8.0%
- By 2050
- 141,155 · -14.4%
- By 2075
- 118,142 · -28.4%
- By 2100
- 91,740 · -44.4%
Race, ethnicity, and origin ACS 2023
- Neighborhood character
- Predominantly White (95%)
- Race & ethnicity
- White 95% Two or more races 3% Hispanic / Latino 1%
- Common ancestry
- Romanian 9% Italian 2% Lithuanian 2%
- Foreign-born
- 1%
- Languages at home
- 96% English-only · Russian/Polish/Slavic 2% Spanish 1%
Political lean MEDSL · Beaver
- 2024 margin
- Strong R (+20.7) · D 39.2% · R 59.9%
- 2008→2024 swing
- -17.9pp toward R · 2008: -2.8pp · 2024: -20.7pp
- All cycles
- 2024: R+20.7 2020: R+17.7 2016: R+20.1 2012: R+6.6 2008: R+2.8
Not yet ingested
- Civics
- —
Market trends
- HPI YoY
- ▼ -156.69%
- Current HPI
- 241.6334
- Rent YoY
- —
- Metro
- —
- State GDP YoY
- ▲ 1.68%
- F500 in state
- 34
Industry mix (Fortune 500 HQ in PA)
| Industry | F500 HQs | Revenue |
|---|---|---|
| Healthcare | 2 | $309B |
|
||
| Insurance | 2 | $27B |
|
||
| Telecommunications / Media | 1 | $124B |
|
||
| Industrial Distribution | 1 | $22B |
|
||
| Financial Services | 1 | $20B |
|
||
| Chemicals / Materials | 1 | $18B |
|
||
Price history
1 event — show timeline
- 2026-05-30 Listed $184,900 West Penn MLS
Property tax history
+5.2%/yrLatest (2026): $1,878 · +6.3% YoY. Source: county tax records.
Cash-flow waterfall
monthlySold comps — $/sqft
last 12 mo · ≤1 miLoading sold comps…