 Duplex
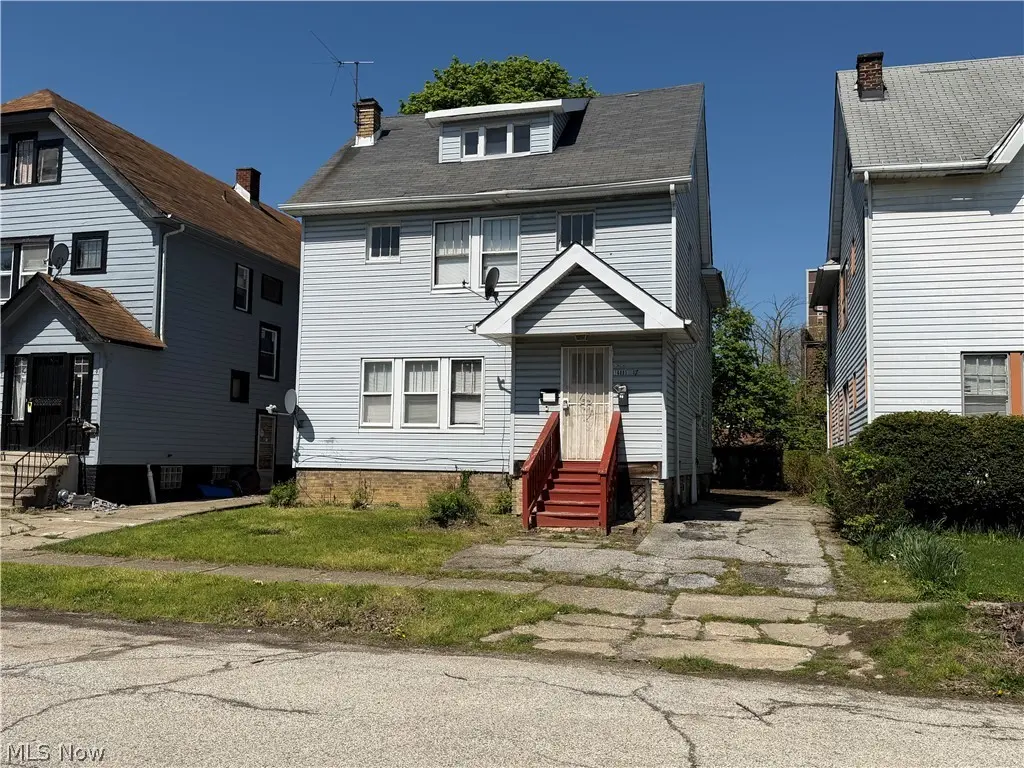
16005-16007 Nelamere Rd · East Cleveland, OH
Flood risk 1/10 · Minimal
- FEMA flood zone
- X (unshaded)
- Chance of flooding over 30 yrs
- 0.0%
- Est. flood insurance / yr
- $473 – $860
Fire risk 1/10 · Minimal
- Est. fire insurance / yr
- $713 – $1,323
Heat risk 3/10 · Minor
- Hot days now (above 95°F)
- 7 days/yr
- Hot days in 30 yrs
- 16 days/yr
Wind risk 1/10 · Minimal
- Chance of severe wind over 30 yrs
- —
Air-quality risk 3/10 · Minor
- Unhealthy air days now
- 3 days/yr
- Unhealthy air days in 30 yrs
- 5 days/yr
Risk factors via First Street. Map © Google.
Why this score? — see what drove the B- grade
The composite is a weighted blend of 9 inputs, each scored 0–100. Each bar is that input's sub-score; the figure is the points it added to the 100-point composite (weight × sub-score).
- Cash flow +30.0/30.0
- 1% rule +10.0/10.0
- DSCR +10.0/10.0
- ARV discount +7.5/15.0
- Rent growth +3.8/5.0
- Condition / age +3.8/5.0
- Livability +3.3/5.0
- Schools +0.7/10.0
- Appreciation +0.0/10.0
$149,900
🖨 Deal sheet (PDF) 📄 Offer letter ✓ Due diligence
Multi-family units
County records classify this as Multi-Family (2-4 Unit). Listing-text estimate: 2 units. confirmed
Listing remarks MLS
Amazing Investment! This up and down duplex offers so much! Down unit has 2 bedrooms, one full bath, living room and dining room area, kitchen and tenant paying $700/month plus gas/electric. UP unit is extraordinary with 2nd level having 2 bedrooms and one bath and 3rd level containing 3 more bedrooms and another full bath! So 5 bedrooms total to the UP unit and 2 full baths! The rent potential is amazing! Updates include: Vinyl Siding, glassblock windows to basement, Paint to 2nd + 3rd level, one newer hot water tank, updated electrical panels, and updated electrical meter bases on exterior! Roof is less than 10 years. Selling AS IS, seller to order the city of E Cleveland POS. Buyer to assume POS. Great property! Close to downtown, hospitals, parks, restaurants, shopping and more! Hurry this won't last long, contact today to see or for information. Selling AS IS, seller to order the city of E Cleveland POS. Buyer to assume POS. Great property! Close to downtown, hospitals, p
Key facts
- New tear-off roof
- Full basement
- Updated bathrooms
Tags
Neighborhood map
What this means for you Summary
Snapshot
- This is a 2 × 4-bed/1.5-bath units multifamily listed at $150k. Condition is rated good.
Deal economics
- At list price, monthly cash flow is $1k ($18k/yr) — positive. Per door: $735/mo.
- The deal already cash-flows at list — no discount required.
- Meets the 1% rule at list price ($3k rent vs $150k).
Location & tenants
- Location reads 66/100 on livability (#650 in OH) — a middle-class / working-renter tenant base. Strengths: commute A+, cost of living A+, health & safety A+; Watch: schools F, crime F, employment F.
- East Cleveland City School District (suburban): math 4% / reading 17% proficiency, ranked #652 of 656 in OH (top 99%) — low school quality limits family demand, transient renter base, plan for 1-2y turnover; 92% free/reduced lunch — lower-income household profile, screen leases tightly.
- Market conditions: Rents rising fast (+5.2%/yr); 101 active listings in the ZIP; 2 comparable units currently listed for rent nearby; lower-income renter base — watch delinquency; 1,441 units permitted in Cuyahoga County in 2024 (700 in 5+ unit buildings).
- At $3,171/mo this rent would consume 132% of the median local household income ($29k/yr) (locally 1702% of renters already pay >50% of income on rent) — very limited rent-growth headroom before tenants either downsize or default.
Forward outlook
- Local home prices are declining (-3.0%/yr); year-one equity from $1k of loan paydown is wiped out by about $4k of value loss. Plan a longer hold.
- Cuyahoga County population projected to shrink 8% by 2050 — rents likely to lag national; underwrite the cash flow, not the appreciation.
- At projected returns (-3.0% appreciation + 5.2% rent growth), your $42k cash investment doubles in ~3 years — after that, you're playing with house money.
Negotiation context
- Only 12 days on market — expect competitive offers; lowballing is unlikely to land.
- 4 sale attempts since 4y ago with the ask held roughly flat each time — persistent listings suggest the price (not the market) is what's stuck; bring a comps-based counter.
- Current owner paid $57k; list at $150k implies a 163% gain — meaningful room to come down on a strong offer.
Risks & watch-outs
- Watch-outs: built in 1925 — expect roof / HVAC / electrical / plumbing capex.
Questions for the listing agent
- Can we see the unit-by-unit rent roll, current vacancy, and any below-market leases? What's the average tenancy length?
- What capital expenditures (roof, boiler, parking lot, exteriors) have been made in the last 5 years, and what's planned in the next 2?
- Built in 1925 — when were the roof, HVAC, electrical panel, plumbing, and water heater last replaced?
- Is there a deadline driving the sale (1031 exchange, divorce, estate, relocation)? That informs how much negotiation room exists.
- Schools are F-rated, which usually means shorter tenancies and higher turnover. Who's the typical renter profile here, and what's been the actual vacancy rate?
- Crime grade is F in this area — have there been break-ins, vandalism, or insurance claims at this property in the last 3 years? What carrier currently insures it and at what premium?
- What's the average days-on-market for RENTAL listings here right now (not sales)? A rising rental-DOM trend means longer vacancies and softer asking-rent achievability than the comps imply.
- What's the recent tenant-quality profile in this submarket — average credit score on applications, eviction rate, late-payment / NSF rate, and stable-employment percentage? A property-management company in the area should have these aggregated.
- How much new apartment / multifamily construction is in the pipeline within 1–3 miles? Heavy new supply (>2% of stock underway) typically softens rents 12–24 months out; light construction supports rent growth.
Investment metrics
- 1% rule
- 2.12% ✓
- Cap rate
- 18.05%
- Cash-on-cash
- 42.00%
- DSCR
- 2.87
- GRM
- 3.9
CMA / ARV
No comps found within radius.
Projected returns pro-forma
-3.0% appreciation · 5.16% rent growth · sell at horizon
- IRR
- 41.1%
- Equity multiple
- 2.82×
- Total profit
- $76,369
- Equity at exit
- $22,351
- IRR
- 48.4%
- Equity multiple
- 6.18×
- Total profit
- $217,378
- Equity at exit
- $12,961
Cash invested: $41,972 (down + closing). Projections, not guarantees.
Landlord ↔ Tenant lean methodology
- Overall (STATE)
- 73 Landlord-Friendly
- State Ohio
- 73 Landlord-Friendly · R+6
- County
- — inherits STATE
- City
- — inherits STATE
ZIP-level market 44112
- Rents YoY
- 5.2%
- Active inventory
- 101
- Price-to-rent
- 7.9×
Monthly cashflow live
- Estimated rent
- $3,171 high interval (Pro) →
- Mortgage (P&I)
- −$786
- Tax est. 1.5%
- −$187 /mo · $2,248/yr
- Insurance
- −$62
- HOA
- −$0
- Vacancy / Maint / Mgmt
- −$666
- Net cashflow
- $1,469
Break-even live
Sensitivity live
| Price | -10% $1,573 | -5% $1,521 | +0% $1,469 | +5% $1,417 | +10% $1,366 |
|---|---|---|---|---|---|
| Rent | -10% $1,219 | -5% $1,344 | +0% $1,469 | +5% $1,594 | +10% $1,720 |
| Rate | -1.0pp $1,545 | -0.5pp $1,507 | base $1,469 | +0.5pp $1,430 | +1.0pp $1,391 |
2-unit breakdown (identical units grouped — click to expand)
| Units | Beds | Baths | Est. rent |
|---|---|---|---|
| 2× units | 4 | 1.5 | $3,170 |
| #1 | 4 | 1.5 | $1,585 |
| #2 | 4 | 1.5 | $1,585 |
| Total (2 units) | $3,171 | ||
UW: 25.0% down · 7.5% · 30yr · 1.5% tax · 5.0% vac · 8.0% maint · 8.0% mgmt
Financing live
Cash to close
- Down payment
- $37,475
- Closing costs
- $4,497
- Reserves months
- —
- Total cash needed
- —
Loan-product check · same deal, 3 products live
Conventional
25% down · 7.5% · 30yr
- Down + closing
- —
- Monthly P&I
- —
- Monthly cashflow
- —
- DSCR
- —
- Eligible?
- —
Personal DTI + credit; lowest rate.
DSCR
20% down · 8.5% · 30yr
- Down + closing
- —
- Monthly P&I
- —
- Monthly cashflow
- —
- DSCR
- —
- Eligible?
- —
No personal income docs; deal must DSCR.
Hard money
10% down · 12.0% · 12mo
- Down + closing
- —
- Monthly P&I
- —
- Monthly cashflow
- —
- DSCR
- —
- Eligible?
- —
Short-term bridge; refi at stabilization.
Rent comps 2 comps
| Address | Beds | Baths | Sqft | Rent | $/sqft | DOM | Units | Dist |
|---|---|---|---|---|---|---|---|---|
| 1853 Noble Rd Cleveland, OH | 8.0 | 2.0 | 2387 | $1,500 | $0.63 | 3d | 1 | 0.23mi |
| 1853 Noble Rd Cleveland, OH | 7.0 | 2.0 | 2387 | $600 | $0.25 | 45d | 1 | 0.23mi |
Listing history 9 events
-
2026-06-21days on market $149,900 Active 12 DOM
-
2026-06-18days on market $149,900 Active 9 DOM
-
2026-06-17days on market $149,900 Active 8 DOM
-
2026-06-16days on market $149,900 Active 7 DOM
-
2026-06-15days on market $149,900 Active 6 DOM
-
2026-06-13days on market $149,900 Active 4 DOM
-
2026-06-13days on market $149,900 Active 3 DOM
-
2026-06-10remarks 699-char remark
-
2026-06-10$149,900 Active 1 DOM
ⓘ Source: listings_history table (triggers on properties + properties_extension) + one-shot
backfill from property_details.listing_events for pre-trigger history.
Climate risk First Street
- Flood 1/10 Low FEMA zone X (unshaded) · 0% chance over 30 yrs
- Wildfire 1/10 Low
- Heat 3/10 Moderate 7 d/yr ≥95°F today · 16 d/yr by 30 yrs out
- Wind 1/10 Low
- Air quality 3/10 Moderate 3 unhealthy d/yr today · 5 by 30 yrs out
Nearby sold comps map
Loading sold comps map…
Walkable amenities ~0.75 mi
Loading nearby amenities…
Taxation est. · year 1
- Rental income
- $38,052
- − Mortgage interest
- −$8,397
- − Property taxes
- −$2,248
- − Insurance
- −$750
- − Repairs & maintenance
- −$3,044
- − Management
- −$3,044
- − Depreciation
- −$4,361
- Taxable income
- $16,208
- Est. tax owed @ 24.0%
- −$3,890
- After-tax cash flow
- $13,740/yr
For passive investors: Depreciation is non-cash, so a rental often shows a tax loss while cash-flowing — sheltering income. Rental losses are passive: they offset passive income freely, and up to $25,000/yr can offset ordinary (W-2) income if you actively participate and your MAGI is under $100k (phasing out to $0 by $150k); unused losses carry forward. On sale, claimed depreciation is recaptured at up to 25%, and gains may owe capital-gains tax (a 1031 exchange can defer both). Figures are a year-1 estimate at your 24.0% rate — not tax advice; consult a CPA.
Condition & rehab AI · 13 photos
This well-maintained duplex offers two spacious units with updated kitchens and bathrooms, and a new roof. The exterior could benefit from a fresh coat of paint to enhance curb appeal.
Value-add opportunities
- Both Paint the exterior — Enhances curb appeal and resale value
- Both Replace the hot water tank — Improves energy efficiency and reduces maintenance costs
- Both Upgrade the electrical panels — Ensures safety and meets current electrical standards
Renovation cost estimate screening
Value-add ROI direction
- Both Paint the exterior — Enhances curb appeal and resale value ↑
- Both Replace the hot water tank — Improves energy efficiency and reduces maintenance costs ↑
- Both Upgrade the electrical panels — Ensures safety and meets current electrical standards ↑
ⓘ Cost ranges are severity-bucket heuristics (US national rule-of-thumb). Get contractor quotes + a written scope before underwriting a rehab budget.
Schools (NCES district)
- District
- East Cleveland City School District
- NCES district ID
- 3904390
- Math proficiency
- 4% ▼ -16.00%
- Reading proficiency
- 17% ▼ -13.00%
- Median HH income
- $22,726
- Composite
- 7.38/100
- National rank
- #9954
- State rank
- #652 of 656 in OH
Livability — East Cleveland
- Score
- 66/100
- State rank
- #650
- US rank
- #11510
Category grades
Schools grade is shown separately in the Schools card above.
Census & demographics
- Census place
- East Cleveland, OH
- County
- Cuyahoga County · 1,090,369 people
- City population
- 17,848
- Metro
- Cleveland-Elyria, OH
- Population (ZIP)
- 17,848
- Household income
- $28,799
- Rent vs Own
- Severe rent burden
- 1702.0
Population outlook (Cuyahoga County) Hauer SSP2
- Today (2025)
- 1,244,621 people
- By 2030
- 1,230,093 · -1.2%
- By 2040
- 1,189,108 · -4.5%
- By 2050
- 1,145,706 · -7.9%
- By 2075
- 1,076,557 · -13.5%
- By 2100
- 978,987 · -21.3%
Race, ethnicity, and origin ACS 2023
- Neighborhood character
- Predominantly Black (89%)
- Race & ethnicity
- Black 89% White 7% Two or more races 2% Hispanic / Latino 1%
- Common ancestry
- Lithuanian 1%
- Foreign-born
- 4% · Canada
- Languages at home
- 93% English-only · French/Haitian/Cajun 3% Spanish 2% Russian/Polish/Slavic 1%
Political lean MEDSL · Cuyahoga
- 2024 margin
- Solid D (+31.5) · D 65.4% · R 33.9%
- 2008→2024 swing
- -7.4pp toward R · 2008: 38.9pp · 2024: 31.5pp
- All cycles
- 2024: D+31.5 2020: D+34.1 2016: D+35.0 2012: D+38.7 2008: D+38.9
Not yet ingested
- Civics
- —
Market trends
- HPI YoY
- ▼ -115.61%
- Current HPI
- 67.2162
- Rent YoY
- ▲ 5.16%
- Metro
- Cleveland-Elyria, OH
- State GDP YoY
- ▲ 1.98%
- F500 in state
- 48
Industry mix (Fortune 500 HQ in OH)
| Industry | F500 HQs | Revenue |
|---|---|---|
| Insurance | 3 | $145B |
|
||
| Industrial Machinery | 3 | $49B |
|
||
| Financial Services | 3 | $24B |
|
||
| Consumer Goods | 2 | $93B |
|
||
| Aerospace / Defense | 2 | $47B |
|
||
| Utilities | 2 | $33B |
|
||
Price history
+106.8% since first listed10 events — show timeline
- 2026-06-08 Listed $149,900 MLSNOW
- 2025-10-02 Listing Removed — MLSNOW
- 2025-05-28 Relisted — MLSNOW
- 2025-04-17 Contingent — MLSNOW
- 2025-04-11 Listed $135,000 MLSNOW
- 2023-02-13 Sold (MLS) $57,000 MLSNOW
- 2023-01-26 Pending — MLSNOW
- 2022-12-30 Contingent — MLSNOW
- 2022-12-11 Price Changed $69,500 MLSNOW
- 2022-11-14 Listed $72,500 MLSNOW
Cash-flow waterfall
monthlySold comps — $/sqft
last 12 mo · ≤1 miLoading sold comps…