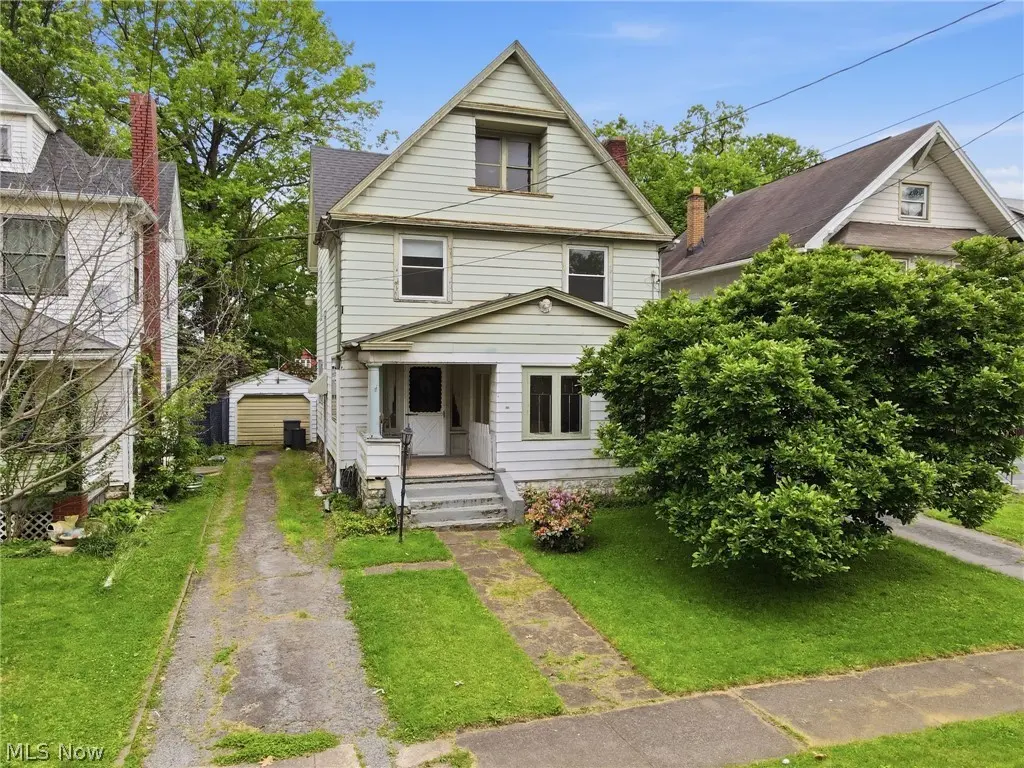
1221 Florencedale Ave · Youngstown, OH
Flood risk 1/10 · Minimal
- FEMA flood zone
- X (unshaded)
- Chance of flooding over 30 yrs
- 0.0%
- Est. flood insurance / yr
- $473 – $860
Fire risk 1/10 · Minimal
- Est. fire insurance / yr
- $713 – $1,323
Heat risk 3/10 · Minor
- Hot days now (above 97°F)
- 7 days/yr
- Hot days in 30 yrs
- 17 days/yr
Wind risk 1/10 · Minimal
- Chance of severe wind over 30 yrs
- —
Air-quality risk 3/10 · Minor
- Unhealthy air days now
- 1 days/yr
- Unhealthy air days in 30 yrs
- 4 days/yr
Risk factors via First Street. Map © Google.
Why this score? — see what drove the B grade
The composite is a weighted blend of 9 inputs, each scored 0–100. Each bar is that input's sub-score; the figure is the points it added to the 100-point composite (weight × sub-score).
- Cash flow +30.0/30.0
- ARV discount +15.0/15.0
- DSCR +10.0/10.0
- 1% rule +9.6/10.0
- Livability +4.0/5.0
- Rent growth +2.5/5.0
- Condition / age +2.5/5.0
- Schools +0.9/10.0
- Appreciation +0.0/10.0
$64,900
🖨 Deal sheet 📄 Offer letter ✓ Due diligence
Listing remarks
Welcome to 1221 Florencedale Ave - a classic 1907 North Side home full of character, space, and opportunity. Offering 3 bedrooms, 1.5 baths, and 1,792 square feet of living space, this property is conveniently located near Wick Park and Youngstown State University, with easy access to downtown amenities, restaurants, and campus life. Inside, you'll find spacious living areas, large bedrooms, and abundant natural light throughout. A recently added main-floor half bath adds everyday convenience, while the roof replacement in 2019 provides added peace of mind. The home retains much of its original charm and architectural character, offering a strong foundation for someone ready to make it thei
Key facts
- Main floor half bath
- Partial attic
- Unfinished basement
Tags
Property features AI
Exterior
- Parking: Driveway; Attached garage with 1 car space
- Utilities: Public water; Public sewer
- Home design: 2-story house; Property described as fixer and updated/remodeled; Shingle roof
- Construction: Aluminum and wood siding; Built (year per assessor)
- Exterior features: Less than half-acre lot
Interior
- Kitchen: Range; Refrigerator
- Bedrooms: Total of 7 rooms (includes bedrooms and living spaces)
- Bathrooms: One full bathroom; One half bathroom; One main-level bathroom
- Heating & cooling: Forced air heating (gas); Ceiling fans for cooling
- Interior features: Full basement; Front porch; One fireplace
- Laundry & utility: Washer and dryer in basement
Neighborhood map
What this means for you Summary
Snapshot
- This is a 3-bed/1.0-bath single-family listed at $65k.
Deal economics
- At list price, monthly cash flow is $359 ($4k/yr) — positive.
- The deal already cash-flows at list — no discount required.
- Meets the 1% rule at list price ($950 rent vs $65k).
- Recommended offer: $64k (1.5% below list) — sets the bar for market timing.
- Cap rate 12.9% vs local median 7.0% in Youngstown — top-decile yield for the area; either an underpriced asset or a hidden risk that comps aren't pricing in. Stress-test before assuming the spread holds.
Location & tenants
- Location reads 81/100 on livability (#99 in OH, #1,506 nationally) — a professional / high-income tenant draw. Strengths: amenities A+, commute A+, cost of living A+; Watch: crime F, employment F.
- Youngstown City (urban): math 8% / reading 17% proficiency, ranked #649 of 656 in OH (top 99%) — low school quality limits family demand, transient renter base, plan for 1-2y turnover; 88% free/reduced lunch — lower-income household profile, screen leases tightly.
- Market conditions: 80 active listings in the ZIP; 4 comparable units currently listed for rent nearby; rentals lingering (median 44d on market — plan ~5-8 weeks vacancy on turnover, expect pricing pressure); 50% of comp listings sitting > 30 days — soft ceiling on asking rent; lower-income renter base — watch delinquency; 147 units permitted in Mahoning County in 2024 (0 in 5+ unit buildings).
- This rent runs 31% of the median local income ($36k/yr) — at the standard rent-burdened threshold; future hikes will face affordability resistance.
Forward outlook
- Local home prices are declining (-3.0%/yr); year-one equity from $449 of loan paydown is wiped out by about $2k of value loss. Plan a longer hold.
- Mahoning County population projected at -14% by 2050 — secular population decline; favor cash flow + early exit over multi-decade hold.
- At projected returns (-3.0% appreciation + 3.0% rent growth), your $18k cash investment doubles in ~6 years — after that, you're playing with house money.
Negotiation context
- It's been on market 21 days — a 2% lower offer ($64k) is reasonable based on typical stale-listing flexibility.
Risks & watch-outs
- Watch-outs: built in 1907 — expect roof / HVAC / electrical / plumbing capex.
Questions for the listing agent
- Built in 1907 — when were the roof, HVAC, electrical panel, plumbing, and water heater last replaced?
- Is there a deadline driving the sale (1031 exchange, divorce, estate, relocation)? That informs how much negotiation room exists.
- Crime grade is F in this area — have there been break-ins, vandalism, or insurance claims at this property in the last 3 years? What carrier currently insures it and at what premium?
- What's the average days-on-market for RENTAL listings here right now (not sales)? A rising rental-DOM trend means longer vacancies and softer asking-rent achievability than the comps imply.
- What's the recent tenant-quality profile in this submarket — average credit score on applications, eviction rate, late-payment / NSF rate, and stable-employment percentage? A property-management company in the area should have these aggregated.
- How much new for-sale + rental construction is in the pipeline within 1–3 miles? Heavy new supply typically softens prices + rents 12–24 months out; constrained supply supports both.
Investment metrics
- 1% rule
- 1.46% ✓
- Cap rate
- 12.93%
- Cash-on-cash
- 23.69%
- DSCR
- 2.05
- GRM
- 5.7
CMA / ARV
- ARV (on-the-fly)
- $100,352
- Comps found
- 3
Show comp detail 3 sales within ~0.75 mi
| Address | Dist | Beds/Ba | Sqft | Sold | Price | $/sf | Match |
|---|---|---|---|---|---|---|---|
| 62 Baldwin | 0.24mi | 4/1.0 (+1) | 1,842 (+3%) | 17mo | $102,500 | $56 | 65 |
| 1370 Logan Ave | 0.32mi | 3/1.0 | 1,524 (-15%) | 10mo | $45,900 | $30 | 52 |
| 1537 Ohio Ave | 0.39mi | 3/2.0 | 1,567 (-13%) | 14mo | $120,500 | $77 | 46 |
Match score weights: distance 35% · size 25% · config 20% · recency 20%. Top-matched comps best support the ARV.
Projected returns pro-forma
-3.0% appreciation · 3.0% rent growth · sell at horizon
- IRR
- 16.8%
- Equity multiple
- 1.68×
- Total profit
- $12,312
- Equity at exit
- $9,677
- IRR
- 25.3%
- Equity multiple
- 3.20×
- Total profit
- $40,061
- Equity at exit
- $5,611
Cash invested: $18,172 (down + closing). Projections, not guarantees.
Landlord ↔ Tenant lean methodology
- Overall (STATE)
- 73 Landlord-Friendly
- State Ohio
- 73 Landlord-Friendly · R+6
- County
- — inherits STATE
- City
- — inherits STATE
ZIP-level market 44505
- Home prices YoY
- -14.5%
- Active inventory
- 80
- Price-to-rent
- 5.7×
Monthly cashflow live
- Estimated rent
- $950 medium interval (Pro) →
- Mortgage (P&I)
- −$340
- Tax from tax record
- −$25 /mo · $297/yr
- Insurance
- −$27
- HOA
- −$0
- Vacancy / Maint / Mgmt
- −$200
- Net cashflow
- $359
Break-even live
UW: 25.0% down · 7.5% · 30yr · 1.5% tax · 5.0% vac · 8.0% maint · 8.0% mgmt
Financing live
Cash to close
- Down payment
- $16,225
- Closing costs
- $1,947
- Reserves months
- —
- Total cash needed
- —
Loan-product check · same deal, 3 products live
Conventional
25% down · 7.5% · 30yr
- Down + closing
- —
- Monthly P&I
- —
- Monthly cashflow
- —
- DSCR
- —
- Eligible?
- —
Personal DTI + credit; lowest rate.
DSCR
20% down · 8.5% · 30yr
- Down + closing
- —
- Monthly P&I
- —
- Monthly cashflow
- —
- DSCR
- —
- Eligible?
- —
No personal income docs; deal must DSCR.
Hard money
10% down · 12.0% · 12mo
- Down + closing
- —
- Monthly P&I
- —
- Monthly cashflow
- —
- DSCR
- —
- Eligible?
- —
Short-term bridge; refi at stabilization.
Rent comps 4 comps
| Address | Beds | Baths | Sqft | Rent | $/sqft | DOM | Units | Dist |
|---|---|---|---|---|---|---|---|---|
| 351 Lincoln Ave Youngstown, OH | 3.0–5.0 | 3.0–5.0 | 1527 | $699 | $0.46 | 13d | 10 | 0.83mi |
| 176 Upland Ave Unit 1 Youngstown, OH | 4.0 | 2.0 | 1300 | $1,225 | $0.94 | 43d | 1 | 1.10mi |
| 465 Gypsy Ln Youngstown, OH | 2.0 | 1.0–2.0 | 1060 | $920 | $0.87 | 13d | 1 | 1.33mi |
| 465 Gypsy Ln Youngstown, OH | 2.0 | 2.0 | 1320 | $1,120 | $0.85 | 43d | 1 | 1.37mi |
Listing history 17 events
-
2026-06-19days on market $64,900 Active 21 DOM
-
2026-06-18days on market $64,900 Active 20 DOM
-
2026-06-17price $64,900 Active 19 DOM
-
2026-06-17days on market $74,900 Active 19 DOM
-
2026-06-16days on market $74,900 Active 18 DOM
-
2026-06-15days on market $74,900 Active 17 DOM
-
2026-06-14days on market $74,900 Active 15 DOM
-
2026-06-13days on market $74,900 Active 14 DOM
-
2026-06-10days on market $74,900 Active 12 DOM
-
2026-06-09days on market $74,900 Active 11 DOM
-
2026-06-08days on market $74,900 Active 10 DOM
-
2026-06-07days on market $74,900 Active 9 DOM
-
2026-06-03days on market $74,900 Active 5 DOM
-
2026-06-02days on market $74,900 Active 4 DOM
-
2026-06-01days on market $74,900 Active 3 DOM
-
2026-05-31days on market $74,900 Active 2 DOM
-
2026-05-29$74,900 Active
ⓘ Source: listings_history table (triggers on properties + properties_extension) + one-shot
backfill from property_details.listing_events for pre-trigger history.
Tax reassessment forecast OH · Partial reset (capped growth)
- Current annual tax
- $297 · $25/mo
- Projected year-2 tax
- $655 · $55/mo
- Expected delta
- +$358/yr (+$30/mo · 120.5%)
ⓘ Screening estimate from a state-policy table — verify with the county assessor before closing.
Climate risk First Street
- Flood 1/10 Low FEMA zone X (unshaded) · 0% chance over 30 yrs
- Wildfire 1/10 Low
- Heat 3/10 Moderate 7 d/yr ≥97°F today · 17 d/yr by 30 yrs out
- Wind 1/10 Low
- Air quality 3/10 Moderate 1 unhealthy d/yr today · 4 by 30 yrs out
Nearby sold comps map
Loading sold comps map…
Walkable amenities ~0.75 mi
Loading nearby amenities…
Taxation est. · year 1
- Rental income
- $11,406
- − Mortgage interest
- −$3,635
- − Property taxes
- −$297
- − Insurance
- −$324
- − Repairs & maintenance
- −$912
- − Management
- −$912
- − Depreciation
- −$1,888
- Taxable income
- $3,436
- Est. tax owed @ 24.0%
- −$825
- After-tax cash flow
- $3,480/yr
For passive investors: Depreciation is non-cash, so a rental often shows a tax loss while cash-flowing — sheltering income. Rental losses are passive: they offset passive income freely, and up to $25,000/yr can offset ordinary (W-2) income if you actively participate and your MAGI is under $100k (phasing out to $0 by $150k); unused losses carry forward. On sale, claimed depreciation is recaptured at up to 25%, and gains may owe capital-gains tax (a 1031 exchange can defer both). Figures are a year-1 estimate at your 24.0% rate — not tax advice; consult a CPA.
Schools (NCES district)
- District
- Youngstown City
- NCES district ID
- 3904516
- Math proficiency
- 8% ▼ -15.00%
- Reading proficiency
- 17% ▼ -10.00%
- Median HH income
- $25,257
- Composite
- 9.29/100
- National rank
- #9858
- State rank
- #649 of 656 in OH
Livability — Youngstown
- Score
- 81/100
- State rank
- #99
- US rank
- #1506
Category grades
Schools grade is shown separately in the Schools card above.
Census & demographics
- Census place
- Youngstown, OH
- County
- Mahoning · 224,175 people
- City population
- 28,503
- Metro
- Youngstown-Warren, OH
- Population (ZIP)
- 16,449
- Household income
- $36,480
- Rent vs Own
- Severe rent burden
- 10.8
Population outlook (Mahoning County) Hauer SSP2
- Today (2025)
- 223,932 people
- By 2030
- 218,387 · -2.5%
- By 2040
- 205,367 · -8.3%
- By 2050
- 193,606 · -13.5%
- By 2075
- 173,694 · -22.4%
- By 2100
- 151,147 · -32.5%
Race, ethnicity, and origin ACS 2023
- Neighborhood character
- Diverse neighborhood (Simpson 0.68)
- Race & ethnicity
- Black 42% White 37% Two or more races 15% Hispanic / Latino 12%
- Hispanic origin (detail)
- Puerto Rican 10%
- Common ancestry
- Romanian 2% Scotch-Irish 1%
- Foreign-born
- 3% · Canada
- Languages at home
- 88% English-only · Spanish 9% Arabic 1% French/Haitian/Cajun 1%
Political lean MEDSL · Mahoning
- 2024 margin
- Lean R (+9.4) · D 44.9% · R 54.4%
- 2008→2024 swing
- -36.1pp toward R · 2008: 26.6pp · 2024: -9.4pp
- All cycles
- 2024: R+9.4 2020: R+1.9 2016: D+3.0 2012: D+27.7 2008: D+26.6
Not yet ingested
- Civics
- —
Market trends
- HPI YoY
- ▼ -32.64%
- Current HPI
- 192.3375
- Rent YoY
- —
- Metro
- —
- State GDP YoY
- ▲ 1.98%
- F500 in state
- 48
Industry mix (Fortune 500 HQ in OH)
| Industry | F500 HQs | Revenue |
|---|---|---|
| Insurance | 3 | $145B |
|
||
| Industrial Machinery | 3 | $49B |
|
||
| Financial Services | 3 | $24B |
|
||
| Consumer Goods | 2 | $93B |
|
||
| Aerospace / Defense | 2 | $47B |
|
||
| Utilities | 2 | $33B |
|
||
Price history
1 event — show timeline
- 2026-05-29 Listed $74,900 MLSNOW
Property tax history
+3.7%/yrLatest (2025): $297 · -11.8% YoY. Source: county tax records.
Cash-flow waterfall
monthlySold comps — $/sqft
last 12 mo · ≤1 miLoading sold comps…