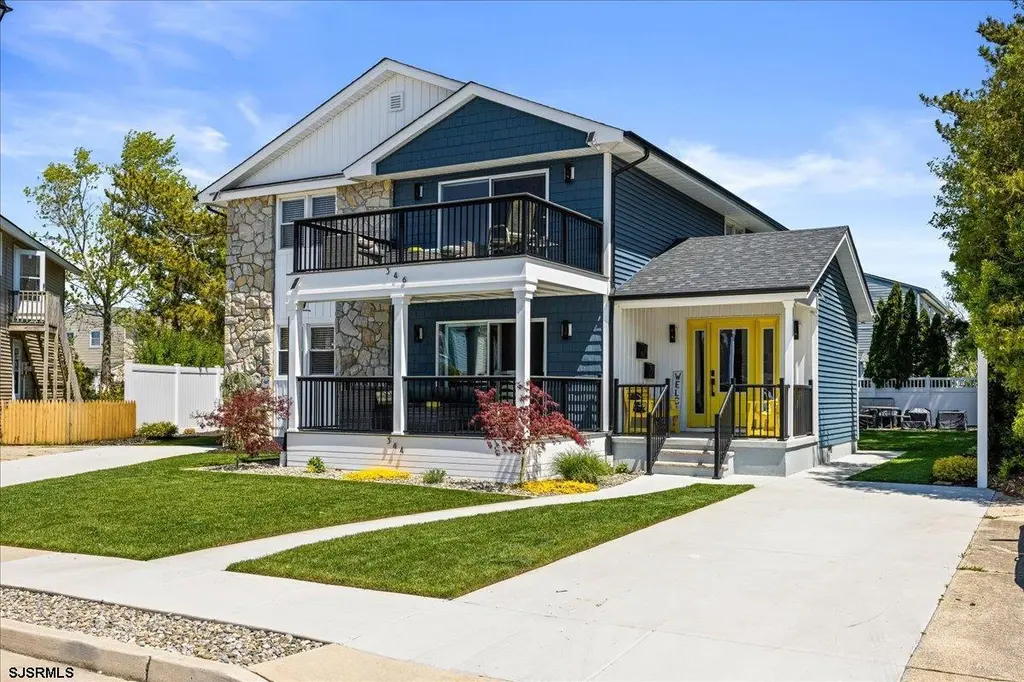
344-346 Hampshire Dr · Ventnor City, NJ
Flood risk 9/10 · Severe
- FEMA flood zone
- AE
- Chance of flooding over 30 yrs
- 0.99%
- Est. flood insurance / yr
- $1,737 – $8,500
Fire risk 2/10 · Minimal
- Est. fire insurance / yr
- $526 – $976
Heat risk 8/10 · Major
- Hot days now (above 95°F)
- 7 days/yr
- Hot days in 30 yrs
- 16 days/yr
Wind risk 8/10 · Major
- Chance of severe wind over 30 yrs
- 80.0%
Air-quality risk 2/10 · Minimal
- Unhealthy air days now
- 1 days/yr
- Unhealthy air days in 30 yrs
- 2 days/yr
Risk factors via First Street. Map © Google.
Why this score? — see what drove the B grade
The composite is a weighted blend of 9 inputs, each scored 0–100. Each bar is that input's sub-score; the figure is the points it added to the 100-point composite (weight × sub-score).
- Cash flow +30.0/30.0
- DSCR +10.0/10.0
- 1% rule +9.2/10.0
- ARV discount +7.5/15.0
- Rent growth +5.0/5.0
- Condition / age +4.8/5.0
- Livability +3.6/5.0
- Schools +3.3/10.0
- Appreciation +0.0/10.0
$1,249,000
🖨 Deal sheet 📄 Offer letter ✓ Due diligence
Listing remarks
WOW, CHECK OUT THIS MONEY-MAKER!! INCREDIBLE OPPORTUNITY TO OWN A BEAUTIFUL, RENOVATED VENTNOR DUPLEX! Nothing to do here but enjoy one unit and start collecting income on the other. . OR rent both, perfect for year-round, seasonal rentals or Air BNB! All the hard work has been done here! First and second floor units each with 3 large bedrooms and 2 full baths. These duplexes have GREAT SPACE!! Spacious living rooms, dining areas and beautiful modern kitchens with laundry rooms. Fabulous outdoor space with huge backyards, front decks and porches and parking for each unit! Great private location. .the perks go on and on! Wonderful neighborhood close to Lafayette School and a short bike ride
Key facts
- Renovated duplex
- Huge backyards
- Porches
Tags
Property features AI
Finance
- Other: Sellers Property Condition document on file
- Financial info: Offered for sale; Seasonal and weekly rental potential; Two total units
Exterior
- Parking: Parking for three or more cars; Parking pad (no garage)
- Utilities: Public water; Public sewer; Gas water heater
- Home design: Duplex (renovated); Located in boardwalk area; Suitable for condo conversion or multi-family use
- Construction: Stone and vinyl exterior; Crawl space foundation
- Exterior features: Deck; Porch; Outside shower; Shed; Boardwalk access; Curbs and sidewalks; Concrete driveway; Automatic sprinkler system
Interior
- Kitchen: Dishwasher; Gas stove; Self-cleaning oven; Refrigerator; Eat-in kitchen
- Bedrooms: Two 3-bedroom units (multi-unit property)
- Heating & cooling: Central air conditioning; Natural gas heating
- Interior features: Window blinds and shades; Ceiling fans
- Laundry & utility: Washer and dryer; Laundry/utility room
Neighborhood map
What this means for you Summary
Snapshot
- This is a single-family listed at $1.25M. Condition is rated excellent.
Deal economics
- At list price, monthly cash flow is $5k ($60k/yr) — positive.
- The deal already cash-flows at list — no discount required.
- Meets the 1% rule at list price ($18k rent vs $1.25M).
- Recommended offer: $1.21M (3.0% below list) — sets the bar for market timing.
- Cap rate 11.5% vs local median 4.1% in Ventnor City — top-decile yield for the area; either an underpriced asset or a hidden risk that comps aren't pricing in. Stress-test before assuming the spread holds.
Location & tenants
- Location reads 72/100 on livability (#202 in NJ) — a middle-class / working-renter tenant base. Strengths: health & safety A+, commute A-, crime B+; Watch: schools C-, amenities F, cost of living F.
- Ventnor City School District (suburban): math 27% / reading 49% proficiency, ranked #266 of 472 in NJ (top 56%) — families likely to look elsewhere, expect single-tenant / working-renter base with shorter leases.
- Market conditions: Rents rising fast (+57.3%/yr); 155 active listings in the ZIP; 7 comparable units currently listed for rent nearby; rentals lingering (median 44d on market — plan ~5-8 weeks vacancy on turnover, expect pricing pressure); 71% of comp listings sitting > 30 days — soft ceiling on asking rent; 672 units permitted in Atlantic County in 2024 (258 in 5+ unit buildings).
- At $17,783/mo this rent would consume 309% of the median local household income ($69k/yr) (locally 329% of renters already pay >50% of income on rent) — very limited rent-growth headroom before tenants either downsize or default.
Forward outlook
- Local home prices are declining (-3.0%/yr); year-one equity from $9k of loan paydown is wiped out by about $37k of value loss. Plan a longer hold.
- Atlantic County population projected at -12% by 2050 — secular population decline; favor cash flow + early exit over multi-decade hold.
- At projected returns (-3.0% appreciation + 8.0% rent growth), your $350k cash investment doubles in ~6 years — after that, you're playing with house money.
Negotiation context
- It's been on market 42 days — a 3% lower offer ($1.21M) is reasonable based on typical stale-listing flexibility.
Risks & watch-outs
- Watch-outs: flood insurance adds $427/mo.
- Climate carrying-cost: in FEMA flood zone AE (mandatory federal flood insurance); severe wind risk, 80% chance of damaging wind over 30y; extreme-heat days projected 7→16/yr by 2055 (HVAC capex compounding) — expect insurance premiums to compound above CPI over the hold.
Questions for the listing agent
- It's been on market 42 days. Have you received any prior offers? Is the seller open to a 3% concession, seller financing, or rate buy-down credit?
- Built in 1972 — when were the roof, HVAC, electrical panel, plumbing, and water heater last replaced?
- What's the actual annual flood-insurance premium (NFIP or private), and is the property in a SFHA with mandatory coverage?
- Is there a deadline driving the sale (1031 exchange, divorce, estate, relocation)? That informs how much negotiation room exists.
- What's the average days-on-market for RENTAL listings here right now (not sales)? A rising rental-DOM trend means longer vacancies and softer asking-rent achievability than the comps imply.
- What's the recent tenant-quality profile in this submarket — average credit score on applications, eviction rate, late-payment / NSF rate, and stable-employment percentage? A property-management company in the area should have these aggregated.
- How much new for-sale + rental construction is in the pipeline within 1–3 miles? Heavy new supply typically softens prices + rents 12–24 months out; constrained supply supports both.
Investment metrics
- 1% rule
- 1.42% ✓
- Cap rate
- 11.50%
- Cash-on-cash
- 18.59%
- DSCR
- 1.83
- GRM
- 5.9
CMA / ARV
- ARV (median comp)
- $789,840
- List price
- $1,249,000
- Delta
- 58.13%
- Verdict
- OVERPRICED
- Comps
- 12 within 1.0 mi
Show comp detail 12 sales within ~0.75 mi
| Address | Dist | Beds/Ba | Sqft | Sold | Price | $/sf | Match |
|---|---|---|---|---|---|---|---|
| 203 N Melbourne Ave | 0.24mi | 4/3.0 | 2,626 (-7%) | 5mo | $1,675,000 | $638 | 73 |
| 420 N Delavan Ave | 0.61mi | 4/3.5 | 2,850 (+1%) | 1mo | $1,670,000 | $586 | 69 |
| 14 N Cambridge Ave | 0.60mi | 4/3.0 | 2,808 (-0%) | 4mo | $1,210,000 | $431 | 68 |
| 214 N Brunswick Dr | 0.47mi | 6/4.0 | 2,650 (-6%) | 1mo | $1,995,000 | $753 | 67 |
| 26 N Delavan Ave Ave | 0.63mi | 5/4.5 | 2,750 (-2%) | 0mo | $2,750,000 | $1,000 | 66 |
| 21 N Douglas Ave | 0.66mi | 6/4.5 | 2,842 (+1%) | 4mo | $2,575,000 | $906 | 65 |
| 602 N Dorset Ave | 0.69mi | 4/2.5 | 2,877 (+2%) | 2mo | $760,000 | $264 | 63 |
| 18 N Buffalo #B Ave | 0.39mi | 4/3.5 | 2,500 (-11%) | 2mo | $1,640,000 | $656 | 61 |
| 105 S Stratford Ave | 0.67mi | 5/4.5 | 3,000 (+6%) | 0mo | $3,200,000 | $1,067 | 58 |
| 111 N Brunswick Ave | 0.49mi | 5/3.5 | 2,500 (-11%) | 0mo | $2,175,000 | $870 | 58 |
| 16 N Buffalo Ave | 0.48mi | 4/3.5 | 2,500 (-11%) | 2mo | $1,640,000 | $656 | 57 |
| 29 East Dr | 0.45mi | 4/2.5 | 2,426 (-14%) | 1mo | $1,525,000 | $629 | 55 |
Match score weights: distance 35% · size 25% · config 20% · recency 20%. Top-matched comps best support the ARV.
Projected returns pro-forma
-3.0% appreciation · 8.0% rent growth · sell at horizon
- IRR
- 14.1%
- Equity multiple
- 1.60×
- Total profit
- $209,982
- Equity at exit
- $186,230
- IRR
- 26.5%
- Equity multiple
- 3.92×
- Total profit
- $1,022,047
- Equity at exit
- $107,991
Cash invested: $349,720 (down + closing). Projections, not guarantees.
Landlord ↔ Tenant lean methodology
- Overall (STATE)
- 21 Tenant-Leaning
- State New Jersey
- 21 Tenant-Leaning · D+6
- County
- — inherits STATE
- City
- — inherits STATE
ZIP-level market 08406
- Home prices YoY
- -33.3%
- Rents YoY
- 57.3%
- Active inventory
- 155
- Price-to-rent
- 5.9×
Monthly cashflow live
- Estimated rent
- $17,783 medium interval (Pro) →
- Mortgage (P&I)
- −$6,550
- Tax est. 1.5%
- −$1,561 /mo · $18,735/yr
- Insurance
- −$520
- Flood insurance flood zone
- −$427 /mo · $5,118/yr
- HOA
- −$0
- Vacancy / Maint / Mgmt
- −$3,734
- Net cashflow
- $4,991
Break-even live
UW: 25.0% down · 7.5% · 30yr · 1.5% tax · 5.0% vac · 8.0% maint · 8.0% mgmt
Financing live
Cash to close
- Down payment
- $312,250
- Closing costs
- $37,470
- Reserves months
- —
- Total cash needed
- —
Loan-product check · same deal, 3 products live
Conventional
25% down · 7.5% · 30yr
- Down + closing
- —
- Monthly P&I
- —
- Monthly cashflow
- —
- DSCR
- —
- Eligible?
- —
Personal DTI + credit; lowest rate.
DSCR
20% down · 8.5% · 30yr
- Down + closing
- —
- Monthly P&I
- —
- Monthly cashflow
- —
- DSCR
- —
- Eligible?
- —
No personal income docs; deal must DSCR.
Hard money
10% down · 12.0% · 12mo
- Down + closing
- —
- Monthly P&I
- —
- Monthly cashflow
- —
- DSCR
- —
- Eligible?
- —
Short-term bridge; refi at stabilization.
Rent comps 7 comps
| Address | Beds | Baths | Sqft | Rent | $/sqft | DOM | Units | Dist |
|---|---|---|---|---|---|---|---|---|
| 129 N New Haven Ave Fl 2 (MemDay June30) Ventnor City, NJ | 3.0 | 2.5 | 2812 | $12,000 | $4.27 | 43d | 1 | 0.32mi |
| 129 N New Haven Ave Fl 2 (MemDay July 31) Ventnor City, NJ | 3.0 | 2.5 | 2812 | $35,000 | $12.45 | 43d | 1 | 0.32mi |
| 129 N New Haven Ave Fl 2 (July '26) Ventnor City, NJ | 3.0 | 2.5 | 2812 | $24,000 | $8.53 | 43d | 1 | 0.32mi |
| 129 N New Haven Ave Fl 2 (June '26) Ventnor City, NJ | 3.0 | 2.5 | 2812 | $9,000 | $3.20 | 43d | 1 | 0.32mi |
| 129 N New Haven Ave #2 Ventnor City, NJ | 3.0 | 2.5 | 2812 | $21,000 | $7.47 | 21d | 1 | 0.32mi |
| 208 N Surrey Ave Ventnor City, NJ | 3.0 | 2.5 | 2672 | $50,000 | $18.71 | 43d | 1 | 0.86mi |
| 1 N Austin Ave Unit 1308998P Ventnor City, NJ | 3.0 | 3.0 | 2195 | $7,184 | $3.27 | 21d | 1 | 1.28mi |
Listing history 17 events
-
2026-06-19days on market $1,249,000 Active 42 DOM
-
2026-06-18days on market $1,249,000 Active 41 DOM
-
2026-06-17days on market $1,249,000 Active 40 DOM
-
2026-06-16days on market $1,249,000 Active 39 DOM
-
2026-06-15days on market $1,249,000 Active 38 DOM
-
2026-06-14days on market $1,249,000 Active 36 DOM
-
2026-06-13days on market $1,249,000 Active 35 DOM
-
2026-06-10days on market $1,249,000 Active 33 DOM
-
2026-06-09days on market $1,249,000 Active 32 DOM
-
2026-06-08days on market $1,249,000 Active 31 DOM
-
2026-06-07days on market $1,249,000 Active 30 DOM
-
2026-06-03days on market $1,249,000 Active 26 DOM
-
2026-06-02days on market $1,249,000 Active 25 DOM
-
2026-06-01days on market $1,249,000 Active 24 DOM
-
2026-05-31days on market $1,249,000 Active 23 DOM
-
2026-05-30days on market $1,249,000 Active 22 DOM
-
2026-05-08$1,249,000 Active 1061-char remark
ⓘ Source: listings_history table (triggers on properties + properties_extension) + one-shot
backfill from property_details.listing_events for pre-trigger history.
Climate risk First Street
- Flood 9/10 Extreme FEMA zone AE · 99% chance over 30 yrs
- Wildfire 2/10 Low
- Heat 8/10 Severe 7 d/yr ≥95°F today · 16 d/yr by 30 yrs out
- Wind 8/10 Severe 80% chance of damaging wind over 30 yrs
- Air quality 2/10 Low 1 unhealthy d/yr today · 2 by 30 yrs out
Nearby sold comps map
Loading sold comps map…
Walkable amenities ~0.75 mi
Loading nearby amenities…
Taxation est. · year 1
- Rental income
- $213,400
- − Mortgage interest
- −$69,963
- − Property taxes
- −$18,735
- − Insurance
- −$11,364
- − Repairs & maintenance
- −$17,072
- − Management
- −$17,072
- − Depreciation
- −$36,335
- Taxable income
- $42,860
- Est. tax owed @ 24.0%
- −$10,286
- After-tax cash flow
- $49,602/yr
For passive investors: Depreciation is non-cash, so a rental often shows a tax loss while cash-flowing — sheltering income. Rental losses are passive: they offset passive income freely, and up to $25,000/yr can offset ordinary (W-2) income if you actively participate and your MAGI is under $100k (phasing out to $0 by $150k); unused losses carry forward. On sale, claimed depreciation is recaptured at up to 25%, and gains may owe capital-gains tax (a 1031 exchange can defer both). Figures are a year-1 estimate at your 24.0% rate — not tax advice; consult a CPA.
Condition & rehab AI · 12 photos
This renovated Ventnor duplex is move-in ready with modern interiors and a great location. Ideal for year-round or seasonal rentals.
Value-add opportunities
- Both Paint exterior siding — Enhances curb appeal and value
- Both Replace window treatments — Modernizes look and improves energy efficiency
- Both Install smart home devices — Enhances convenience and marketability
Renovation cost estimate screening
Value-add ROI direction
- Both Paint exterior siding — Enhances curb appeal and value ↑
- Both Replace window treatments — Modernizes look and improves energy efficiency ↑
- Both Install smart home devices — Enhances convenience and marketability ↑
ⓘ Cost ranges are severity-bucket heuristics (US national rule-of-thumb). Get contractor quotes + a written scope before underwriting a rehab budget.
Schools (NCES district)
- District
- Ventnor City School District
- NCES district ID
- 3416680
- Math proficiency
- 27% ▼ -18.00%
- Reading proficiency
- 49% ▼ -7.00%
- Median HH income
- $52,220
- Composite
- 32.96/100
- National rank
- #5588
- State rank
- #266 of 472 in NJ
Livability — Ventnor City
- Score
- 72/100
- State rank
- #202
- US rank
- #5716
Category grades
Schools grade is shown separately in the Schools card above.
Census & demographics
- Census place
- Ventnor City, NJ
- County
- Atlantic County · 143,611 people
- City population
- 8,972
- Metro
- Atlantic City-Hammonton, NJ
- Population (ZIP)
- 8,972
- Household income
- $69,099
- Rent vs Own
- Severe rent burden
- 329.0
Population outlook (Atlantic County) Hauer SSP2
- Today (2025)
- 268,948 people
- By 2030
- 264,497 · -1.7%
- By 2040
- 252,261 · -6.2%
- By 2050
- 237,846 · -11.6%
- By 2075
- 210,650 · -21.7%
- By 2100
- 180,234 · -33.0%
Race, ethnicity, and origin ACS 2023
- Neighborhood character
- Predominantly White (70%)
- Race & ethnicity
- White 70% Hispanic / Latino 15% Asian 9% Two or more races 9% Black 2%
- Hispanic origin (detail)
- Mexican 3% Puerto Rican 4% Dominican 1%
- Common ancestry
- Romanian 4% Scotch-Irish 3% Iranian 2%
- Foreign-born
- 21% · Canada, Jamaica, Vietnam
- Languages at home
- 76% English-only · Spanish 10% Other Indo-European 5% Vietnamese 3%
Political lean MEDSL · Atlantic
- 2024 margin
- Toss-up / Even · D 47.7% · R 50.7% · Other 1.6%
- 2008→2024 swing
- -18.1pp toward R · 2008: 15.1pp · 2024: -3.0pp
- All cycles
- 2024: R+3.0 2020: D+6.7 2016: D+6.2 2012: D+17.2 2008: D+15.1
Not yet ingested
- Civics
- —
Market trends
- HPI YoY
- ▼ -223.99%
- Current HPI
- 449.3494
- Rent YoY
- ▲ 57.28%
- Metro
- Atlantic City-Hammonton, NJ
- State GDP YoY
- ▲ 2.05%
- F500 in state
- 34
Industry mix (Fortune 500 HQ in NJ)
| Industry | F500 HQs | Revenue |
|---|---|---|
| Consumer Goods | 3 | $31B |
|
||
| Pharmaceuticals | 2 | $153B |
|
||
| Technology | 2 | $21B |
|
||
| Insurance | 2 | $20B |
|
||
| Healthcare | 2 | $19B |
|
||
| Financial Services | 1 | $70B |
|
||
Price history
1 event — show timeline
- 2026-05-08 Listed $1,249,000 SJSRMLS
Cash-flow waterfall
monthlySold comps — $/sqft
last 12 mo · ≤1 miLoading sold comps…