2596 High Ridge Rd · Stamford, CT
Flood risk 6/10 · Moderate
- FEMA flood zone
- X (unshaded)
- Chance of flooding over 30 yrs
- 0.74%
- Est. flood insurance / yr
- $473 – $860
Fire risk 2/10 · Minimal
- Est. fire insurance / yr
- $829 – $1,539
Heat risk 4/10 · Minor
- Hot days now (above 99°F)
- 7 days/yr
- Hot days in 30 yrs
- 16 days/yr
Wind risk 6/10 · Moderate
- Chance of severe wind over 30 yrs
- 53.0%
Air-quality risk 4/10 · Minor
- Unhealthy air days now
- 4 days/yr
- Unhealthy air days in 30 yrs
- 7 days/yr
Risk factors via First Street. Map © Google.
Why this score? — see what drove the C grade
The composite is a weighted blend of 9 inputs, each scored 0–100. Each bar is that input's sub-score; the figure is the points it added to the 100-point composite (weight × sub-score).
- Cash flow +23.3/30.0
- ARV discount +9.2/15.0
- DSCR +7.5/10.0
- 1% rule +5.5/10.0
- Schools +3.5/10.0
- Livability +3.5/5.0
- Rent growth +2.5/5.0
- Condition / age +2.5/5.0
- Appreciation +0.0/10.0
$1,000,000
🖨 Deal sheet 📄 Offer letter ✓ Due diligence
Listing remarks MLS
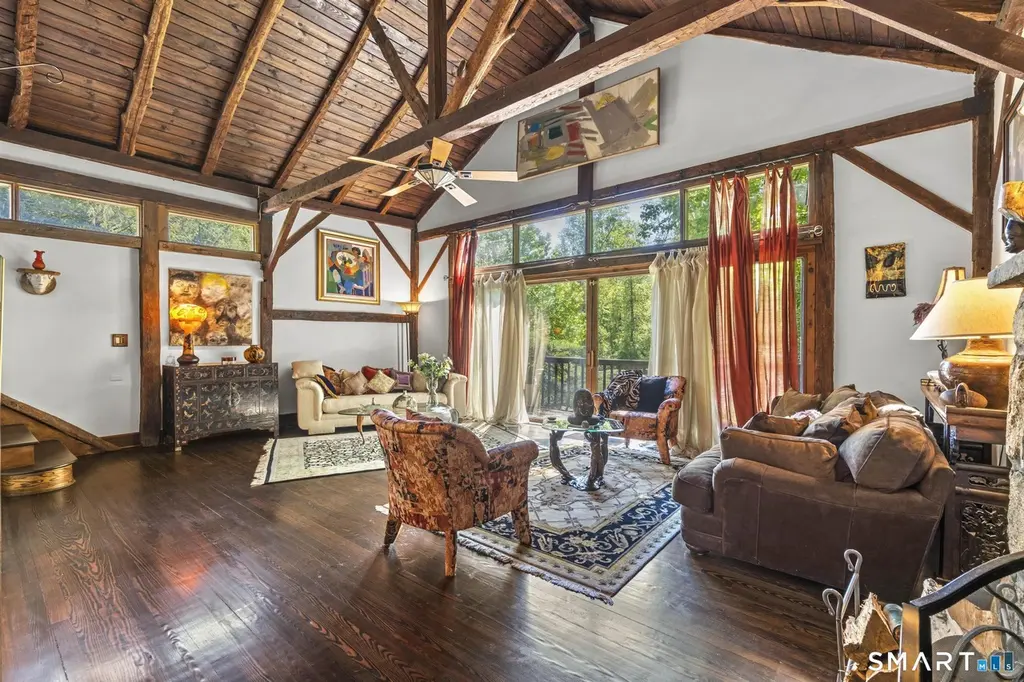
Built In 1850, Owner Architech Incorp. Orig Structure Into Charming Country Home. Original Stone Fireplace. Vaulted Ceilings. Great Room Overlooks Glorious Acre & Pond.An Interesting & Unique Home W/ 4 Br's And 3 Baths.
Key facts
- 1 acre lot
- 2 garage spots
- Built 1850
Property features AI
Exterior
- Parking: Attached 2-car garage
- Utilities: Private well water; Septic sewage system; Electric power with above-ground fuel tank for oil
- Home design: Single-family home; Brown exterior siding (clapboard/wood)
- Construction: Frame construction; Asphalt shingle roof; Slab and stone foundation
- Exterior features: Wrap-around deck; Grill; Shed; Garden area; Stone wall; Professionally landscaped grounds; Treed, level to rolling terrain with some wetlands; Water view with pond access; Direct waterfront
Interior
- Kitchen: Electric range; Refrigerator; Dishwasher
- Bedrooms: 4 bedrooms
- Bathrooms: 2 full bathrooms; 1 half bathroom
- Heating & cooling: Central air conditioning; Hot air and radiator heating with zoned controls; Oil and electric heat fuel; 80-gallon electric hot water tank
- Interior features: 9 total rooms; Breezeway; Foyer; One fireplace; Has attic with finished, heated storage and walk-up access; No basement
- Laundry & utility: Washer and dryer included; Laundry on upper level
Neighborhood map
What this means for you Summary
Snapshot
- This is a 4-bed/2.5-bath single-family listed at $1.00M.
Deal economics
- At list price, monthly cash flow is $2k ($22k/yr) — positive.
- The deal already cash-flows at list — no discount required.
- Meets the 1% rule at list price ($11k rent vs $1.00M).
- Recommended offer: $985k (1.5% below list) — sets the bar for market timing.
- Cap rate 8.5% vs local median 3.0% in Stamford — top-decile yield for the area; either an underpriced asset or a hidden risk that comps aren't pricing in. Stress-test before assuming the spread holds.
Location & tenants
- Location reads 70/100 on livability (#98 in CT) — a middle-class / working-renter tenant base. Strengths: employment A+, health & safety A+, crime A-; Watch: amenities F, commute F, cost of living F.
- Stamford School District (urban): math 32% / reading 43% proficiency, ranked #103 of 153 in CT (top 67%) — families likely to look elsewhere, expect single-tenant / working-renter base with shorter leases.
- Zoned schools: Northeast School (math 40% / reading 39%, grade F, #298 of 553 statewide, top 56%, 495 students, 40% FRL); Westhill High School (math 33% / reading 50%, grade F, #102 of 194 statewide, top 53%, 2,265 students, 50% FRL) — zoned schools at 45% FRL track the district average.
- Market conditions: 73 active listings in the ZIP; 2 comparable units currently listed for rent nearby; 1,151 units permitted in Western Connecticut Planning Region in 2024 (714 in 5+ unit buildings).
Forward outlook
- Local home prices are declining (-3.0%/yr); year-one equity from $7k of loan paydown is wiped out by about $30k of value loss. Plan a longer hold.
Negotiation context
- It's been on market 23 days — a 2% lower offer ($985k) is reasonable based on typical stale-listing flexibility.
- 5 sale attempts since 30y ago; this cycle's ask is 25% above the opening price — seller raised mid-cycle; expect resistance to lowballs.
- Current owner paid $380k; list at $1.00M implies a 163% gain — meaningful room to come down on a strong offer.
Risks & watch-outs
- Watch-outs: built in 1850 — expect roof / HVAC / electrical / plumbing capex.
- Climate carrying-cost: major flood risk; major wind risk, 53% chance of damaging wind over 30y — expect insurance premiums to compound above CPI over the hold.
Questions for the listing agent
- Built in 1850 — when were the roof, HVAC, electrical panel, plumbing, and water heater last replaced?
- Is there a deadline driving the sale (1031 exchange, divorce, estate, relocation)? That informs how much negotiation room exists.
- Schools are B-rated — typically a magnet for longer-tenancy family renters. What's the average tenant stay here, and is there a school-zone premium baked into asking?
- What's the average days-on-market for RENTAL listings here right now (not sales)? A rising rental-DOM trend means longer vacancies and softer asking-rent achievability than the comps imply.
- What's the recent tenant-quality profile in this submarket — average credit score on applications, eviction rate, late-payment / NSF rate, and stable-employment percentage? A property-management company in the area should have these aggregated.
- How much new for-sale + rental construction is in the pipeline within 1–3 miles? Heavy new supply typically softens prices + rents 12–24 months out; constrained supply supports both.
Investment metrics
- 1% rule
- 1.05% ✓
- Cap rate
- 8.50%
- Cash-on-cash
- 7.87%
- DSCR
- 1.35
- GRM
- 7.9
CMA / ARV
- ARV (on-the-fly)
- $1,039,640
- Comps found
- 12
Show comp detail 12 sales within ~0.75 mi
| Address | Dist | Beds/Ba | Sqft | Sold | Price | $/sf | Match |
|---|---|---|---|---|---|---|---|
| 2735 High Ridge Rd | 0.33mi | 4/2.5 | 3,142 (-1%) | 11mo | $1,115,000 | $355 | 75 |
| 49 Alexandra Dr | 0.08mi | 3/3.5 (-1) | 3,436 (+9%) | 6mo | $1,130,000 | $329 | 68 |
| 43 Settlers Trl | 0.41mi | 4/2.5 | 3,376 (+7%) | 12mo | $1,075,000 | $318 | 59 |
| 177 Briar Brae Rd | 0.46mi | 4/3.0 | 3,080 (-2%) | 16mo | $900,000 | $292 | 59 |
| 27 Briar Brae Rd | 0.17mi | 3/2.0 (-1) | 2,696 (-15%) | 7mo | $835,000 | $310 | 55 |
| 288 Briar Brae Rd | 0.57mi | 5/3.5 (+1) | 3,175 (+0%) | 13mo | $1,550,288 | $488 | 53 |
| 196 West Trl | 0.38mi | 4/3.5 | 3,530 (+12%) | 11mo | $1,145,000 | $324 | 50 |
| 258 Ingleside Dr | 0.50mi | 4/4.5 | 3,376 (+7%) | 18mo | $1,023,000 | $303 | 42 |
| 61 Shady Ln | 0.54mi | 5/4.5 (+1) | 2,866 (-9%) | 5mo | $900,000 | $314 | 42 |
| 65 McIntosh Rd | 0.72mi | 3/3.0 (-1) | 3,500 (+11%) | 6mo | $1,165,000 | $333 | 37 |
| 32 Round Lake Rd | 0.70mi | 3/3.0 (-1) | 2,737 (-13%) | 11mo | $1,260,000 | $460 | 29 |
| 116 Apple Valley Rd | 0.64mi | 5/3.5 (+1) | 3,576 (+13%) | 13mo | $1,220,000 | $341 | 28 |
Match score weights: distance 35% · size 25% · config 20% · recency 20%. Top-matched comps best support the ARV.
Projected returns pro-forma
-3.0% appreciation · 3.0% rent growth · sell at horizon
- IRR
- -4.3%
- Equity multiple
- 0.84×
- Total profit
- $-45,193
- Equity at exit
- $149,103
- IRR
- 5.4%
- Equity multiple
- 1.40×
- Total profit
- $110,837
- Equity at exit
- $86,462
Cash invested: $280,000 (down + closing). Projections, not guarantees.
Landlord ↔ Tenant lean methodology
- Overall (STATE)
- 27 Tenant-Leaning
- State Connecticut
- 27 Tenant-Leaning · D+7
- County
- — inherits STATE
- City
- — inherits STATE
ZIP-level market 06903
- Active inventory
- 73
- Price-to-rent
- 7.9×
Monthly cashflow live
- Estimated rent
- $10,542 medium interval (Pro) →
- Mortgage (P&I)
- −$5,244
- Tax from tax record
- −$831 /mo · $9,971/yr
- Insurance
- −$417
- HOA
- −$0
- Vacancy / Maint / Mgmt
- −$2,214
- Net cashflow
- $1,836
Break-even live
UW: 25.0% down · 7.5% · 30yr · 1.5% tax · 5.0% vac · 8.0% maint · 8.0% mgmt
Financing live
Cash to close
- Down payment
- $250,000
- Closing costs
- $30,000
- Reserves months
- —
- Total cash needed
- —
Loan-product check · same deal, 3 products live
Conventional
25% down · 7.5% · 30yr
- Down + closing
- —
- Monthly P&I
- —
- Monthly cashflow
- —
- DSCR
- —
- Eligible?
- —
Personal DTI + credit; lowest rate.
DSCR
20% down · 8.5% · 30yr
- Down + closing
- —
- Monthly P&I
- —
- Monthly cashflow
- —
- DSCR
- —
- Eligible?
- —
No personal income docs; deal must DSCR.
Hard money
10% down · 12.0% · 12mo
- Down + closing
- —
- Monthly P&I
- —
- Monthly cashflow
- —
- DSCR
- —
- Eligible?
- —
Short-term bridge; refi at stabilization.
Rent comps 2 comps
| Address | Beds | Baths | Sqft | Rent | $/sqft | DOM | Units | Dist |
|---|---|---|---|---|---|---|---|---|
| 950 Rock Rimmon Rd Stamford, CT | 5.0 | 4.0 | 3956 | $7,900 | $2.00 | 24d | 1 | 1.21mi |
| 117 Tobys Ln New Canaan, CT | 3.0 | 3.0 | 2897 | $13,000 | $4.49 | 3d | 1 | 1.29mi |
Listing history 27 events
-
2026-06-18days on market $1,000,000 Active 23 DOM
-
2026-06-17days on market $1,000,000 Active 22 DOM
-
2026-06-16days on market $1,000,000 Active 21 DOM
-
2026-06-15days on market $1,000,000 Active 20 DOM
-
2026-06-13days on market $1,000,000 Active 18 DOM
-
2026-06-13days on market $1,000,000 Active 17 DOM
-
2026-06-10days on market $1,000,000 Active 15 DOM
-
2026-06-09days on market $1,000,000 Active 14 DOM
-
2026-06-08days on market $1,000,000 Active 13 DOM
-
2026-06-07days on market $1,000,000 Active 12 DOM
-
2026-06-05days on market $1,000,000 Active 9 DOM
-
2026-06-03days on market $1,000,000 Active 8 DOM
-
2026-06-03days on market $1,000,000 Active 7 DOM
-
2026-06-01days on market $1,000,000 Active 6 DOM
-
2026-05-31days on market $1,000,000 Active 5 DOM
-
2026-05-23historical $1,000,000
-
2012-12-24historical
-
2012-05-17$799,000
-
2000-02-25soldstatus $380,000 232-char remark
Show marketing remark (232 chars)
Built In 1850, Owner Architech Incorp. Orig Structure Into Charming Country Home. Original Stone Fireplace. Vaulted Ceilings. Great Room Overlooks Glorious Acre & Pond.An Interesting & Unique Home W/ 4 Br's And 3 Baths.
-
2000-02-25soldstatus $388,000
Show marketing remark (232 chars)
Built In 1850, Owner Architech Incorp. Orig Structure Into Charming Country Home. Original Stone Fireplace. Vaulted Ceilings. Great Room Overlooks Glorious Acre & Pond.An Interesting & Unique Home W/ 4 Br's And 3 Baths.
-
1999-09-17$395,000 232-char remark
Show marketing remark (232 chars)
Built In 1850, Owner Architech Incorp. Orig Structure Into Charming Country Home. Original Stone Fireplace. Vaulted Ceilings. Great Room Overlooks Glorious Acre & Pond.An Interesting & Unique Home W/ 4 Br's And 3 Baths.
-
1997-07-30historical
-
1997-05-08historical
-
1997-05-03$325,000
-
1997-04-08$349,000
-
1997-04-07historical
-
1996-10-07$349,000
ⓘ Source: listings_history table (triggers on properties + properties_extension) + one-shot
backfill from property_details.listing_events for pre-trigger history.
Tax reassessment forecast CT · Partial reset (capped growth)
- Current annual tax
- $9,971 · $831/mo
- Projected year-2 tax
- $15,686 · $1,307/mo
- Expected delta
- +$5,714/yr (+$476/mo · 57.3%)
ⓘ Screening estimate from a state-policy table — verify with the county assessor before closing.
Climate risk First Street
- Flood 6/10 Major FEMA zone X (unshaded) · 74% chance over 30 yrs
- Wildfire 2/10 Low
- Heat 4/10 Moderate 7 d/yr ≥99°F today · 16 d/yr by 30 yrs out
- Wind 6/10 Major 53% chance of damaging wind over 30 yrs
- Air quality 4/10 Moderate 4 unhealthy d/yr today · 7 by 30 yrs out
Nearby sold comps map
Loading sold comps map…
Walkable amenities ~0.75 mi
Loading nearby amenities…
Taxation est. · year 1
- Rental income
- $126,500
- − Mortgage interest
- −$56,016
- − Property taxes
- −$9,971
- − Insurance
- −$5,000
- − Repairs & maintenance
- −$10,120
- − Management
- −$10,120
- − Depreciation
- −$29,091
- Taxable income
- $6,182
- Est. tax owed @ 24.0%
- −$1,484
- After-tax cash flow
- $20,551/yr
For passive investors: Depreciation is non-cash, so a rental often shows a tax loss while cash-flowing — sheltering income. Rental losses are passive: they offset passive income freely, and up to $25,000/yr can offset ordinary (W-2) income if you actively participate and your MAGI is under $100k (phasing out to $0 by $150k); unused losses carry forward. On sale, claimed depreciation is recaptured at up to 25%, and gains may owe capital-gains tax (a 1031 exchange can defer both). Figures are a year-1 estimate at your 24.0% rate — not tax advice; consult a CPA.
Schools (NCES district)
- District
- Stamford School District
- NCES district ID
- 0904320
- Math proficiency
- 32% ▼ -10.00%
- Reading proficiency
- 43% ▼ -7.00%
- Median HH income
- $78,843
- Composite
- 35.14/100
- National rank
- #5010
- State rank
- #103 of 153 in CT
Livability — Stamford
- Score
- 70/100
- State rank
- #98
- US rank
- #7716
Category grades
Schools grade is shown separately in the Schools card above.
Census & demographics
- Census place
- Stamford, CT
- City population
- 123,058
- Population (ZIP)
- 13,630
Population outlook (Western Connecticut County) Hauer SSP2
- By 2040
- 685,031
Race, ethnicity, and origin ACS 2023
- Neighborhood character
- Predominantly White (74%)
- Race & ethnicity
- White 74% Two or more races 11% Hispanic / Latino 9% Black 6% Asian 6%
- Hispanic origin (detail)
- Cuban 1%
- Common ancestry
- Romanian 6% Scotch-Irish 4% Italian 2%
- Foreign-born
- 18% · Canada, China, Dominican Republic
- Languages at home
- 78% English-only · Other Indo-European 6% Spanish 5% Russian/Polish/Slavic 4%
Political lean MEDSL · Western Connecticut
- 2024 margin
- D (+19.1) · D 58.8% · R 39.7% · Other 1.6%
- All cycles
- 2024: D+19.1
Not yet ingested
- Civics
- —
Market trends
- HPI YoY
- ▼ -247.05%
- Current HPI
- 163.3073
- Rent YoY
- —
- Metro
- —
- State GDP YoY
- ▲ 1.06%
- F500 in state
- 38
Industry mix (Fortune 500 HQ in CT)
| Industry | F500 HQs | Revenue |
|---|---|---|
| Industrial Machinery | 4 | $38B |
|
||
| Insurance | 3 | $71B |
|
||
| Financial Services | 2 | $25B |
|
||
| Transportation / Logistics | 2 | $18B |
|
||
| Healthcare | 1 | $247B |
|
||
| Telecommunications | 1 | $55B |
|
||
Price history
+186.5% since first listed12 events — show timeline
- 2026-05-23 Coming Soon $1,000,000 Smart MLS
- 2012-12-24 Listing Removed — Smart MLS
- 2012-05-17 Listed $799,000 Smart MLS
- 2000-02-25 Sold (Public Records) $388,000 Public Records
- 2000-02-25 Sold (MLS) $380,000 Smart MLS
- 1999-09-17 Listed $395,000 Smart MLS
- 1997-07-30 Listing Removed — Smart MLS
- 1997-05-08 Listing Removed — Smart MLS
- 1997-05-03 Listed $325,000 Smart MLS
- 1997-04-08 Listed $349,000 Smart MLS
- 1997-04-07 Listing Removed — Smart MLS
- 1996-10-07 Listed $349,000 Smart MLS
Property tax history
+1.8%/yrLatest (2022): $9,971 · +1.4% YoY. Source: county tax records.
Cash-flow waterfall
monthlySold comps — $/sqft
last 12 mo · ≤1 miLoading sold comps…