 🏗️ New Construction
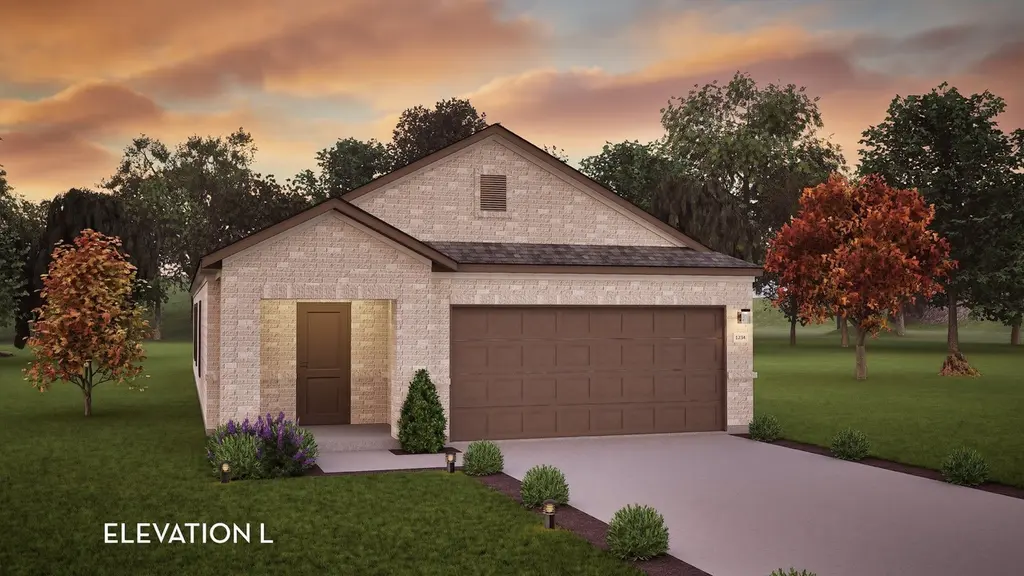
Pecan Plan · Pinehurst, TX
Flood risk No data
- FEMA flood zone
- —
- Chance of flooding over 30 yrs
- —
- Est. flood insurance / yr
- —
Fire risk No data
- Est. fire insurance / yr
- —
Heat risk No data
- Hot days now (above threshold)
- —
- Hot days in 30 yrs
- —
Wind risk No data
- Chance of severe wind over 30 yrs
- —
Air-quality risk No data
- Unhealthy air days now
- —
- Unhealthy air days in 30 yrs
- —
Risk factors via First Street. Map © Google.
Why this score? — see what drove the F grade
The composite is a weighted blend of 9 inputs, each scored 0–100. Each bar is that input's sub-score; the figure is the points it added to the 100-point composite (weight × sub-score).
- Cash flow +7.7/30.0
- ARV discount +7.5/15.0
- Condition / age +4.0/5.0
- Schools +3.9/10.0
- Livability +2.8/5.0
- Rent growth +2.5/5.0
- 1% rule +2.3/10.0
- DSCR +1.8/10.0
- Appreciation +0.0/10.0
$244,990
🖨 Deal sheet 📄 Offer letter ✓ Due diligence
Listing remarks MLS
With enough space for the whole family, the Pecan floor plan will not disappoint. Upon entering your new home, you are greeted by a foyer area that is equipped with your convenient utility room, storage closet, and an entrance to your two-car garage. Needing more storage for tools, holiday decorations, or another car? Decide to upgrade to a two-and-a-half-car garage or even a three-car garage! Travel down the hallway where you are met with your expansive family room and dining room combination - perfect for entertaining guests for dinner parties, holidays, or any other occasion! Right off the living room lies your secondary and third bedrooms with the full secondary bathroom residing in between the two bedrooms. Past the dining area is your spacious kitchen area complete with access to your pantry, and contains sleek granite countertops, flat-panel birch cabinets, industry-leading appliances, and designer light fixtures that is sure to please any eye! Leading from the kitchen is access to your backyard with the option to include an extensive covered patio for you to enjoy backyard barbecues on. When it's time to rest, head over to your private master suite. Your master bathroom boasts cultured marble countertops, a large super shower, and a huge walk-in closet! The Pecan plan is perfect for most any lifestyle, no matter what phase of life you are in. Each CastleRock home is Energy Star Certified and is built with energy-efficient features that help keep you comfortable. ..
Key facts
- Storage closet
- Powder room
- Two car garage
Tags
Neighborhood map
What this means for you Summary
Snapshot
- This is a 3-bed/2.0-bath single-family listed at $245k. Condition is rated good.
Deal economics
- At list price, monthly cash flow is $-320 ($-4k/yr) — negative.
- To cash-flow at today's rent, offer at most $229k (6.7% below list).
- To meet the 1% rule (rent ≥ 1% of price), the offer needs to be $200k (18.4% below list).
- Recommended offer: $200k (18.4% below list) — sets the bar for 1% rule.
- Cap rate 4.9% vs local median 2.0% in Pinehurst — top-decile yield for the area; either an underpriced asset or a hidden risk that comps aren't pricing in. Stress-test before assuming the spread holds.
Location & tenants
- Location reads 55/100 on livability (#1,350 in TX) — a working-class tenant base; expect higher turnover. Strengths: cost of living A+, housing B+; Watch: employment C-, schools F, crime D-.
- Magnolia ISD (rural): math 42% / reading 45% proficiency, ranked #247 of 826 in TX (top 30%) — families likely to look elsewhere, expect single-tenant / working-renter base with shorter leases.
- Market conditions: 170 active listings in the ZIP; 1 comparable units currently listed for rent nearby; 13,259 units permitted in Montgomery County in 2024 (1,402 in 5+ unit buildings).
Forward outlook
- Local home prices are declining (-3.0%/yr); year-one equity from $2k of loan paydown is wiped out by about $8k of value loss. Plan a longer hold.
- Montgomery County population projected at +65% by 2050 — long-run rental-demand tailwind backs the buy-and-hold thesis.
Negotiation context
- It's been on market 443 days — a 12% lower offer ($216k) is reasonable based on typical stale-listing flexibility.
Questions for the listing agent
- What do current leases actually rent for vs. the listed asking? Can we see a recent rent roll and the last 12 months of T-12 income?
- It's been on market 443 days. Have you received any prior offers? Is the seller open to a 18% concession, seller financing, or rate buy-down credit?
- Why hasn't it sold? Are there any deal-killer items the seller is aware of (foundation, flood, title, zoning, code violations)?
- Is there a deadline driving the sale (1031 exchange, divorce, estate, relocation)? That informs how much negotiation room exists.
- Schools are F-rated, which usually means shorter tenancies and higher turnover. Who's the typical renter profile here, and what's been the actual vacancy rate?
- Crime grade is D in this area — have there been break-ins, vandalism, or insurance claims at this property in the last 3 years? What carrier currently insures it and at what premium?
- The area grade is low — what's the realistic commute time and amenity access for the typical tenant pool here? Any planned neighborhood developments (good or bad) we should know about?
- What's the average days-on-market for RENTAL listings here right now (not sales)? A rising rental-DOM trend means longer vacancies and softer asking-rent achievability than the comps imply.
- What's the recent tenant-quality profile in this submarket — average credit score on applications, eviction rate, late-payment / NSF rate, and stable-employment percentage? A property-management company in the area should have these aggregated.
- How much new for-sale + rental construction is in the pipeline within 1–3 miles? Heavy new supply typically softens prices + rents 12–24 months out; constrained supply supports both.
Investment metrics
- 1% rule
- 0.73% ✗
- Cap rate
- 4.90%
- Cash-on-cash
- -4.99%
- DSCR
- 0.78
- GRM
- 11.5
CMA / ARV
- ARV (median comp)
- $274,926
- List price
- $244,990
- Delta
- -10.89%
- Verdict
- UNDERPRICED
- Comps
- 20 within 1.0 mi
Show comp detail 12 sales within ~0.75 mi
| Address | Dist | Beds/Ba | Sqft | Sold | Price | $/sf | Match |
|---|---|---|---|---|---|---|---|
| 4016 Colony River Rock Blvd | 0.02mi | 3/2.0 | 1,635 (+4%) | 2mo | $249,990 | $153 | 91 |
| 3007 Wicker Ln | 0.22mi | 3/2.0 | 1,641 (+4%) | 5mo | $259,990 | $158 | 78 |
| 4350 Maple Root Ln | 0.34mi | 3/2.5 | 1,570 (0%) | 8mo | $276,310 | $176 | 75 |
| 4558 Pinehurst Trace Dr | 0.43mi | 3/2.0 | 1,518 (-3%) | 2mo | $246,990 | $163 | 73 |
| 4225 Red Cedar Ring Ln | 0.24mi | 3/2.0 | 1,465 (-7%) | 8mo | $259,990 | $177 | 71 |
| 4407 Azalea Blossom Rd | 0.35mi | 3/2.0 | 1,518 (-3%) | 10mo | $249,990 | $165 | 70 |
| 4322 Maple Root Ln | 0.32mi | 3/2.0 | 1,518 (-3%) | 12mo | $243,990 | $161 | 70 |
| 2971 Colonia Blossom Ln | 0.28mi | 3/2.0 | 1,395 (-11%) | 4mo | $245,990 | $176 | 65 |
| 4519 Pinehurst Trace Dr | 0.40mi | 3/2.0 | 1,395 (-11%) | 3mo | $234,990 | $168 | 60 |
| 4515 Pinehurst Trace Dr | 0.41mi | 3/2.5 | 1,768 (+13%) | 2mo | $277,990 | $157 | 56 |
| 4418 Azalea Blossom Rd | 0.37mi | 3/2.5 | 1,768 (+13%) | 5mo | $264,990 | $150 | 56 |
| 4426 Azalea Blossom Rd | 0.37mi | 3/2.0 | 1,395 (-11%) | 10mo | $234,990 | $168 | 56 |
Match score weights: distance 35% · size 25% · config 20% · recency 20%. Top-matched comps best support the ARV.
Projected returns pro-forma
-3.0% appreciation · 3.0% rent growth · sell at horizon
- IRR
- -24.8%
- Equity multiple
- 0.16×
- Total profit
- $-64,898
- Equity at exit
- $40,992
- IRR
- -20.5%
- Equity multiple
- -0.07×
- Total profit
- $-82,629
- Equity at exit
- $23,771
Cash invested: $76,979 (down + closing). Projections, not guarantees.
Landlord ↔ Tenant lean methodology
- Overall (STATE)
- 87 Strongly Landlord-Friendly
- State Texas
- 87 Strongly Landlord-Friendly · R+5
- County
- — inherits STATE
- City
- — inherits STATE
ZIP-level market 77362
- Home prices YoY
- -29.1%
- Active inventory
- 170
- Price-to-rent
- 10.2×
Monthly cashflow live
- Estimated rent
- $2,000 medium interval (Pro) →
- Mortgage (P&I)
- −$1,442
- Tax est. 1.5%
- −$344 /mo · $4,124/yr
- Insurance
- −$115
- HOA
- −$0
- Vacancy / Maint / Mgmt
- −$420
- Net cashflow
- $-320
Break-even live
UW: 25.0% down · 7.5% · 30yr · 1.5% tax · 5.0% vac · 8.0% maint · 8.0% mgmt
Financing live
Cash to close
- Down payment
- $68,731
- Closing costs
- $8,248
- Reserves months
- —
- Total cash needed
- —
Loan-product check · same deal, 3 products live
Conventional
25% down · 7.5% · 30yr
- Down + closing
- —
- Monthly P&I
- —
- Monthly cashflow
- —
- DSCR
- —
- Eligible?
- —
Personal DTI + credit; lowest rate.
DSCR
20% down · 8.5% · 30yr
- Down + closing
- —
- Monthly P&I
- —
- Monthly cashflow
- —
- DSCR
- —
- Eligible?
- —
No personal income docs; deal must DSCR.
Hard money
10% down · 12.0% · 12mo
- Down + closing
- —
- Monthly P&I
- —
- Monthly cashflow
- —
- DSCR
- —
- Eligible?
- —
Short-term bridge; refi at stabilization.
Rent comps 1 comps
| Address | Beds | Baths | Sqft | Rent | $/sqft | DOM | Units | Dist |
|---|---|---|---|---|---|---|---|---|
| 4311 Maple Root Ln Pinehurst, TX | 3.0 | 2.0 | 1500 | $2,000 | $1.33 | 44d | 1 | 0.29mi |
Listing history 14 events
-
2026-06-18days on market $244,990 Active 443 DOM
-
2026-06-17days on market $244,990 Active 442 DOM
-
2026-06-16days on market $244,990 Active 441 DOM
-
2026-06-15days on market $244,990 Active 440 DOM
-
2026-06-13days on market $244,990 Active 438 DOM
-
2026-06-09days on market $244,990 Active 434 DOM
-
2026-06-08days on market $244,990 Active 433 DOM
-
2026-06-07days on market $244,990 Active 432 DOM
-
2026-06-04days on market $244,990 Active 429 DOM
-
2026-06-03days on market $244,990 Active 428 DOM
-
2026-06-02days on market $244,990 Active 427 DOM
-
2026-06-01days on market $244,990 Active 426 DOM
-
2026-05-31days on market $244,990 Active 425 DOM
-
2025-04-01$244,990 Active 1497-char remark
Show marketing remark (1497 chars)
With enough space for the whole family, the Pecan floor plan will not disappoint. Upon entering your new home, you are greeted by a foyer area that is equipped with your convenient utility room, storage closet, and an entrance to your two-car garage. Needing more storage for tools, holiday decorations, or another car? Decide to upgrade to a two-and-a-half-car garage or even a three-car garage! Travel down the hallway where you are met with your expansive family room and dining room combination - perfect for entertaining guests for dinner parties, holidays, or any other occasion! Right off the living room lies your secondary and third bedrooms with the full secondary bathroom residing in between the two bedrooms. Past the dining area is your spacious kitchen area complete with access to your pantry, and contains sleek granite countertops, flat-panel birch cabinets, industry-leading appliances, and designer light fixtures that is sure to please any eye! Leading from the kitchen is access to your backyard with the option to include an extensive covered patio for you to enjoy backyard barbecues on. When it's time to rest, head over to your private master suite. Your master bathroom boasts cultured marble countertops, a large super shower, and a huge walk-in closet! The Pecan plan is perfect for most any lifestyle, no matter what phase of life you are in. Each CastleRock home is Energy Star Certified and is built with energy-efficient features that help keep you comfortable. ..
ⓘ Source: listings_history table (triggers on properties + properties_extension) + one-shot
backfill from property_details.listing_events for pre-trigger history.
Nearby sold comps map
Loading sold comps map…
Walkable amenities ~0.75 mi
Loading nearby amenities…
Taxation est. · year 1
- Rental income
- $24,000
- − Mortgage interest
- −$15,400
- − Property taxes
- −$4,124
- − Insurance
- −$1,375
- − Repairs & maintenance
- −$1,920
- − Management
- −$1,920
- − Depreciation
- −$7,998
- Taxable loss
- −$8,736
- Est. tax savings @ 24.0%
- +$2,097
- After-tax cash flow
- $-1,743/yr
For passive investors: Depreciation is non-cash, so a rental often shows a tax loss while cash-flowing — sheltering income. Rental losses are passive: they offset passive income freely, and up to $25,000/yr can offset ordinary (W-2) income if you actively participate and your MAGI is under $100k (phasing out to $0 by $150k); unused losses carry forward. On sale, claimed depreciation is recaptured at up to 25%, and gains may owe capital-gains tax (a 1031 exchange can defer both). Figures are a year-1 estimate at your 24.0% rate — not tax advice; consult a CPA.
Condition & rehab AI · 12 photos
This home is in good condition with minimal maintenance required. It offers a good balance of modern amenities and a well-maintained exterior, making it an attractive option for both resale and rental markets.
Value-add opportunities
- Resale Paint exterior trim — Enhances curb appeal and can add value
- Both Replace carpet with hardwood flooring — Improves aesthetics and increases value
- Both Install smart home features — Enhances convenience and can attract tech-savvy buyers
Renovation cost estimate screening
Value-add ROI direction
- Resale Paint exterior trim — Enhances curb appeal and can add value ↑
- Both Replace carpet with hardwood flooring — Improves aesthetics and increases value ↑
- Both Install smart home features — Enhances convenience and can attract tech-savvy buyers ↑
ⓘ Cost ranges are severity-bucket heuristics (US national rule-of-thumb). Get contractor quotes + a written scope before underwriting a rehab budget.
Schools (NCES district)
- District
- Magnolia ISD
- NCES district ID
- 4828740
- Math proficiency
- 42% ▼ -7.00%
- Reading proficiency
- 45% ▼ -4.00%
- Median HH income
- $71,692
- Composite
- 39.46/100
- National rank
- #3958
- State rank
- #247 of 826 in TX
Livability — Pinehurst
- Score
- 55/100
- State rank
- #1350
- US rank
- #23272
Category grades
Schools grade is shown separately in the Schools card above.
Census & demographics
- Census place
- Pinehurst, TX
- Population (ZIP)
- 7,474
Population outlook (Montgomery County) Hauer SSP2
- Today (2025)
- 713,896 people
- By 2030
- 805,263 · +12.8%
- By 2040
- 992,708 · +39.1%
- By 2050
- 1,179,590 · +65.2%
- By 2075
- 1,628,084 · +128.1%
- By 2100
- 1,937,880 · +171.5%
Race, ethnicity, and origin ACS 2023
- Neighborhood character
- Predominantly White (68%)
- Race & ethnicity
- White 68% Hispanic / Latino 20% Two or more races 10% Black 7% Asian 3%
- Hispanic origin (detail)
- Mexican 15%
- Common ancestry
- Lithuanian 4% Slovak 4% Serbian 2%
- Foreign-born
- 10% · Canada, Jamaica
- Languages at home
- 78% English-only · Spanish 18% Other Indo-European 2%
Political lean MEDSL · Montgomery
- 2024 margin
- Solid R (+45.5) · D 26.8% · R 72.3%
- 2008→2024 swing
- +7.2pp toward D · 2008: -52.7pp · 2024: -45.5pp
- All cycles
- 2024: R+45.5 2020: R+43.8 2016: R+51.4 2012: R+60.7 2008: R+52.7
Not yet ingested
- Civics
- —
Market trends
- HPI YoY
- ▼ -116.65%
- Current HPI
- 284.6412
- Rent YoY
- —
- Metro
- —
- State GDP YoY
- ▲ 3.95%
- F500 in state
- 110
Industry mix (Fortune 500 HQ in TX)
| Industry | F500 HQs | Revenue |
|---|---|---|
| Energy | 16 | $1,198B |
|
||
| Technology | 5 | $198B |
|
||
| Engineering / Construction | 4 | $72B |
|
||
| Energy Services | 3 | $60B |
|
||
| Utilities | 3 | $41B |
|
||
| Healthcare | 2 | $330B |
|
||
Price history
1 event — show timeline
- 2025-04-01 Listed $244,990 Zillow
Cash-flow waterfall
monthlySold comps — $/sqft
last 12 mo · ≤1 miLoading sold comps…