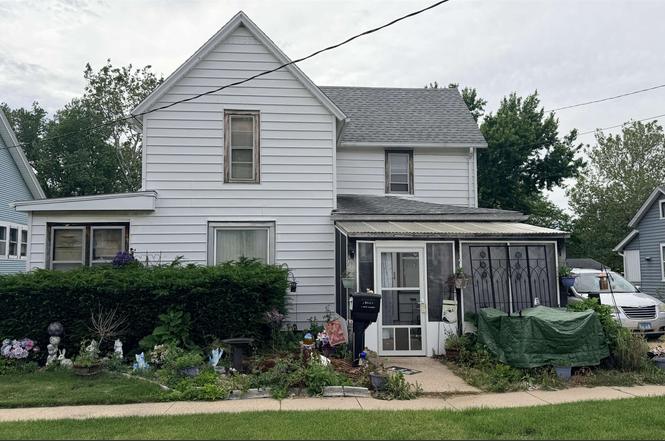
4 S Mulberry Ave · Mount Morris, IL
Flood risk 1/10 · Minimal
- FEMA flood zone
- X (unshaded)
- Chance of flooding over 30 yrs
- 0.0%
- Est. flood insurance / yr
- $507 – $1,088
Fire risk 1/10 · Minimal
- Est. fire insurance / yr
- $804 – $1,492
Heat risk 2/10 · Minimal
- Hot days now (above 101°F)
- 7 days/yr
- Hot days in 30 yrs
- 15 days/yr
Wind risk 2/10 · Minimal
- Chance of severe wind over 30 yrs
- —
Air-quality risk 3/10 · Minor
- Unhealthy air days now
- 2 days/yr
- Unhealthy air days in 30 yrs
- 3 days/yr
Risk factors via First Street. Map © Google.
Why this score? — see what drove the B grade
The composite is a weighted blend of 9 inputs, each scored 0–100. Each bar is that input's sub-score; the figure is the points it added to the 100-point composite (weight × sub-score).
- Cash flow +30.0/30.0
- ARV discount +15.0/15.0
- DSCR +10.0/10.0
- 1% rule +9.2/10.0
- Livability +3.5/5.0
- Rent growth +2.5/5.0
- Condition / age +2.5/5.0
- Schools +1.9/10.0
- Appreciation +0.0/10.0
$85,000
🖨 Deal sheet 📄 Offer letter ✓ Due diligence
Listing remarks MLS
Attention investors, landlords and homeowners! Do not miss this opportunity to own this three-bedroom one bath home in Mount Morris. Bathroom has been updated. Same owner for years! Plenty of space and protentional. Nice size yard with detached garage. TLC needed.
Key facts
- Nice size yard
- Updated bathroom
- Detached garage
Tags
Property features AI
Finance
- Other: Annual tax approximately $815
Exterior
- Parking: 1-car garage; Gravel parking
- Utilities: Public water; Public sewer
- Home design: Single-family residence (house); 2 stories
- Exterior features: Shingle roof; Lot about 0.17 acres
Interior
- Kitchen: Gas cooktop
- Bathrooms: 1 full bathroom
- Heating & cooling: Forced air heating
- Interior features: Gas cooktop; Gas water heater; Partial basement
Neighborhood map
What this means for you Summary
Snapshot
- This is a 3-bed/1.0-bath single-family listed at $85k.
Deal economics
- At list price, monthly cash flow is $409 ($5k/yr) — positive.
- The deal already cash-flows at list — no discount required.
- Meets the 1% rule at list price ($1k rent vs $85k).
Location & tenants
- Location reads 69/100 on livability (#391 in IL) — a middle-class / working-renter tenant base. Strengths: cost of living A+, housing A+, health & safety A+; Watch: amenities F, commute F, employment D-.
- Oregon CUSD 220 (town): math 20% / reading 22% proficiency, ranked #400 of 620 in IL (top 64%) — low school quality limits family demand, transient renter base, plan for 1-2y turnover.
- Zoned schools: Oregon Elem Sch (math 22% / reading 24%, grade F, #929 of 2,056 statewide, top 45%, 776 students, 0% FRL); Oregon Jr/Sr High School (math 22% / reading 22%, grade F, #319 of 693 statewide, top 50%, 663 students, 0% FRL) — zoned schools average 0% FRL vs 39% district-wide (39 pts lower); this property's tenant base skews higher-income than the district average.
- Market conditions: 13 active listings in the ZIP; 113 units permitted in Ogle County in 2024 (67 in 5+ unit buildings).
Forward outlook
- Local home prices are declining (-3.0%/yr); year-one equity from $588 of loan paydown is wiped out by about $3k of value loss. Plan a longer hold.
- Ogle County population projected at -24% by 2050 — secular population decline; favor cash flow + early exit over multi-decade hold.
- At projected returns (-3.0% appreciation + 3.0% rent growth), your $24k cash investment doubles in ~6 years — after that, you're playing with house money.
Negotiation context
- Only 3 days on market — expect competitive offers; lowballing is unlikely to land.
- 2 sale attempts with the ask held roughly flat each time — persistent listings suggest the price (not the market) is what's stuck; bring a comps-based counter.
Risks & watch-outs
- Watch-outs: built in 1925 — expect roof / HVAC / electrical / plumbing capex.
Questions for the listing agent
- Built in 1925 — when were the roof, HVAC, electrical panel, plumbing, and water heater last replaced?
- Is there a deadline driving the sale (1031 exchange, divorce, estate, relocation)? That informs how much negotiation room exists.
- Schools are F-rated, which usually means shorter tenancies and higher turnover. Who's the typical renter profile here, and what's been the actual vacancy rate?
- What's the average days-on-market for RENTAL listings here right now (not sales)? A rising rental-DOM trend means longer vacancies and softer asking-rent achievability than the comps imply.
- What's the recent tenant-quality profile in this submarket — average credit score on applications, eviction rate, late-payment / NSF rate, and stable-employment percentage? A property-management company in the area should have these aggregated.
- How much new for-sale + rental construction is in the pipeline within 1–3 miles? Heavy new supply typically softens prices + rents 12–24 months out; constrained supply supports both.
Investment metrics
- 1% rule
- 1.42% ✓
- Cap rate
- 12.06%
- Cash-on-cash
- 20.60%
- DSCR
- 1.92
- GRM
- 5.9
CMA / ARV
- ARV (on-the-fly)
- $149,144
- Comps found
- 12
Show comp detail 12 sales within ~0.75 mi
| Address | Dist | Beds/Ba | Sqft | Sold | Price | $/sf | Match |
|---|---|---|---|---|---|---|---|
| 112 N Hannah Ave | 0.33mi | 3/1.0 | 1,488 (+3%) | 4mo | $157,500 | $106 | 76 |
| 212 W Hitt St | 0.12mi | 3/1.0 | 1,300 (-10%) | 11mo | $160,000 | $123 | 68 |
| 205 E Brayton Rd | 0.48mi | 3/1.5 | 1,524 (+5%) | 0mo | $156,560 | $103 | 67 |
| 313 E Lincoln St | 0.55mi | 2/1.0 (-1) | 1,426 (-2%) | 2mo | $130,000 | $91 | 65 |
| 110 W First(sbr) St | 0.25mi | 2/1.0 (-1) | 1,330 (-8%) | 6mo | $118,000 | $89 | 65 |
| 409 Barbara St | 0.74mi | 3/2.0 | 1,456 (+1%) | 1mo | $220,000 | $151 | 60 |
| 601 W 1st St | 0.42mi | 2/1.0 (-1) | 1,344 (-7%) | 6mo | $114,900 | $85 | 58 |
| 107 E Front St | 0.34mi | 2/1.0 (-1) | 1,300 (-10%) | 11mo | $65,000 | $50 | 53 |
| 318 E Center St | 0.56mi | 3/1.0 | 1,344 (-7%) | 11mo | $140,000 | $104 | 53 |
| 502 E Brayton Rd | 0.72mi | 3/1.5 | 1,547 (+7%) | 2mo | $70,000 | $45 | 51 |
| 210 E Front St | 0.43mi | 3/1.5 | 1,640 (+13%) | 8mo | $115,000 | $70 | 50 |
| 422 N Hannah Ave | 0.55mi | 3/2.0 | 1,600 (+10%) | 15mo | $174,000 | $109 | 41 |
Match score weights: distance 35% · size 25% · config 20% · recency 20%. Top-matched comps best support the ARV.
Projected returns pro-forma
-3.0% appreciation · 3.0% rent growth · sell at horizon
- IRR
- 12.9%
- Equity multiple
- 1.51×
- Total profit
- $12,239
- Equity at exit
- $12,674
- IRR
- 21.8%
- Equity multiple
- 2.85×
- Total profit
- $44,132
- Equity at exit
- $7,349
Cash invested: $23,800 (down + closing). Projections, not guarantees.
Landlord ↔ Tenant lean methodology
- Overall (STATE)
- 43 Moderately Tenant-Leaning
- State Illinois
- 43 Moderately Tenant-Leaning · D+7
- County
- — inherits STATE
- City
- — inherits STATE
ZIP-level market 61054
- Home prices YoY
- -16.1%
- Active inventory
- 13
- Price-to-rent
- 5.9×
Monthly cashflow live
- Estimated rent
- $1,208 medium interval (Pro) →
- Mortgage (P&I)
- −$446
- Tax from tax record
- −$64 /mo · $771/yr
- Insurance
- −$35
- HOA
- −$0
- Vacancy / Maint / Mgmt
- −$254
- Net cashflow
- $409
Break-even live
UW: 25.0% down · 7.5% · 30yr · 1.5% tax · 5.0% vac · 8.0% maint · 8.0% mgmt
Financing live
Cash to close
- Down payment
- $21,250
- Closing costs
- $2,550
- Reserves months
- —
- Total cash needed
- —
Loan-product check · same deal, 3 products live
Conventional
25% down · 7.5% · 30yr
- Down + closing
- —
- Monthly P&I
- —
- Monthly cashflow
- —
- DSCR
- —
- Eligible?
- —
Personal DTI + credit; lowest rate.
DSCR
20% down · 8.5% · 30yr
- Down + closing
- —
- Monthly P&I
- —
- Monthly cashflow
- —
- DSCR
- —
- Eligible?
- —
No personal income docs; deal must DSCR.
Hard money
10% down · 12.0% · 12mo
- Down + closing
- —
- Monthly P&I
- —
- Monthly cashflow
- —
- DSCR
- —
- Eligible?
- —
Short-term bridge; refi at stabilization.
Listing history 4 events
-
2026-06-18days on market $85,000 Active 3 DOM
-
2026-06-17days on market $85,000 Active 2 DOM
-
2026-06-16remarks 267-char remark
-
2026-06-16$85,000 Active 1 DOM
ⓘ Source: listings_history table (triggers on properties + properties_extension) + one-shot
backfill from property_details.listing_events for pre-trigger history.
Tax reassessment forecast IL · Partial reset (capped growth)
- Current annual tax
- $771 · $64/mo
- Projected year-2 tax
- $1,350 · $113/mo
- Expected delta
- +$579/yr (+$48/mo · 75.1%)
ⓘ Screening estimate from a state-policy table — verify with the county assessor before closing.
Climate risk First Street
- Flood 1/10 Low FEMA zone X (unshaded) · 0% chance over 30 yrs
- Wildfire 1/10 Low
- Heat 2/10 Low 7 d/yr ≥101°F today · 15 d/yr by 30 yrs out
- Wind 2/10 Low
- Air quality 3/10 Moderate 2 unhealthy d/yr today · 3 by 30 yrs out
Nearby sold comps map
Loading sold comps map…
Walkable amenities ~0.75 mi
Loading nearby amenities…
Taxation est. · year 1
- Rental income
- $14,490
- − Mortgage interest
- −$4,761
- − Property taxes
- −$771
- − Insurance
- −$425
- − Repairs & maintenance
- −$1,159
- − Management
- −$1,159
- − Depreciation
- −$2,473
- Taxable income
- $3,742
- Est. tax owed @ 24.0%
- −$898
- After-tax cash flow
- $4,004/yr
For passive investors: Depreciation is non-cash, so a rental often shows a tax loss while cash-flowing — sheltering income. Rental losses are passive: they offset passive income freely, and up to $25,000/yr can offset ordinary (W-2) income if you actively participate and your MAGI is under $100k (phasing out to $0 by $150k); unused losses carry forward. On sale, claimed depreciation is recaptured at up to 25%, and gains may owe capital-gains tax (a 1031 exchange can defer both). Figures are a year-1 estimate at your 24.0% rate — not tax advice; consult a CPA.
Schools (NCES district)
- District
- Oregon CUSD 220
- NCES district ID
- 1730160
- Math proficiency
- 20% ▼ -9.00%
- Reading proficiency
- 22% ▼ -4.00%
- Median HH income
- $50,631
- Composite
- 18.8/100
- National rank
- #8868
- State rank
- #400 of 620 in IL
Livability — Mount Morris
- Score
- 69/100
- State rank
- #391
- US rank
- #8215
Category grades
Schools grade is shown separately in the Schools card above.
Census & demographics
- Census place
- Mount Morris, IL
- Population (ZIP)
- 3,617
Population outlook (Ogle County) Hauer SSP2
- Today (2025)
- 48,390 people
- By 2030
- 46,346 · -4.2%
- By 2040
- 41,772 · -13.7%
- By 2050
- 36,911 · -23.7%
- By 2075
- 27,130 · -43.9%
- By 2100
- 18,627 · -61.5%
Race, ethnicity, and origin ACS 2023
- Neighborhood character
- Predominantly White (93%)
- Race & ethnicity
- White 93% Two or more races 3% Hispanic / Latino 2% Black 2%
- Common ancestry
- Romanian 5% Portuguese 3% Italian 2%
- Foreign-born
- 6%
- Languages at home
- 96% English-only · Other Indo-European 3% German/W. Germanic 1%
Political lean MEDSL · Ogle
- 2024 margin
- Strong R (+29.4) · D 34.5% · R 63.9% · Other 1.6%
- 2008→2024 swing
- -21.8pp toward R · 2008: -7.6pp · 2024: -29.4pp
- All cycles
- 2024: R+29.4 2020: R+25.9 2016: R+26.6 2012: R+16.7 2008: R+7.6
Not yet ingested
- Civics
- —
Market trends
- HPI YoY
- ▼ -32.02%
- Current HPI
- 166.3688
- Rent YoY
- —
- Metro
- —
- State GDP YoY
- ▲ 1.59%
- F500 in state
- 60
Industry mix (Fortune 500 HQ in IL)
| Industry | F500 HQs | Revenue |
|---|---|---|
| Insurance | 4 | $201B |
|
||
| Consumer Goods | 4 | $87B |
|
||
| Industrial Machinery | 3 | $64B |
|
||
| Healthcare | 2 | $55B |
|
||
| Retail / Pharmacy | 1 | $148B |
|
||
| Agriculture / Food | 1 | $86B |
|
||
Price history
+0.0% since first listed2 events — show timeline
- 2026-06-15 Listed $85,000 NWIAR
- 2026-06-15 Listed $85,000 MRED as Distributed by MLS Grid
Property tax history
-1.9%/yrLatest (2024): $771 · -2.3% YoY. Source: county tax records.
Cash-flow waterfall
monthlySold comps — $/sqft
last 12 mo · ≤1 miLoading sold comps…