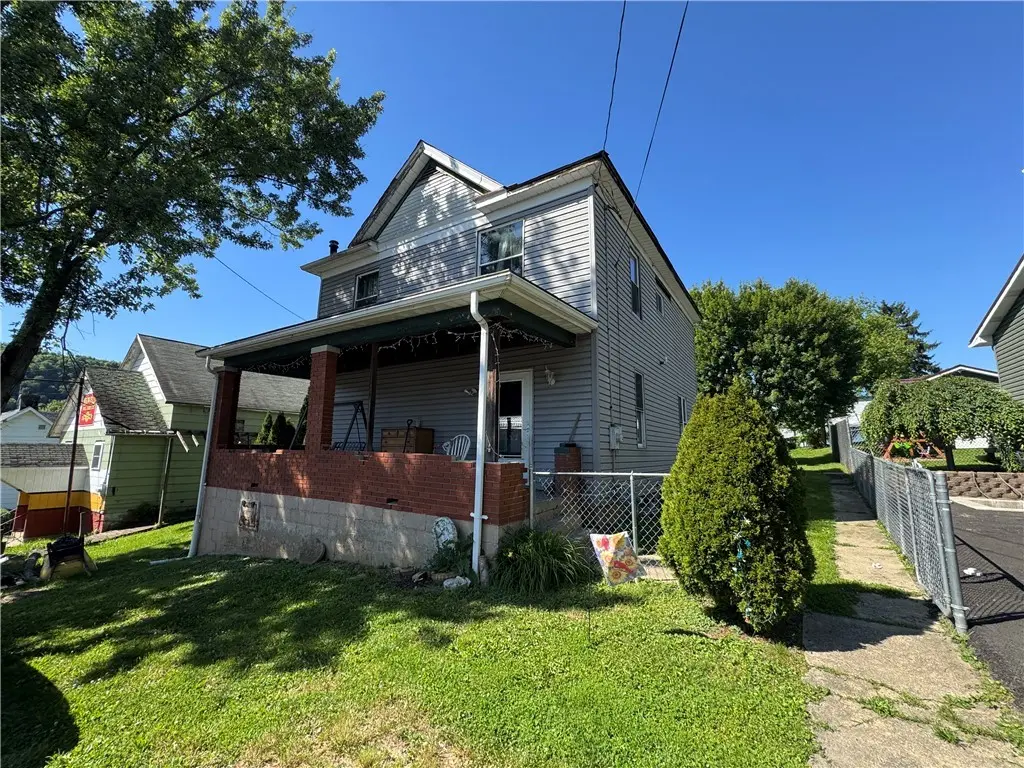
409 Miller Rd · Newell, PA
Flood risk 1/10 · Minimal
- FEMA flood zone
- X (unshaded)
- Chance of flooding over 30 yrs
- 0.0%
- Est. flood insurance / yr
- $473 – $860
Fire risk 1/10 · Minimal
- Est. fire insurance / yr
- $511 – $949
Heat risk 4/10 · Minor
- Hot days now (above 99°F)
- 7 days/yr
- Hot days in 30 yrs
- 19 days/yr
Wind risk 2/10 · Minimal
- Chance of severe wind over 30 yrs
- —
Air-quality risk 2/10 · Minimal
- Unhealthy air days now
- 1 days/yr
- Unhealthy air days in 30 yrs
- 2 days/yr
Risk factors via First Street. Map © Google.
Why this score? — see what drove the C- grade
The composite is a weighted blend of 9 inputs, each scored 0–100. Each bar is that input's sub-score; the figure is the points it added to the 100-point composite (weight × sub-score).
- Cash flow +15.0/30.0
- ARV discount +7.5/15.0
- Appreciation +7.3/10.0
- 1% rule +5.0/10.0
- DSCR +5.0/10.0
- Schools +3.3/10.0
- Livability +3.2/5.0
- Rent growth +2.5/5.0
- Condition / age +2.5/5.0
$27,500
🖨 Deal sheet 📄 Offer letter ✓ Due diligence
Listing remarks
Investor Special in Newell! This 4-bedroom, 1-bath home offers plenty of potential for investors, flippers, or handy owner-occupants. Features include off-street parking and a functional floor plan with ample living space. The property is in need of cosmetic updates and mechanical improvements, making it an excellent opportunity to add value and build equity. Whether you're looking for your next renovation project or a buy-and-hold investment, this property offers strong upside potential at an affordable entry point.
Key facts
- Ample living space
- Cosmetic updates
- Off-street parking
Tags
Property features AI
Finance
- Other: No additional financial amenities provided
- Financial info: Financial details not included
- HOA & community: Public transportation access nearby
Exterior
- Parking: Off-street parking
- Security: No security features specified
- Utilities: Public water; Public sewer
- Home design: Two-story frame house; Asphalt roof; Resale property
- Construction: Frame construction; Asphalt roof
- Exterior features: Lot approximately 0.18 acres
Interior
- Kitchen: Main-level kitchen (approx. 15x12)
- Bedrooms: Upper-level bedrooms (three bedrooms: approx. 12x11, 12x12, 12x9); Additional upper-level room approx. 12x12 (may be used as bedroom)
- Flooring: Carpet; Vinyl
- Bathrooms: One full bathroom
- Heating & cooling: Forced air heating (gas); Central air conditioning
- Interior features: Has basement; Carpet and vinyl flooring
- Laundry & utility: Utility spaces not specified
Neighborhood map
What this means for you Summary
Snapshot
- This is a 4-bed/1.5-bath single-family listed at $28k.
Deal economics
- At list price, monthly cash flow is $842 ($10k/yr) — positive.
- The deal already cash-flows at list — no discount required.
- Meets the 1% rule at list price ($1k rent vs $28k).
Location & tenants
- Location reads 65/100 on livability (#1,104 in PA) — a middle-class / working-renter tenant base. Strengths: cost of living A+, housing A+, employment B+; Watch: crime C-, health & safety D, schools F.
- Frazier SD (rural): math 25% / reading 52% proficiency, ranked #371 of 539 in PA (top 69%) — families likely to look elsewhere, expect single-tenant / working-renter base with shorter leases.
- Market conditions: 16 active listings in the ZIP; 5 comparable units currently listed for rent nearby; rentals at typical pace (median 24d on market — plan ~3-4 weeks tenant-placement turnaround); 40% of comp listings sitting > 30 days — soft ceiling on asking rent; 201 units permitted in Fayette County in 2024 (10 in 5+ unit buildings).
Forward outlook
- In year one you build about $1k of equity ($190 loan paydown + $1k appreciation (4.6% local appreciation)).
- Fayette County population projected at -19% by 2050 — secular population decline; favor cash flow + early exit over multi-decade hold.
- At projected returns (4.6% appreciation + 3.0% rent growth), your $8k cash investment doubles in ~1 year — after that, you're playing with house money.
Negotiation context
- Only 2 days on market — expect competitive offers; lowballing is unlikely to land.
Risks & watch-outs
- Watch-outs: built in 1900 — expect roof / HVAC / electrical / plumbing capex.
Questions for the listing agent
- Built in 1900 — when were the roof, HVAC, electrical panel, plumbing, and water heater last replaced?
- Is there a deadline driving the sale (1031 exchange, divorce, estate, relocation)? That informs how much negotiation room exists.
- Schools are F-rated, which usually means shorter tenancies and higher turnover. Who's the typical renter profile here, and what's been the actual vacancy rate?
- What's the average days-on-market for RENTAL listings here right now (not sales)? A rising rental-DOM trend means longer vacancies and softer asking-rent achievability than the comps imply.
- What's the recent tenant-quality profile in this submarket — average credit score on applications, eviction rate, late-payment / NSF rate, and stable-employment percentage? A property-management company in the area should have these aggregated.
- How much new for-sale + rental construction is in the pipeline within 1–3 miles? Heavy new supply typically softens prices + rents 12–24 months out; constrained supply supports both.
Investment metrics
- 1% rule
- 4.75% ✓
- Cap rate
- 43.03%
- Cash-on-cash
- 131.21%
- DSCR
- 6.84
- GRM
- 1.8
CMA / ARV
- ARV (on-the-fly)
- $146,432
- Comps found
- 5
Show comp detail 5 sales within ~0.75 mi
| Address | Dist | Beds/Ba | Sqft | Sold | Price | $/sf | Match |
|---|---|---|---|---|---|---|---|
| 424 4th St | 0.15mi | 3/2.0 (-1) | 1,728 (+4%) | 18mo | $199,900 | $116 | 64 |
| 324 Wood St | 0.72mi | 3/1.0 (-1) | 1,557 (-6%) | 4mo | $52,000 | $33 | 45 |
| 306 4th St | 0.69mi | 5/1.5 (+1) | 1,798 (+8%) | 19mo | $159,000 | $88 | 34 |
| 227 1st St | 0.50mi | 3/2.0 (-1) | 1,416 (-15%) | 14mo | $104,000 | $73 | 34 |
| 897 Highpoint Dr | 0.45mi | 3/2.5 (-1) | 1,876 (+13%) | 21mo | $215,000 | $115 | 31 |
Match score weights: distance 35% · size 25% · config 20% · recency 20%. Top-matched comps best support the ARV.
Projected returns pro-forma
4.58% appreciation · 3.0% rent growth · sell at horizon
- IRR
- —
- Equity multiple
- 8.70×
- Total profit
- $59,327
- Equity at exit
- $14,886
- IRR
- —
- Equity multiple
- 18.32×
- Total profit
- $133,352
- Equity at exit
- $25,132
Cash invested: $7,700 (down + closing). Projections, not guarantees.
Landlord ↔ Tenant lean methodology
- Overall (STATE)
- 62 Landlord-Friendly
- State Pennsylvania
- 62 Landlord-Friendly · EVEN
- County
- — inherits STATE
- City
- — inherits STATE
ZIP-level market 15478
- Home prices YoY
- 2.0%
- Active inventory
- 16
- Price-to-rent
- 1.8×
Monthly cashflow live
- Estimated rent
- $1,306 high interval (Pro) →
- Mortgage (P&I)
- −$144
- Tax est. 1.5%
- −$34 /mo · $412/yr
- Insurance
- −$11
- HOA
- −$0
- Vacancy / Maint / Mgmt
- −$274
- Net cashflow
- $842
Break-even live
UW: 25.0% down · 7.5% · 30yr · 1.5% tax · 5.0% vac · 8.0% maint · 8.0% mgmt
Financing live
Cash to close
- Down payment
- $6,875
- Closing costs
- $825
- Reserves months
- —
- Total cash needed
- —
Loan-product check · same deal, 3 products live
Conventional
25% down · 7.5% · 30yr
- Down + closing
- —
- Monthly P&I
- —
- Monthly cashflow
- —
- DSCR
- —
- Eligible?
- —
Personal DTI + credit; lowest rate.
DSCR
20% down · 8.5% · 30yr
- Down + closing
- —
- Monthly P&I
- —
- Monthly cashflow
- —
- DSCR
- —
- Eligible?
- —
No personal income docs; deal must DSCR.
Hard money
10% down · 12.0% · 12mo
- Down + closing
- —
- Monthly P&I
- —
- Monthly cashflow
- —
- DSCR
- —
- Eligible?
- —
Short-term bridge; refi at stabilization.
Rent comps 5 comps
| Address | Beds | Baths | Sqft | Rent | $/sqft | DOM | Units | Dist |
|---|---|---|---|---|---|---|---|---|
| 54 Temperance Way Unit 7 California, PA | 3.0 | 2.0 | 1300 | $1,095 | $0.84 | 15d | 1 | 0.47mi |
| 115 1st St Unit 1 California, PA | 3.0 | 1.0 | 1200 | $950 | $0.79 | 44d | 1 | 0.47mi |
| 214 3rd St California, PA | 4.0 | 2.0 | 1650 | $1,650 | $1.00 | 21d | 1 | 0.61mi |
| 456 Second St Unit 1 California, PA | 4.0 | 2.0 | 1451 | $1,500 | $1.03 | 44d | 1 | 0.68mi |
| 319 5th St California, PA | 4.0 | 2.0 | 1369 | $1,395 | $1.02 | 24d | 1 | 0.80mi |
Listing history 3 events
-
2026-06-18days on market $27,500 Active 2 DOM
-
2026-06-17remarks 522-char remark
-
2026-06-17$27,500 Active 1 DOM
ⓘ Source: listings_history table (triggers on properties + properties_extension) + one-shot
backfill from property_details.listing_events for pre-trigger history.
Climate risk First Street
- Flood 1/10 Low FEMA zone X (unshaded) · 0% chance over 30 yrs
- Wildfire 1/10 Low
- Heat 4/10 Moderate 7 d/yr ≥99°F today · 19 d/yr by 30 yrs out
- Wind 2/10 Low
- Air quality 2/10 Low 1 unhealthy d/yr today · 2 by 30 yrs out
Nearby sold comps map
Loading sold comps map…
Walkable amenities ~0.75 mi
Loading nearby amenities…
Taxation est. · year 1
- Rental income
- $15,676
- − Mortgage interest
- −$1,540
- − Property taxes
- −$412
- − Insurance
- −$138
- − Repairs & maintenance
- −$1,254
- − Management
- −$1,254
- − Depreciation
- −$800
- Taxable income
- $10,277
- Est. tax owed @ 24.0%
- −$2,467
- After-tax cash flow
- $7,637/yr
For passive investors: Depreciation is non-cash, so a rental often shows a tax loss while cash-flowing — sheltering income. Rental losses are passive: they offset passive income freely, and up to $25,000/yr can offset ordinary (W-2) income if you actively participate and your MAGI is under $100k (phasing out to $0 by $150k); unused losses carry forward. On sale, claimed depreciation is recaptured at up to 25%, and gains may owe capital-gains tax (a 1031 exchange can defer both). Figures are a year-1 estimate at your 24.0% rate — not tax advice; consult a CPA.
Schools (NCES district)
- District
- Frazier SD
- NCES district ID
- 4210350
- Math proficiency
- 25% ▼ -16.00%
- Reading proficiency
- 52% ▼ -7.00%
- Median HH income
- $46,463
- Composite
- 32.8/100
- National rank
- #5628
- State rank
- #371 of 539 in PA
Livability — Newell
- Score
- 65/100
- State rank
- #1104
- US rank
- #12551
Category grades
Schools grade is shown separately in the Schools card above.
Census & demographics
- Census place
- Newell, PA
- City population
- 437
- Population (ZIP)
- 5,679
Population outlook (Fayette County) Hauer SSP2
- Today (2025)
- 127,561 people
- By 2030
- 123,206 · -3.4%
- By 2040
- 113,232 · -11.2%
- By 2050
- 103,468 · -18.9%
- By 2075
- 83,185 · -34.8%
- By 2100
- 62,384 · -51.1%
Race, ethnicity, and origin ACS 2023
- Neighborhood character
- Predominantly White (97%)
- Race & ethnicity
- White 97% Two or more races 2%
- Common ancestry
- Romanian 7% Iranian 3% Serbian 2%
- Foreign-born
- 0% · China
Political lean MEDSL · Fayette
- 2024 margin
- Solid R (+37.9) · D 30.8% · R 68.7%
- 2008→2024 swing
- -37.5pp toward R · 2008: -0.4pp · 2024: -37.9pp
- All cycles
- 2024: R+37.9 2020: R+33.5 2016: R+31.0 2012: R+8.3 2008: R+0.4
Not yet ingested
- Civics
- —
Market trends
- HPI YoY
- ▲ 4.58%
- Current HPI
- 235.5887
- Rent YoY
- —
- Metro
- —
- State GDP YoY
- ▲ 1.68%
- F500 in state
- 34
Industry mix (Fortune 500 HQ in PA)
| Industry | F500 HQs | Revenue |
|---|---|---|
| Healthcare | 2 | $309B |
|
||
| Insurance | 2 | $27B |
|
||
| Telecommunications / Media | 1 | $124B |
|
||
| Industrial Distribution | 1 | $22B |
|
||
| Financial Services | 1 | $20B |
|
||
| Chemicals / Materials | 1 | $18B |
|
||
Price history
-17.9% since first listed3 events — show timeline
- 2026-06-16 Listed $27,500 West Penn MLS
- 2015-05-27 Sold (Public Records) $47,500 Public Records
- 1999-11-30 Sold (Public Records) $33,500 Public Records
Property tax history
+4.5%/yrLatest (2026): $1,559 · +3.7% YoY. Source: county tax records.
Cash-flow waterfall
monthlySold comps — $/sqft
last 12 mo · ≤1 miLoading sold comps…