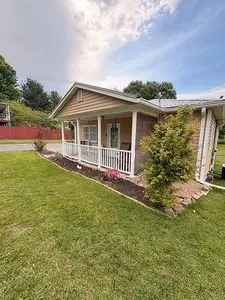
4124 Old Jonesboro Rd · Bristol, TN
Flood risk 1/10 · Minimal
- FEMA flood zone
- X (unshaded)
- Chance of flooding over 30 yrs
- 0.0%
- Est. flood insurance / yr
- $473 – $860
Fire risk 3/10 · Minor
- Est. fire insurance / yr
- $949 – $1,763
Heat risk 4/10 · Minor
- Hot days now (above 97°F)
- 7 days/yr
- Hot days in 30 yrs
- 20 days/yr
Wind risk 2/10 · Minimal
- Chance of severe wind over 30 yrs
- —
Air-quality risk 2/10 · Minimal
- Unhealthy air days now
- 2 days/yr
- Unhealthy air days in 30 yrs
- 2 days/yr
Risk factors via First Street. Map © Google.
Why this score? — see what drove the D+ grade
The composite is a weighted blend of 9 inputs, each scored 0–100. Each bar is that input's sub-score; the figure is the points it added to the 100-point composite (weight × sub-score).
- Cash flow +14.0/30.0
- ARV discount +12.9/15.0
- DSCR +4.2/10.0
- Livability +3.7/5.0
- 1% rule +3.0/10.0
- Schools +3.0/10.0
- Rent growth +2.5/5.0
- Condition / age +2.5/5.0
- Appreciation +0.0/10.0
$220,000
🖨 Deal sheet 📄 Offer letter ✓ Due diligence
Listing remarks MLS
Investors/first time home owners: Don't miss this 2 bedroom, 1 bath on a level lot with fully fenced back yard with half acre plus. Newer architectural shingle roof (approx. 5 years old) and newer water heater. Enjoy country living in the city! Convenient to all that historic Bristol has to offer. Call listing agent for showing appointments. This listing won't last long!
Key facts
- New metal roof
- New heat pump
- New water heater
Tags
Neighborhood map
What this means for you Summary
Snapshot
- This is a 2-bed/1.0-bath single-family listed at $220k.
Deal economics
- At list price, monthly cash flow is $27 ($321/yr) — positive.
- The deal already cash-flows at list — no discount required.
- To meet the 1% rule (rent ≥ 1% of price), the offer needs to be $176k (19.9% below list).
- Recommended offer: $176k (19.9% below list) — sets the bar for 1% rule.
- Cap rate 6.4% vs local median 3.8% in Bristol — top-decile yield for the area; either an underpriced asset or a hidden risk that comps aren't pricing in. Stress-test before assuming the spread holds.
Location & tenants
- Location reads 73/100 on livability (#24 in TN) — a middle-class / working-renter tenant base. Strengths: cost of living A+, housing A+, health & safety A+; Watch: schools D+, crime D+, commute F.
- Bristol (urban): math 37% / reading 35% proficiency, ranked #29 of 139 in TN (top 21%) — families likely to look elsewhere, expect single-tenant / working-renter base with shorter leases.
- Market conditions: 253 active listings in the ZIP; 2 comparable units currently listed for rent nearby; 453 units permitted in Sullivan County in 2024 (6 in 5+ unit buildings).
- This rent runs 38% of the median local income ($56k/yr) — at the standard rent-burdened threshold; future hikes will face affordability resistance.
Forward outlook
- Local home prices are declining (-3.0%/yr); year-one equity from $2k of loan paydown is wiped out by about $7k of value loss. Plan a longer hold.
- Sullivan County population projected to shrink 5% by 2050 — rents likely to lag national; underwrite the cash flow, not the appreciation.
Negotiation context
- Only 1 days on market — expect competitive offers; lowballing is unlikely to land.
- 2 sale attempts since 8y ago with the ask held roughly flat each time — persistent listings suggest the price (not the market) is what's stuck; bring a comps-based counter.
- Current owner paid $79k; list at $220k implies a 178% gain — meaningful room to come down on a strong offer.
Questions for the listing agent
- Is there a deadline driving the sale (1031 exchange, divorce, estate, relocation)? That informs how much negotiation room exists.
- Schools are D-rated, which usually means shorter tenancies and higher turnover. Who's the typical renter profile here, and what's been the actual vacancy rate?
- Crime grade is D in this area — have there been break-ins, vandalism, or insurance claims at this property in the last 3 years? What carrier currently insures it and at what premium?
- The area grade is low — what's the realistic commute time and amenity access for the typical tenant pool here? Any planned neighborhood developments (good or bad) we should know about?
- What's the average days-on-market for RENTAL listings here right now (not sales)? A rising rental-DOM trend means longer vacancies and softer asking-rent achievability than the comps imply.
- What's the recent tenant-quality profile in this submarket — average credit score on applications, eviction rate, late-payment / NSF rate, and stable-employment percentage? A property-management company in the area should have these aggregated.
- How much new for-sale + rental construction is in the pipeline within 1–3 miles? Heavy new supply typically softens prices + rents 12–24 months out; constrained supply supports both.
Investment metrics
- 1% rule
- 0.80% ✗
- Cap rate
- 6.44%
- Cash-on-cash
- 0.52%
- DSCR
- 1.02
- GRM
- 10.4
CMA / ARV
- ARV (on-the-fly)
- $249,900
- Comps found
- 10
Show comp detail 10 sales within ~0.75 mi
| Address | Dist | Beds/Ba | Sqft | Sold | Price | $/sf | Match |
|---|---|---|---|---|---|---|---|
| 152 Wilkshire Pl | 0.20mi | 2/2.0 | 1,008 (-4%) | 23mo | $240,000 | $238 | 61 |
| 140 West Wilkshire Pl | 0.19mi | 2/2.0 | 1,196 (+14%) | 6mo | $276,000 | $231 | 59 |
| 236 Hunter Hls #2 | 0.21mi | 2/2.0 | 1,176 (+12%) | 9mo | $180,000 | $153 | 59 |
| 108 Melody Ln Unit C1 | 0.72mi | 2/1.0 | 1,104 (+5%) | 17mo | $1,000 | $1 | 44 |
| 1252 Old Jonesboro Rd | 0.75mi | 2/1.0 | 1,140 (+9%) | 9mo | $208,300 | $183 | 43 |
| 205 Kingsley Down Dr | 0.40mi | 2/2.0 | 1,169 (+11%) | 20mo | $287,000 | $246 | 42 |
| 216 Brighton Pl | 0.52mi | 3/2.0 (+1) | 1,200 (+14%) | 13mo | $289,000 | $241 | 32 |
| 125 Brighton Pl | 0.53mi | 3/2.0 (+1) | 1,200 (+14%) | 12mo | $285,000 | $238 | 32 |
| 129 Brighton Pl | 0.52mi | 3/2.0 (+1) | 1,200 (+14%) | 13mo | $285,000 | $238 | 32 |
| 166 Brighton Pl | 0.48mi | 3/2.0 (+1) | 1,200 (+14%) | 22mo | $286,900 | $239 | 27 |
Match score weights: distance 35% · size 25% · config 20% · recency 20%. Top-matched comps best support the ARV.
Projected returns pro-forma
-3.0% appreciation · 3.0% rent growth · sell at horizon
- IRR
- -15.5%
- Equity multiple
- 0.45×
- Total profit
- $-34,015
- Equity at exit
- $32,803
- IRR
- -7.1%
- Equity multiple
- 0.55×
- Total profit
- $-27,707
- Equity at exit
- $19,022
Cash invested: $61,600 (down + closing). Projections, not guarantees.
Landlord ↔ Tenant lean methodology
- Overall (STATE)
- 87 Strongly Landlord-Friendly
- State Tennessee
- 87 Strongly Landlord-Friendly · R+13
- County
- — inherits STATE
- City
- — inherits STATE
ZIP-level market 37620
- Active inventory
- 253
- Price-to-rent
- 10.4×
Monthly cashflow live
- Estimated rent
- $1,762 medium interval (Pro) →
- Mortgage (P&I)
- −$1,154
- Tax from tax record
- −$120 /mo · $1,434/yr
- Insurance
- −$92
- HOA
- −$0
- Vacancy / Maint / Mgmt
- −$370
- Net cashflow
- $27
Break-even live
UW: 25.0% down · 7.5% · 30yr · 1.5% tax · 5.0% vac · 8.0% maint · 8.0% mgmt
Financing live
Cash to close
- Down payment
- $55,000
- Closing costs
- $6,600
- Reserves months
- —
- Total cash needed
- —
Loan-product check · same deal, 3 products live
Conventional
25% down · 7.5% · 30yr
- Down + closing
- —
- Monthly P&I
- —
- Monthly cashflow
- —
- DSCR
- —
- Eligible?
- —
Personal DTI + credit; lowest rate.
DSCR
20% down · 8.5% · 30yr
- Down + closing
- —
- Monthly P&I
- —
- Monthly cashflow
- —
- DSCR
- —
- Eligible?
- —
No personal income docs; deal must DSCR.
Hard money
10% down · 12.0% · 12mo
- Down + closing
- —
- Monthly P&I
- —
- Monthly cashflow
- —
- DSCR
- —
- Eligible?
- —
Short-term bridge; refi at stabilization.
Rent comps 2 comps
| Address | Beds | Baths | Sqft | Rent | $/sqft | DOM | Units | Dist |
|---|---|---|---|---|---|---|---|---|
| 254 Wildwood Dr Bristol, TN | 3.0 | 1.5 | 1200 | $1,550 | $1.29 | 13d | 1 | 0.99mi |
| 221 Monroe Dr Bristol, TN | 3.0 | 2.0 | 1282 | $2,650 | $2.07 | 20d | 1 | 1.20mi |
Listing history 7 events
-
2026-05-13status Under Contract
-
2026-05-12$220,000 Active
-
2018-08-01soldstatus $79,200
-
2018-07-31soldstatus $79,200 373-char remark
Show marketing remark (373 chars)
Investors/first time home owners: Don't miss this 2 bedroom, 1 bath on a level lot with fully fenced back yard with half acre plus. Newer architectural shingle roof (approx. 5 years old) and newer water heater. Enjoy country living in the city! Convenient to all that historic Bristol has to offer. Call listing agent for showing appointments. This listing won't last long!
-
2018-04-19$86,000 373-char remark
Show marketing remark (373 chars)
Investors/first time home owners: Don't miss this 2 bedroom, 1 bath on a level lot with fully fenced back yard with half acre plus. Newer architectural shingle roof (approx. 5 years old) and newer water heater. Enjoy country living in the city! Convenient to all that historic Bristol has to offer. Call listing agent for showing appointments. This listing won't last long!
-
1997-07-01soldstatus $25,000
-
1978-04-06soldstatus $23,000
ⓘ Source: listings_history table (triggers on properties + properties_extension) + one-shot
backfill from property_details.listing_events for pre-trigger history.
Tax reassessment forecast TN · Resets to sale price
- Current annual tax
- $1,434 · $120/mo
- Projected year-2 tax
- $1,562 · $130/mo
- Expected delta
- +$128/yr (+$11/mo · 8.9%)
ⓘ Screening estimate from a state-policy table — verify with the county assessor before closing.
Climate risk First Street
- Flood 1/10 Low FEMA zone X (unshaded) · 0% chance over 30 yrs
- Wildfire 3/10 Moderate
- Heat 4/10 Moderate 7 d/yr ≥97°F today · 20 d/yr by 30 yrs out
- Wind 2/10 Low
- Air quality 2/10 Low 2 unhealthy d/yr today · 2 by 30 yrs out
Nearby sold comps map
Loading sold comps map…
Walkable amenities ~0.75 mi
Loading nearby amenities…
Taxation est. · year 1
- Rental income
- $21,138
- − Mortgage interest
- −$12,323
- − Property taxes
- −$1,434
- − Insurance
- −$1,100
- − Repairs & maintenance
- −$1,691
- − Management
- −$1,691
- − Depreciation
- −$6,400
- Taxable loss
- −$3,501
- Est. tax savings @ 24.0%
- +$840
- After-tax cash flow
- $1,161/yr
For passive investors: Depreciation is non-cash, so a rental often shows a tax loss while cash-flowing — sheltering income. Rental losses are passive: they offset passive income freely, and up to $25,000/yr can offset ordinary (W-2) income if you actively participate and your MAGI is under $100k (phasing out to $0 by $150k); unused losses carry forward. On sale, claimed depreciation is recaptured at up to 25%, and gains may owe capital-gains tax (a 1031 exchange can defer both). Figures are a year-1 estimate at your 24.0% rate — not tax advice; consult a CPA.
Schools (NCES district)
- District
- Bristol
- NCES district ID
- 4700360
- Math proficiency
- 37% ▼ -7.00%
- Reading proficiency
- 35% ▼ -8.00%
- Median HH income
- $37,018
- Composite
- 29.95/100
- National rank
- #6376
- State rank
- #29 of 139 in TN
Livability — Bristol
- Score
- 73/100
- State rank
- #24
- US rank
- #5413
Category grades
Schools grade is shown separately in the Schools card above.
Census & demographics
- Census place
- Bristol, TN
- County
- Sullivan County · 121,987 people
- City population
- 38,494
- Metro
- Kingsport-Bristol, TN-VA
- Population (ZIP)
- 38,494
- Household income
- $56,128
- Rent vs Own
- Severe rent burden
- 724.0
Population outlook (Sullivan County) Hauer SSP2
- Today (2025)
- 157,030 people
- By 2030
- 156,415 · -0.4%
- By 2040
- 153,778 · -2.1%
- By 2050
- 149,018 · -5.1%
- By 2075
- 138,068 · -12.1%
- By 2100
- 119,927 · -23.6%
Race, ethnicity, and origin ACS 2023
- Neighborhood character
- Predominantly White (91%)
- Race & ethnicity
- White 91% Two or more races 5% Hispanic / Latino 3% Black 2%
- Common ancestry
- Serbian 3% Slovak 3% Italian 1%
- Foreign-born
- 2% · Canada
- Languages at home
- 97% English-only · Spanish 2%
Political lean MEDSL · Sullivan
- 2024 margin
- Solid R (+55.0) · D 22.0% · R 77.0% · Other 1.0%
- 2008→2024 swing
- -13.6pp toward R · 2008: -41.3pp · 2024: -55.0pp
- All cycles
- 2024: R+55.0 2020: R+51.9 2016: R+56.2 2012: R+47.2 2008: R+41.3
Not yet ingested
- Civics
- —
Market trends
- HPI YoY
- ▼ -294.12%
- Current HPI
- 263.38
- Rent YoY
- —
- Metro
- Kingsport-Bristol, TN-VA
- State GDP YoY
- ▲ 2.78%
- F500 in state
- 22
Industry mix (Fortune 500 HQ in TN)
| Industry | F500 HQs | Revenue |
|---|---|---|
| Healthcare | 3 | $91B |
|
||
| Retail | 3 | $72B |
|
||
| Transportation / Logistics | 1 | $88B |
|
||
| Paper / Packaging | 1 | $19B |
|
||
| Insurance | 1 | $13B |
|
||
| Energy | 1 | $12B |
|
||
Price history
+856.5% since first listed7 events — show timeline
- 2026-05-13 Pending — FSBO.com
- 2026-05-12 Listed $220,000 FSBO.com
- 2018-08-01 Sold (Public Records) $79,200 Public Records
- 2018-07-31 Sold (MLS) $79,200 TVRMLS
- 2018-04-19 Listed $86,000 TVRMLS
- 1997-07-01 Sold (Public Records) $25,000 Public Records
- 1978-04-06 Sold (Public Records) $23,000 Public Records
Property tax history
+7.5%/yrLatest (2025): $1,434 · +44.4% YoY. Source: county tax records.
Cash-flow waterfall
monthlySold comps — $/sqft
last 12 mo · ≤1 miLoading sold comps…