207 Idaho Ave · Crystal Lake, FL
Flood risk 1/10 · Minimal
- FEMA flood zone
- X (unshaded)
- Chance of flooding over 30 yrs
- 0.0%
- Est. flood insurance / yr
- $507 – $1,088
Fire risk 3/10 · Minor
- Est. fire insurance / yr
- $947 – $1,759
Heat risk 8/10 · Major
- Hot days now (above 108°F)
- 7 days/yr
- Hot days in 30 yrs
- 23 days/yr
Wind risk 9/10 · Severe
- Chance of severe wind over 30 yrs
- 99.0%
Air-quality risk 2/10 · Minimal
- Unhealthy air days now
- 1 days/yr
- Unhealthy air days in 30 yrs
- 2 days/yr
Risk factors via First Street. Map © Google.
Why this score? — see what drove the B- grade
The composite is a weighted blend of 9 inputs, each scored 0–100. Each bar is that input's sub-score; the figure is the points it added to the 100-point composite (weight × sub-score).
- Cash flow +30.0/30.0
- 1% rule +10.0/10.0
- DSCR +10.0/10.0
- ARV discount +7.5/15.0
- Schools +3.5/10.0
- Livability +3.3/5.0
- Rent growth +2.8/5.0
- Condition / age +2.5/5.0
- Appreciation +0.0/10.0
$80,000
🖨 Deal sheet (PDF) 📄 Offer letter ✓ Due diligence
Listing remarks
* * Investor Special, Cash Only * * Rehab or tear down 3 bedroom, 1 bathroom off of US 92 & County Road 33 A in Lakeland! No HOA and Flood Zone X! Home is being sold as-is and seller makes no warranties. NO sight-unseen will be reviewed and only end buyers please!
Key facts
- Flood zone x
- No hoa
- 7,510 sq ft lot
Tags
Property features AI
Finance
- Other: Zoning: R-2
- Financial info: Lease restrictions: none
- HOA & community: No HOA
Exterior
- Parking: Parking details not provided
- Security: No security features listed
- Utilities: Public water; Septic sewer; Electricity connected
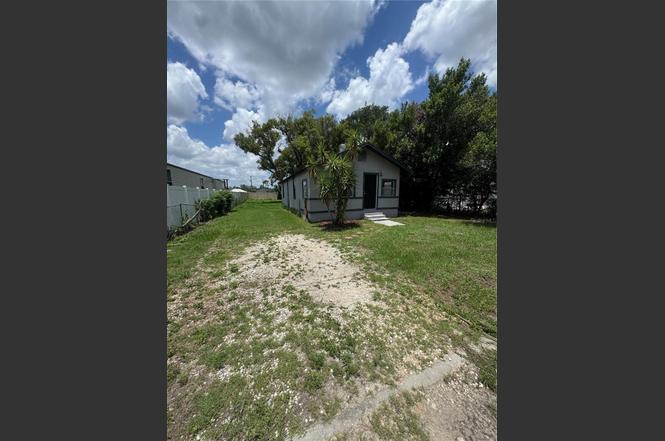
- Home design: Single-family residence; One story; Faces east; Listed condition: fixer
- Construction: Stucco and frame construction; Shingle roof; Crawlspace foundation; Originally built area approximately 792 sq ft
- Exterior features: Paved road access; Lot about 0.17 acre
Interior
- Kitchen: Range; Refrigerator
- Bedrooms: 3 bedrooms
- Flooring: Tile flooring
- Bathrooms: 1 full bathroom
- Heating & cooling: Central heating; Central air conditioning
- Interior features: No notable interior features listed; Inside utility room
- Laundry & utility: Laundry located inside
Neighborhood map
What this means for you Summary
Snapshot
- This is a 2-bed/1.0-bath single-family listed at $80k.
Deal economics
- At list price, monthly cash flow is $444 ($5k/yr) — positive.
- The deal already cash-flows at list — no discount required.
- Meets the 1% rule at list price ($1k rent vs $80k).
Location & tenants
- Location reads 66/100 on livability (#620 in FL) — a middle-class / working-renter tenant base. Strengths: cost of living A+, housing A+, health & safety A; Watch: schools C-, amenities F, commute F.
- Polk (suburban): math 39% / reading 43% proficiency, ranked #62 of 73 in FL (top 85%) — families likely to look elsewhere, expect single-tenant / working-renter base with shorter leases.
- Market conditions: Rents rising (+1.1%/yr); 253 active listings in the ZIP; 19 comparable units currently listed for rent nearby; rentals at typical pace (median 25d on market — plan ~3-4 weeks tenant-placement turnaround); 10,384 units permitted in Polk County in 2024 (1,716 in 5+ unit buildings).
Forward outlook
- Local home prices are declining (-3.0%/yr); year-one equity from $553 of loan paydown is wiped out by about $2k of value loss. Plan a longer hold.
- Polk County population projected at +33% by 2050 — long-run rental-demand tailwind backs the buy-and-hold thesis.
- At projected returns (-3.0% appreciation + 1.1% rent growth), your $22k cash investment doubles in ~6 years — after that, you're playing with house money.
Negotiation context
- Only 1 days on market — expect competitive offers; lowballing is unlikely to land.
- 7 sale attempts since 8y ago with the ask held roughly flat each time — persistent listings suggest the price (not the market) is what's stuck; bring a comps-based counter.
Risks & watch-outs
- Watch-outs: built in 1953 — expect roof / HVAC / electrical / plumbing capex.
- Climate carrying-cost: severe wind risk, 99% chance of damaging wind over 30y; extreme-heat days projected 7→23/yr by 2055 (HVAC capex compounding) — expect insurance premiums to compound above CPI over the hold.
Questions for the listing agent
- Built in 1953 — when were the roof, HVAC, electrical panel, plumbing, and water heater last replaced?
- Is there a deadline driving the sale (1031 exchange, divorce, estate, relocation)? That informs how much negotiation room exists.
- What's the average days-on-market for RENTAL listings here right now (not sales)? A rising rental-DOM trend means longer vacancies and softer asking-rent achievability than the comps imply.
- What's the recent tenant-quality profile in this submarket — average credit score on applications, eviction rate, late-payment / NSF rate, and stable-employment percentage? A property-management company in the area should have these aggregated.
- How much new for-sale + rental construction is in the pipeline within 1–3 miles? Heavy new supply typically softens prices + rents 12–24 months out; constrained supply supports both.
Investment metrics
- 1% rule
- 1.65% ✓
- Cap rate
- 12.95%
- Cash-on-cash
- 23.76%
- DSCR
- 2.06
- GRM
- 5.1
CMA / ARV
No comps found within radius.
Projected returns pro-forma
-3.0% appreciation · 1.05% rent growth · sell at horizon
- IRR
- 14.6%
- Equity multiple
- 1.57×
- Total profit
- $12,796
- Equity at exit
- $11,928
- IRR
- 21.8%
- Equity multiple
- 2.68×
- Total profit
- $37,699
- Equity at exit
- $6,917
Cash invested: $22,400 (down + closing). Projections, not guarantees.
Landlord ↔ Tenant lean methodology
- Overall (STATE)
- 87 Strongly Landlord-Friendly
- State Florida
- 87 Strongly Landlord-Friendly · R+3
- County
- — inherits STATE
- City
- — inherits STATE
ZIP-level market 33801
- Home prices YoY
- -15.9%
- Rents YoY
- 1.1%
- Active inventory
- 253
- Price-to-rent
- 5.1×
Monthly cashflow live
- Estimated rent
- $1,319 high interval (Pro) →
- Mortgage (P&I)
- −$420
- Tax from tax record
- −$145 /mo · $1,743/yr
- Insurance
- −$33
- HOA
- −$0
- Vacancy / Maint / Mgmt
- −$277
- Net cashflow
- $444
Break-even live
Sensitivity live
| Price | -10% $489 | -5% $466 | +0% $444 | +5% $421 | +10% $398 |
|---|---|---|---|---|---|
| Rent | -10% $339 | -5% $391 | +0% $444 | +5% $496 | +10% $548 |
| Rate | -1.0pp $484 | -0.5pp $464 | base $444 | +0.5pp $423 | +1.0pp $402 |
UW: 25.0% down · 7.5% · 30yr · 1.5% tax · 5.0% vac · 8.0% maint · 8.0% mgmt
Financing live
Cash to close
- Down payment
- $20,000
- Closing costs
- $2,400
- Reserves months
- —
- Total cash needed
- —
Loan-product check · same deal, 3 products live
Conventional
25% down · 7.5% · 30yr
- Down + closing
- —
- Monthly P&I
- —
- Monthly cashflow
- —
- DSCR
- —
- Eligible?
- —
Personal DTI + credit; lowest rate.
DSCR
20% down · 8.5% · 30yr
- Down + closing
- —
- Monthly P&I
- —
- Monthly cashflow
- —
- DSCR
- —
- Eligible?
- —
No personal income docs; deal must DSCR.
Hard money
10% down · 12.0% · 12mo
- Down + closing
- —
- Monthly P&I
- —
- Monthly cashflow
- —
- DSCR
- —
- Eligible?
- —
Short-term bridge; refi at stabilization.
Rent comps 19 comps
| Address | Beds | Baths | Sqft | Rent | $/sqft | DOM | Units | Dist |
|---|---|---|---|---|---|---|---|---|
| 2184 Colonial Ave Lakeland, FL | 3.0 | 2.0 | 1123 | $1,645 | $1.46 | 24d | 1 | 0.28mi |
| 2248 Weber St Lakeland, FL | 2.0 | 1.0 | 640 | $1,335 | $2.09 | 4d | 1 | 0.65mi |
| 2023 Tennyson St Unit 2025 Lakeland, FL | 2.0 | 1.0 | 884 | $1,095 | $1.24 | 24d | 1 | 0.71mi |
| 2417 Golfview St Lakeland, FL | 3.0 | 1.0 | 798 | $1,395 | $1.75 | 11d | 1 | 0.75mi |
| 832 N Combee Rd Lakeland, FL | 2.0 | 1.0 | 560 | $1,195 | $2.13 | 24d | 1 | 0.84mi |
| 3245 E Main St Lakeland, FL | 2.0 | 1.0 | 750 | $1,100 | $1.47 | 24d | 1 | 0.99mi |
| 3245 E Main St Unit 2 Lakeland, FL | 2.0 | 2.0 | 700 | $1,250 | $1.79 | 15d | 1 | 0.99mi |
| 1736 E Fern Rd Lakeland, FL | 2.0 | 1.0 | 820 | $1,325 | $1.62 | 24d | 1 | 1.08mi |
| 2929 Nine Iron Dr Lakeland, FL | 2.0 | 1.0 | 850 | $875 | $1.03 | 4d | 1 | 1.15mi |
| 2625 Kelly Ln Lakeland, FL | 1.0 | 1.0 | 560 | $1,200 | $2.14 | 24d | 1 | 1.19mi |
| 2839 8 Iron Dr Unit 2841 Lakeland, FL | 2.0 | 1.5 | 900 | $1,397 | $1.55 | 24d | 1 | 1.23mi |
| 2830 Skyview Dr Lakeland, FL | 2.0 | 1.0 | 850 | $1,175 | $1.38 | 24d | 1 | 1.25mi |
| 1505 Goodyear Ave Unit 17 Lakeland, FL | 2.0 | 1.0 | 792 | $950 | $1.20 | 24d | 1 | 1.32mi |
| 1885 N Crystal Lake Dr Apt 7 Lakeland, FL | 2.0 | 1.5 | 900 | $1,395 | $1.55 | 24d | 1 | 1.34mi |
| 1108 Bartow Rd Lakeland, FL | 1.0–2.0 | 1.0 | 797 | $1,395 | $1.75 | 4d | 2 | 1.34mi |
| 1104 Bartow Rd Lakeland, FL | 1.0–2.0 | 1.0 | 760 | $1,225 | $1.61 | 24d | 1 | 1.37mi |
| 2437 Idlewild St Lakeland, FL | 1.0 | 1.0 | 550 | $1,099 | $2.00 | 24d | 1 | 1.37mi |
| 2437 Idlewild St Lakeland, FL | 1.0 | 1.0 | 550 | $1,099 | $2.00 | 15d | 1 | 1.37mi |
| 2415 Idlewild St Lakeland, FL | 2.0 | 1.0 | 900 | $1,300 | $1.44 | 24d | 1 | 1.39mi |
Listing history 2 events
-
2026-06-19remarks 269-char remark
-
2026-06-19$80,000 Active 1 DOM
ⓘ Source: listings_history table (triggers on properties + properties_extension) + one-shot
backfill from property_details.listing_events for pre-trigger history.
Tax reassessment forecast FL · Resets to sale price
- Current annual tax
- $1,743 · $145/mo
- Projected year-2 tax
- $1,743 · $145/mo
- Expected delta
- $0/yr ($0/mo · 0.0%)
ⓘ Screening estimate from a state-policy table — verify with the county assessor before closing.
Climate risk First Street
- Flood 1/10 Low FEMA zone X (unshaded) · 0% chance over 30 yrs
- Wildfire 3/10 Moderate
- Heat 8/10 Severe 7 d/yr ≥108°F today · 23 d/yr by 30 yrs out
- Wind 9/10 Extreme 99% chance of damaging wind over 30 yrs
- Air quality 2/10 Low 1 unhealthy d/yr today · 2 by 30 yrs out
Nearby sold comps map
Loading sold comps map…
Walkable amenities ~0.75 mi
Loading nearby amenities…
Taxation est. · year 1
- Rental income
- $15,822
- − Mortgage interest
- −$4,481
- − Property taxes
- −$1,743
- − Insurance
- −$400
- − Repairs & maintenance
- −$1,266
- − Management
- −$1,266
- − Depreciation
- −$2,327
- Taxable income
- $4,339
- Est. tax owed @ 24.0%
- −$1,041
- After-tax cash flow
- $4,281/yr
For passive investors: Depreciation is non-cash, so a rental often shows a tax loss while cash-flowing — sheltering income. Rental losses are passive: they offset passive income freely, and up to $25,000/yr can offset ordinary (W-2) income if you actively participate and your MAGI is under $100k (phasing out to $0 by $150k); unused losses carry forward. On sale, claimed depreciation is recaptured at up to 25%, and gains may owe capital-gains tax (a 1031 exchange can defer both). Figures are a year-1 estimate at your 24.0% rate — not tax advice; consult a CPA.
Schools (NCES district)
- District
- Polk
- NCES district ID
- 1201590
- Math proficiency
- 39% ▼ -11.00%
- Reading proficiency
- 43% ▼ -4.00%
- Median HH income
- $43,979
- Composite
- 34.74/100
- National rank
- #5132
- State rank
- #62 of 73 in FL
Livability — Crystal Lake
- Score
- 66/100
- State rank
- #620
- US rank
- #12023
Category grades
Schools grade is shown separately in the Schools card above.
Census & demographics
- Census place
- Crystal Lake, FL
- County
- Polk County · 740,051 people
- City population
- 33,460
- Metro
- Lakeland-Winter Haven, FL
- Population (ZIP)
- 35,394
- Household income
- $53,061
- Rent vs Own
- Severe rent burden
- 1291.0
Population outlook (Polk County) Hauer SSP2
- Today (2025)
- 752,975 people
- By 2030
- 804,621 · +6.9%
- By 2040
- 906,117 · +20.3%
- By 2050
- 1,000,476 · +32.9%
- By 2075
- 1,197,520 · +59.0%
- By 2100
- 1,271,518 · +68.9%
Race, ethnicity, and origin ACS 2023
- Neighborhood character
- Diverse neighborhood (Simpson 0.58)
- Race & ethnicity
- White 60% Hispanic / Latino 19% Black 16% Two or more races 8% Asian 1%
- Hispanic origin (detail)
- Mexican 5% Puerto Rican 8% Cuban 3%
- Common ancestry
- Romanian 2% Slovak 2% Lithuanian 1%
- Foreign-born
- 8% · Canada
- Languages at home
- 83% English-only · Spanish 14% French/Haitian/Cajun 1%
Political lean MEDSL · Polk
- 2024 margin
- Strong R (+20.7) · D 39.2% · R 59.9%
- 2008→2024 swing
- -14.6pp toward R · 2008: -6.1pp · 2024: -20.7pp
- All cycles
- 2024: R+20.7 2020: R+14.4 2016: R+14.1 2012: R+6.8 2008: R+6.1
Not yet ingested
- Civics
- —
Market trends
- HPI YoY
- ▼ -70.91%
- Current HPI
- 373.7159
- Rent YoY
- ▲ 1.05%
- Metro
- Lakeland-Winter Haven, FL
- State GDP YoY
- ▲ 3.28%
- F500 in state
- 36
Industry mix (Fortune 500 HQ in FL)
| Industry | F500 HQs | Revenue |
|---|---|---|
| Industrial Technology | 2 | $29B |
|
||
| Insurance | 2 | $17B |
|
||
| Retail | 1 | $60B |
|
||
| Technology Distribution | 1 | $58B |
|
||
| Homebuilding | 1 | $35B |
|
||
| Technology Manufacturing | 1 | $35B |
|
||
Price history
+150.0% since first listed23 events — show timeline
- 2026-06-18 Listed $80,000 Stellar MLS as Distributed by MLS Grid
- 2026-04-26 Rental Removed $1,503 RENTLY
- 2026-03-17 Listed for Rent $1,503 RENTLY
- 2021-12-17 Sold (Public Records) $404,897 Public Records
- 2018-09-20 Listing Removed — Stellar MLS as Distributed by MLS Grid
- 2018-09-19 Price Changed $79,900 Stellar MLS as Distributed by MLS Grid
- 2018-09-10 Relisted — Stellar MLS as Distributed by MLS Grid
- 2018-09-09 Listing Removed — Stellar MLS as Distributed by MLS Grid
- 2018-08-08 Price Changed $87,900 Stellar MLS as Distributed by MLS Grid
- 2018-08-07 Relisted — Stellar MLS as Distributed by MLS Grid
- 2018-08-02 Sold (Public Records) $65,000 Public Records
- 2018-07-26 Listing Removed — Stellar MLS as Distributed by MLS Grid
- 2018-07-11 Price Changed $89,900 Stellar MLS as Distributed by MLS Grid
- 2018-07-02 Price Changed $95,000 Stellar MLS as Distributed by MLS Grid
- 2018-06-21 Price Changed $98,900 Stellar MLS as Distributed by MLS Grid
- 2018-06-12 Listed $99,900 Stellar MLS as Distributed by MLS Grid
- 2018-06-07 Listing Removed — Stellar MLS as Distributed by MLS Grid
- 2018-05-14 Price Changed $99,900 Stellar MLS as Distributed by MLS Grid
- 2018-05-14 Relisted — Stellar MLS as Distributed by MLS Grid
- 2018-05-08 Pending — Stellar MLS as Distributed by MLS Grid
- 2018-05-02 Listed $89,900 Stellar MLS as Distributed by MLS Grid
- 2016-05-20 Sold (Public Records) $26,000 Public Records
- 1994-07-28 Sold (Public Records) $32,000 Public Records
Property tax history
+18.6%/yrLatest (2025): $1,743 · +5.1% YoY. Source: county tax records.
Cash-flow waterfall
monthlySold comps — $/sqft
last 12 mo · ≤1 miLoading sold comps…