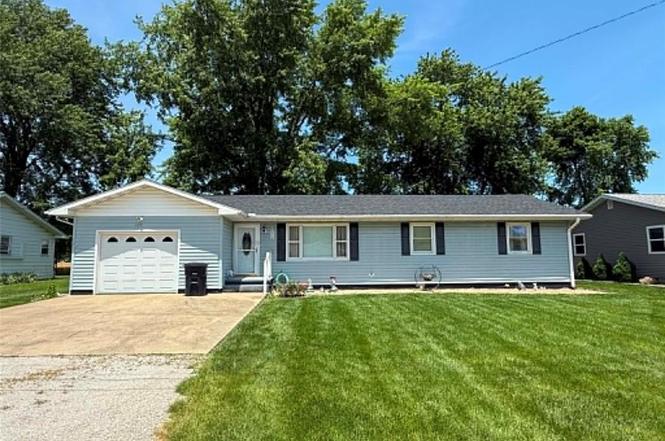
337 E 1st St · Ramsey, IL
Flood risk 1/10 · Minimal
- FEMA flood zone
- —
- Chance of flooding over 30 yrs
- 0.0%
- Est. flood insurance / yr
- —
Fire risk 1/10 · Minimal
- Est. fire insurance / yr
- $804 – $1,492
Heat risk 4/10 · Minor
- Hot days now (above 104°F)
- 7 days/yr
- Hot days in 30 yrs
- 20 days/yr
Wind risk 2/10 · Minimal
- Chance of severe wind over 30 yrs
- 3.0%
Air-quality risk 2/10 · Minimal
- Unhealthy air days now
- 1 days/yr
- Unhealthy air days in 30 yrs
- 2 days/yr
Risk factors via First Street. Map © Google.
Why this score? — see what drove the B grade
The composite is a weighted blend of 9 inputs, each scored 0–100. Each bar is that input's sub-score; the figure is the points it added to the 100-point composite (weight × sub-score).
- Cash flow +30.0/30.0
- DSCR +10.0/10.0
- 1% rule +8.4/10.0
- Appreciation +7.6/10.0
- ARV discount +7.5/15.0
- Livability +3.1/5.0
- Schools +2.7/10.0
- Rent growth +2.5/5.0
- Condition / age +2.5/5.0
$87,500
🖨 Deal sheet 📄 Offer letter ✓ Due diligence
Listing remarks
This well-maintained home has been lovingly cared for and is ready for its next owner. Featuring 3 spacious bedrooms and 1.5 bathrooms, there is plenty of room for comfortable everyday living. Step outside and enjoy the large backyard that backs up to an open field, offering peaceful views and added privacy. Recent improvements include a roof replacement approximately two years ago, along with a vapor barrier and dehumidifiers in the crawl space for added peace of mind. All appliances will remain with the home, including the refrigerator, stove, washer, and dryer, making your move even easier. Priced to sell and offering exceptional value, this is an opportunity you won't want to miss. Sche
Key facts
- Vapor barrier
- Large backyard
- Open field views
Tags
Property features AI
Finance
- Financial info: Private ownership; Lease not considered
Exterior
- Parking: Attached garage (1 car)
- Utilities: Public water; Public sewer; Electricity connected (single phase); Natural gas available
- Home design: Single-family residence; One story
- Construction: Vinyl siding; Architectural shingle roof
- Exterior features: City lot; Level lot; Lot dimensions approximately 84 x 120
Interior
- Kitchen: Kitchen (11 x 13)
- Bedrooms: Three bedrooms, all on the main level; Bedroom (14 x 10); Bedroom (14 x 13); Third bedroom (11 x 12)
- Bathrooms: One full bathroom on the main level (5 x 10); One half bathroom on the main level (3 x 5)
- Heating & cooling: Forced air heating; Central air conditioning
- Interior features: Nine total rooms; Dining room (12 x 13); Storage room off the garage for seasonal items (15 x 6)
- Laundry & utility: Laundry room (12 x 7)
Neighborhood map
What this means for you Summary
Snapshot
- This is a 3-bed/2.0-bath other listed at $88k.
Deal economics
- At list price, monthly cash flow is $395 ($5k/yr) — positive.
- The deal already cash-flows at list — no discount required.
- Meets the 1% rule at list price ($1k rent vs $88k).
Location & tenants
- Location reads 62/100 on livability (#887 in IL) — a middle-class / working-renter tenant base. Strengths: cost of living A+, housing A-; Watch: crime D-, amenities F, commute F.
- Ramsey CUSD 204 (rural): math 23% / reading 42% proficiency, ranked #233 of 620 in IL (top 38%) — families likely to look elsewhere, expect single-tenant / working-renter base with shorter leases.
- Zoned schools: Ramsey High School (math 22% / reading 37%, grade F, #187 of 693 statewide, top 30%, 206 students, 0% FRL) — zoned schools average 0% FRL vs 48% district-wide (48 pts lower); this property's tenant base skews higher-income than the district average.
- Market conditions: 8 active listings in the ZIP.
Forward outlook
- In year one you build about $5k of equity ($605 loan paydown + $5k appreciation (5.2% local appreciation)).
- Fayette County population projected to shrink 9% by 2050 — rents likely to lag national; underwrite the cash flow, not the appreciation.
- At projected returns (5.2% appreciation + 3.0% rent growth), your $24k cash investment doubles in ~3 years — after that, you're playing with house money.
- By year 7, paydown + projected appreciation supports a ~$33k cash-out refi (75% LTV) — recoverable capital for the next deal without selling this one.
Negotiation context
- Only 8 days on market — expect competitive offers; lowballing is unlikely to land.
Questions for the listing agent
- Built in 1973 — when were the roof, HVAC, electrical panel, plumbing, and water heater last replaced?
- Is there a deadline driving the sale (1031 exchange, divorce, estate, relocation)? That informs how much negotiation room exists.
- Schools are F-rated, which usually means shorter tenancies and higher turnover. Who's the typical renter profile here, and what's been the actual vacancy rate?
- Crime grade is D in this area — have there been break-ins, vandalism, or insurance claims at this property in the last 3 years? What carrier currently insures it and at what premium?
- What's the average days-on-market for RENTAL listings here right now (not sales)? A rising rental-DOM trend means longer vacancies and softer asking-rent achievability than the comps imply.
- What's the recent tenant-quality profile in this submarket — average credit score on applications, eviction rate, late-payment / NSF rate, and stable-employment percentage? A property-management company in the area should have these aggregated.
- How much new for-sale + rental construction is in the pipeline within 1–3 miles? Heavy new supply typically softens prices + rents 12–24 months out; constrained supply supports both.
Investment metrics
- 1% rule
- 1.34% ✓
- Cap rate
- 11.71%
- Cash-on-cash
- 19.35%
- DSCR
- 1.86
- GRM
- 6.2
CMA / ARV
No comps found within radius.
Projected returns pro-forma
5.17% appreciation · 3.0% rent growth · sell at horizon
- IRR
- 30.0%
- Equity multiple
- 2.88×
- Total profit
- $46,154
- Equity at exit
- $50,496
- IRR
- 28.5%
- Equity multiple
- 5.79×
- Total profit
- $117,339
- Equity at exit
- $87,911
Cash invested: $24,500 (down + closing). Projections, not guarantees.
Landlord ↔ Tenant lean methodology
- Overall (STATE)
- 43 Moderately Tenant-Leaning
- State Illinois
- 43 Moderately Tenant-Leaning · D+7
- County
- — inherits STATE
- City
- — inherits STATE
ZIP-level market 62080
- Home prices YoY
- 3.3%
- Active inventory
- 8
- Price-to-rent
- 6.2×
Monthly cashflow live
- Estimated rent
- $1,169 medium interval (Pro) →
- Mortgage (P&I)
- −$459
- Tax from tax record
- −$33 /mo · $393/yr
- Insurance
- −$36
- HOA
- −$0
- Vacancy / Maint / Mgmt
- −$245
- Net cashflow
- $395
Break-even live
UW: 25.0% down · 7.5% · 30yr · 1.5% tax · 5.0% vac · 8.0% maint · 8.0% mgmt
Financing live
Cash to close
- Down payment
- $21,875
- Closing costs
- $2,625
- Reserves months
- —
- Total cash needed
- —
Loan-product check · same deal, 3 products live
Conventional
25% down · 7.5% · 30yr
- Down + closing
- —
- Monthly P&I
- —
- Monthly cashflow
- —
- DSCR
- —
- Eligible?
- —
Personal DTI + credit; lowest rate.
DSCR
20% down · 8.5% · 30yr
- Down + closing
- —
- Monthly P&I
- —
- Monthly cashflow
- —
- DSCR
- —
- Eligible?
- —
No personal income docs; deal must DSCR.
Hard money
10% down · 12.0% · 12mo
- Down + closing
- —
- Monthly P&I
- —
- Monthly cashflow
- —
- DSCR
- —
- Eligible?
- —
Short-term bridge; refi at stabilization.
Listing history 8 events
-
2026-06-18days on market $87,500 Active 8 DOM
-
2026-06-17status $87,500 Active 7 DOM
-
2026-06-17days on market $87,500 Active Under Contract 7 DOM
-
2026-06-16days on market $87,500 Active Under Contract 6 DOM
-
2026-06-15days on market $87,500 Active Under Contract 5 DOM
-
2026-06-13days on market $87,500 Active Under Contract 3 DOM
-
2026-06-12remarks 699-char remark
-
2026-06-12$87,500 Active Under Contract 2 DOM
ⓘ Source: listings_history table (triggers on properties + properties_extension) + one-shot
backfill from property_details.listing_events for pre-trigger history.
Tax reassessment forecast IL · Partial reset (capped growth)
- Current annual tax
- $393 · $33/mo
- Projected year-2 tax
- $1,190 · $99/mo
- Expected delta
- +$796/yr (+$66/mo · 202.5%)
ⓘ Screening estimate from a state-policy table — verify with the county assessor before closing.
Climate risk First Street
- Flood 1/10 Low 0% chance over 30 yrs
- Wildfire 1/10 Low
- Heat 4/10 Moderate 7 d/yr ≥104°F today · 20 d/yr by 30 yrs out
- Wind 2/10 Low 3% chance of damaging wind over 30 yrs
- Air quality 2/10 Low 1 unhealthy d/yr today · 2 by 30 yrs out
Nearby sold comps map
Loading sold comps map…
Walkable amenities ~0.75 mi
Loading nearby amenities…
Taxation est. · year 1
- Rental income
- $14,022
- − Mortgage interest
- −$4,901
- − Property taxes
- −$393
- − Insurance
- −$438
- − Repairs & maintenance
- −$1,122
- − Management
- −$1,122
- − Depreciation
- −$2,545
- Taxable income
- $3,501
- Est. tax owed @ 24.0%
- −$840
- After-tax cash flow
- $3,900/yr
For passive investors: Depreciation is non-cash, so a rental often shows a tax loss while cash-flowing — sheltering income. Rental losses are passive: they offset passive income freely, and up to $25,000/yr can offset ordinary (W-2) income if you actively participate and your MAGI is under $100k (phasing out to $0 by $150k); unused losses carry forward. On sale, claimed depreciation is recaptured at up to 25%, and gains may owe capital-gains tax (a 1031 exchange can defer both). Figures are a year-1 estimate at your 24.0% rate — not tax advice; consult a CPA.
Schools (NCES district)
- District
- Ramsey CUSD 204
- NCES district ID
- 1733090
- Math proficiency
- 23% ▼ -6.00%
- Reading proficiency
- 42% ▼ -2.00%
- Median HH income
- $39,290
- Composite
- 27.18/100
- National rank
- #7023
- State rank
- #233 of 620 in IL
Livability — Ramsey
- Score
- 62/100
- State rank
- #887
- US rank
- #17279
Category grades
Schools grade is shown separately in the Schools card above.
Census & demographics
- Census place
- Ramsey, IL
- City population
- 3,056
- Population (ZIP)
- 3,056
Population outlook (Fayette County) Hauer SSP2
- Today (2025)
- 21,667 people
- By 2030
- 21,362 · -1.4%
- By 2040
- 20,602 · -4.9%
- By 2050
- 19,669 · -9.2%
- By 2075
- 16,870 · -22.1%
- By 2100
- 12,861 · -40.6%
Race, ethnicity, and origin ACS 2023
- Neighborhood character
- Predominantly White (89%)
- Race & ethnicity
- White 89% Two or more races 10% Hispanic / Latino 5%
- Common ancestry
- Lithuanian 4% Romanian 2% Iranian 1%
- Foreign-born
- 0%
- Languages at home
- 99% English-only · Spanish 1%
Political lean MEDSL · Fayette
- 2024 margin
- Solid R (+64.7) · D 17.0% · R 81.7% · Other 1.3%
- 2008→2024 swing
- -48.9pp toward R · 2008: -15.8pp · 2024: -64.7pp
- All cycles
- 2024: R+64.7 2020: R+61.8 2016: R+58.3 2012: R+34.6 2008: R+15.8
Not yet ingested
- Civics
- —
Market trends
- HPI YoY
- ▲ 5.17%
- Current HPI
- 163.3277
- Rent YoY
- —
- Metro
- —
- State GDP YoY
- ▲ 1.59%
- F500 in state
- 60
Industry mix (Fortune 500 HQ in IL)
| Industry | F500 HQs | Revenue |
|---|---|---|
| Insurance | 4 | $201B |
|
||
| Consumer Goods | 4 | $87B |
|
||
| Industrial Machinery | 3 | $64B |
|
||
| Healthcare | 2 | $55B |
|
||
| Retail / Pharmacy | 1 | $148B |
|
||
| Agriculture / Food | 1 | $86B |
|
||
Price history
+0.0% since first listed3 events — show timeline
- 2026-06-12 Contingent — MARIS as Distributed by MLS Grid
- 2026-06-11 Listed $87,500 MARIS as Distributed by MLS Grid
- 2026-06-10 Coming Soon $87,500 MARIS as Distributed by MLS Grid
Property tax history
-2.0%/yrLatest (2024): $393 · -2.4% YoY. Source: county tax records.
Cash-flow waterfall
monthlySold comps — $/sqft
last 12 mo · ≤1 miLoading sold comps…