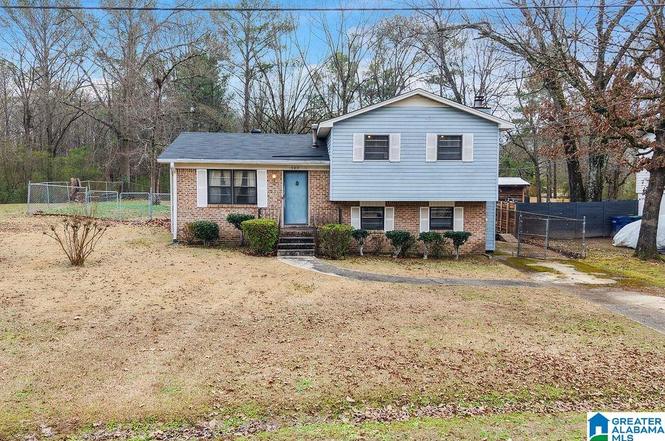
505 Regent Dr · Alabaster, AL
Flood risk 1/10 · Minimal
- FEMA flood zone
- X (unshaded)
- Chance of flooding over 30 yrs
- 0.0%
- Est. flood insurance / yr
- $473 – $860
Fire risk 3/10 · Minor
- Est. fire insurance / yr
- $916 – $1,700
Heat risk 6/10 · Moderate
- Hot days now (above 107°F)
- 7 days/yr
- Hot days in 30 yrs
- 18 days/yr
Wind risk 6/10 · Moderate
- Chance of severe wind over 30 yrs
- 46.0%
Air-quality risk 2/10 · Minimal
- Unhealthy air days now
- 2 days/yr
- Unhealthy air days in 30 yrs
- 2 days/yr
Risk factors via First Street. Map © Google.
Why this score? — see what drove the B- grade
The composite is a weighted blend of 9 inputs, each scored 0–100. Each bar is that input's sub-score; the figure is the points it added to the 100-point composite (weight × sub-score).
- Cash flow +23.6/30.0
- ARV discount +15.0/15.0
- DSCR +7.6/10.0
- 1% rule +6.1/10.0
- Schools +3.9/10.0
- Livability +3.8/5.0
- Rent growth +3.0/5.0
- Condition / age +2.5/5.0
- Appreciation +0.0/10.0
$150,000
🖨 Deal sheet 📄 Offer letter ✓ Due diligence
Listing remarks
Home qualifies for 100% financning and in the Alabaster School zone. This charming 3-bed, 1.5 bath split-level home offers a solid layout and a great opportunity for a buyer ready to make it their own. Featuring a classic brick and vinyl exterior, the home sits on a spacious lot with mature trees, providing both privacy and curb appeal. Inside, you’ll find a functional floor plan with generous living space, durable flooring, and plenty of natural light. The main living area flows easily into the kitchen, creating a comfortable space for everyday living or entertaining. The home presents a fantastic value for first-time buyers, investors, or anyone looking to personalize a property wit
Key facts
- Natural light
- Spacious lot
- Mature trees
Tags
Neighborhood map
What this means for you Summary
Snapshot
- This is a 3-bed/2.0-bath single-family listed at $150k.
Deal economics
- At list price, monthly cash flow is $282 ($3k/yr) — positive.
- The deal already cash-flows at list — no discount required.
- Meets the 1% rule at list price ($2k rent vs $150k).
- Recommended offer: $141k (6.0% below list) — sets the bar for market timing.
- Cap rate 8.5% vs local median 4.1% in Alabaster — top-decile yield for the area; either an underpriced asset or a hidden risk that comps aren't pricing in. Stress-test before assuming the spread holds.
Location & tenants
- Location reads 76/100 on livability (#14 in AL, #3,512 nationally) — a middle-class / working-renter tenant base. Strengths: employment A+, cost of living A+, housing A+; Watch: amenities D-, commute F, health & safety F.
- Alabaster City (suburban): math 30% / reading 57% proficiency, ranked #17 of 129 in AL (top 13%) — families likely to look elsewhere, expect single-tenant / working-renter base with shorter leases.
- Zoned schools: Creek View Elementary School (math 56% / reading 71%, grade B, #46 of 627 statewide, top 8%, 946 students, 48% FRL); Thompson High School (math 34% / reading 38%, grade F, #43 of 305 statewide, top 14%, 2,203 students, 48% FRL) — zoned schools average 48% FRL vs 31% district-wide (17 pts higher); higher-poverty schools than district average — tighter screening recommended.
- Market conditions: Rents rising (+2.2%/yr); 226 active listings in the ZIP; 4 comparable units currently listed for rent nearby; rentals lingering (median 44d on market — plan ~5-8 weeks vacancy on turnover, expect pricing pressure); 50% of comp listings sitting > 30 days — soft ceiling on asking rent; solid renter incomes; 987 units permitted in Shelby County in 2024 (0 in 5+ unit buildings).
Forward outlook
- Local home prices are declining (-3.0%/yr); year-one equity from $1k of loan paydown is wiped out by about $4k of value loss. Plan a longer hold.
- Shelby County population projected at +23% by 2050 — long-run rental-demand tailwind backs the buy-and-hold thesis.
Negotiation context
- It's been on market 82 days — a 6% lower offer ($141k) is reasonable based on typical stale-listing flexibility.
- 2 sale attempts; this cycle's ask has dropped $25k (14%) from the opening price — seller is motivated, your offer sets the floor, not the list.
Risks & watch-outs
- Climate carrying-cost: major wind risk, 46% chance of damaging wind over 30y; extreme-heat days projected 7→18/yr by 2055 (HVAC capex compounding) — expect insurance premiums to compound above CPI over the hold.
Questions for the listing agent
- It's been on market 82 days. Have you received any prior offers? Is the seller open to a 6% concession, seller financing, or rate buy-down credit?
- Built in 1971 — when were the roof, HVAC, electrical panel, plumbing, and water heater last replaced?
- Why hasn't it sold? Are there any deal-killer items the seller is aware of (foundation, flood, title, zoning, code violations)?
- Is there a deadline driving the sale (1031 exchange, divorce, estate, relocation)? That informs how much negotiation room exists.
- Schools are B-rated — typically a magnet for longer-tenancy family renters. What's the average tenant stay here, and is there a school-zone premium baked into asking?
- What's the average days-on-market for RENTAL listings here right now (not sales)? A rising rental-DOM trend means longer vacancies and softer asking-rent achievability than the comps imply.
- What's the recent tenant-quality profile in this submarket — average credit score on applications, eviction rate, late-payment / NSF rate, and stable-employment percentage? A property-management company in the area should have these aggregated.
- How much new for-sale + rental construction is in the pipeline within 1–3 miles? Heavy new supply typically softens prices + rents 12–24 months out; constrained supply supports both.
Investment metrics
- 1% rule
- 1.11% ✓
- Cap rate
- 8.55%
- Cash-on-cash
- 8.06%
- DSCR
- 1.36
- GRM
- 7.5
CMA / ARV
- ARV (on-the-fly)
- $214,312
- Comps found
- 8
Show comp detail 8 sales within ~0.75 mi
| Address | Dist | Beds/Ba | Sqft | Sold | Price | $/sf | Match |
|---|---|---|---|---|---|---|---|
| 181 Reese Dr | 0.49mi | 3/2.0 | 1,200 (-0%) | 14mo | $207,000 | $173 | 65 |
| 209 Ironwood Cir | 0.56mi | 3/2.0 | 1,273 (+6%) | 3mo | $218,000 | $171 | 62 |
| 153 Reese Dr | 0.57mi | 3/2.0 | 1,256 (+4%) | 8mo | $225,000 | $179 | 60 |
| 158 Reese Dr | 0.57mi | 3/2.0 | 1,300 (+8%) | 2mo | $232,000 | $178 | 59 |
| 301 Park Rd | 0.46mi | 3/2.0 | 1,268 (+5%) | 16mo | $225,000 | $177 | 56 |
| 101 Reese Dr | 0.63mi | 3/2.0 | 1,317 (+9%) | 1mo | $245,000 | $186 | 54 |
| 100 Reese Dr | 0.65mi | 3/2.0 | 1,273 (+6%) | 24mo | $230,000 | $181 | 40 |
| 120 Warwick Cir | 0.68mi | 2/2.0 (-1) | 1,305 (+8%) | 24mo | $226,000 | $173 | 30 |
Match score weights: distance 35% · size 25% · config 20% · recency 20%. Top-matched comps best support the ARV.
Projected returns pro-forma
-3.0% appreciation · 2.16% rent growth · sell at horizon
- IRR
- -5.0%
- Equity multiple
- 0.82×
- Total profit
- $-7,712
- Equity at exit
- $22,365
- IRR
- 3.7%
- Equity multiple
- 1.26×
- Total profit
- $10,879
- Equity at exit
- $12,969
Cash invested: $42,000 (down + closing). Projections, not guarantees.
Landlord ↔ Tenant lean methodology
- Overall (STATE)
- 90 Strongly Landlord-Friendly
- State Alabama
- 90 Strongly Landlord-Friendly · R+15
- County
- — inherits STATE
- City
- — inherits STATE
ZIP-level market 35007
- Home prices YoY
- -35.0%
- Rents YoY
- 2.2%
- Active inventory
- 226
- Price-to-rent
- 7.5×
Monthly cashflow live
- Estimated rent
- $1,669 medium interval (Pro) →
- Mortgage (P&I)
- −$787
- Tax est. 1.5%
- −$188 /mo · $2,250/yr
- Insurance
- −$62
- HOA
- −$0
- Vacancy / Maint / Mgmt
- −$351
- Net cashflow
- $282
Break-even live
UW: 25.0% down · 7.5% · 30yr · 1.5% tax · 5.0% vac · 8.0% maint · 8.0% mgmt
Financing live
Cash to close
- Down payment
- $37,500
- Closing costs
- $4,500
- Reserves months
- —
- Total cash needed
- —
Loan-product check · same deal, 3 products live
Conventional
25% down · 7.5% · 30yr
- Down + closing
- —
- Monthly P&I
- —
- Monthly cashflow
- —
- DSCR
- —
- Eligible?
- —
Personal DTI + credit; lowest rate.
DSCR
20% down · 8.5% · 30yr
- Down + closing
- —
- Monthly P&I
- —
- Monthly cashflow
- —
- DSCR
- —
- Eligible?
- —
No personal income docs; deal must DSCR.
Hard money
10% down · 12.0% · 12mo
- Down + closing
- —
- Monthly P&I
- —
- Monthly cashflow
- —
- DSCR
- —
- Eligible?
- —
Short-term bridge; refi at stabilization.
Rent comps 4 comps
| Address | Beds | Baths | Sqft | Rent | $/sqft | DOM | Units | Dist |
|---|---|---|---|---|---|---|---|---|
| 403 3rd St NE Unit 422 Alabaster, AL | 2.0 | 1.0 | 845 | $1,250 | $1.48 | 44d | 1 | 0.57mi |
| 403 3rd St NE Unit 508 Alabaster, AL | 3.0 | 2.0 | 900 | $1,350 | $1.50 | 44d | 1 | 0.57mi |
| 1500 Windsor Ct Alabaster, AL | 1.0–2.0 | 1.0–2.0 | 1058 | $1,351 | $1.28 | 2d | 10 | 1.35mi |
| 955 3rd Ave NW Alabaster, AL | 3.0 | 2.0 | 1363 | $1,875 | $1.38 | 3d | 1 | 1.39mi |
Listing history 5 events
-
2026-04-16status Pending
-
2026-04-12status Active
-
2026-04-11price $150,000
-
2026-01-30historical Contingent
-
2026-01-24$175,000 Active
ⓘ Source: listings_history table (triggers on properties + properties_extension) + one-shot
backfill from property_details.listing_events for pre-trigger history.
Climate risk First Street
- Flood 1/10 Low FEMA zone X (unshaded) · 0% chance over 30 yrs
- Wildfire 3/10 Moderate
- Heat 6/10 Major 7 d/yr ≥107°F today · 18 d/yr by 30 yrs out
- Wind 6/10 Major 46% chance of damaging wind over 30 yrs
- Air quality 2/10 Low 2 unhealthy d/yr today · 2 by 30 yrs out
Nearby sold comps map
Loading sold comps map…
Walkable amenities ~0.75 mi
Loading nearby amenities…
Taxation est. · year 1
- Rental income
- $20,031
- − Mortgage interest
- −$8,402
- − Property taxes
- −$2,250
- − Insurance
- −$750
- − Repairs & maintenance
- −$1,603
- − Management
- −$1,603
- − Depreciation
- −$4,364
- Taxable income
- $1,060
- Est. tax owed @ 24.0%
- −$255
- After-tax cash flow
- $3,131/yr
For passive investors: Depreciation is non-cash, so a rental often shows a tax loss while cash-flowing — sheltering income. Rental losses are passive: they offset passive income freely, and up to $25,000/yr can offset ordinary (W-2) income if you actively participate and your MAGI is under $100k (phasing out to $0 by $150k); unused losses carry forward. On sale, claimed depreciation is recaptured at up to 25%, and gains may owe capital-gains tax (a 1031 exchange can defer both). Figures are a year-1 estimate at your 24.0% rate — not tax advice; consult a CPA.
Schools (NCES district)
- District
- Alabaster City
- NCES district ID
- 0100190
- Math proficiency
- 30% ▼ -27.00%
- Reading proficiency
- 57% ▲ 5.00%
- Median HH income
- $68,690
- Composite
- 39.07/100
- National rank
- #4052
- State rank
- #17 of 129 in AL
Livability — Alabaster
- Score
- 76/100
- State rank
- #14
- US rank
- #3512
Category grades
Schools grade is shown separately in the Schools card above.
Census & demographics
- Census place
- Alabaster, AL
- County
- Shelby County · 188,970 people
- City population
- 28,586
- Metro
- Birmingham-Hoover, AL
- Population (ZIP)
- 28,586
- Household income
- $88,505
- Rent vs Own
- Severe rent burden
- 325.0
Population outlook (Shelby County) Hauer SSP2
- Today (2025)
- 237,024 people
- By 2030
- 249,868 · +5.4%
- By 2040
- 272,778 · +15.1%
- By 2050
- 291,062 · +22.8%
- By 2075
- 326,049 · +37.6%
- By 2100
- 335,870 · +41.7%
Race, ethnicity, and origin ACS 2023
- Neighborhood character
- Predominantly White (69%)
- Race & ethnicity
- White 69% Black 14% Hispanic / Latino 13% Two or more races 6% Asian 2%
- Hispanic origin (detail)
- Mexican 6% Cuban 1%
- Common ancestry
- Italian 3% Serbian 2% Lithuanian 1%
- Foreign-born
- 6% · Canada, China
- Languages at home
- 90% English-only · Spanish 8% Chinese 1%
Political lean MEDSL · Shelby
- 2024 margin
- Solid R (+40.9) · D 29.0% · R 69.9% · Other 1.1%
- 2008→2024 swing
- +12.6pp toward D · 2008: -53.4pp · 2024: -40.9pp
- All cycles
- 2024: R+40.9 2020: R+40.4 2016: R+50.3 2012: R+55.6 2008: R+53.4
Not yet ingested
- Civics
- —
Market trends
- HPI YoY
- ▼ -113.63%
- Current HPI
- 211.0691
- Rent YoY
- ▲ 2.16%
- Metro
- Birmingham-Hoover, AL
- State GDP YoY
- ▲ 2.94%
- F500 in state
- 4
Industry mix (Fortune 500 HQ in AL)
| Industry | F500 HQs | Revenue |
|---|---|---|
| Financial Services | 1 | $8B |
|
||
| Healthcare | 1 | $5B |
|
||
Price history
-14.3% since first listed5 events — show timeline
- 2026-04-16 Pending — Greater Alabama MLS
- 2026-04-12 Relisted — Greater Alabama MLS
- 2026-04-11 Price Changed $150,000 Greater Alabama MLS
- 2026-01-30 Contingent — Greater Alabama MLS
- 2026-01-24 Listed $175,000 Greater Alabama MLS
Cash-flow waterfall
monthlySold comps — $/sqft
last 12 mo · ≤1 miLoading sold comps…