 🏷️ Likely Rental
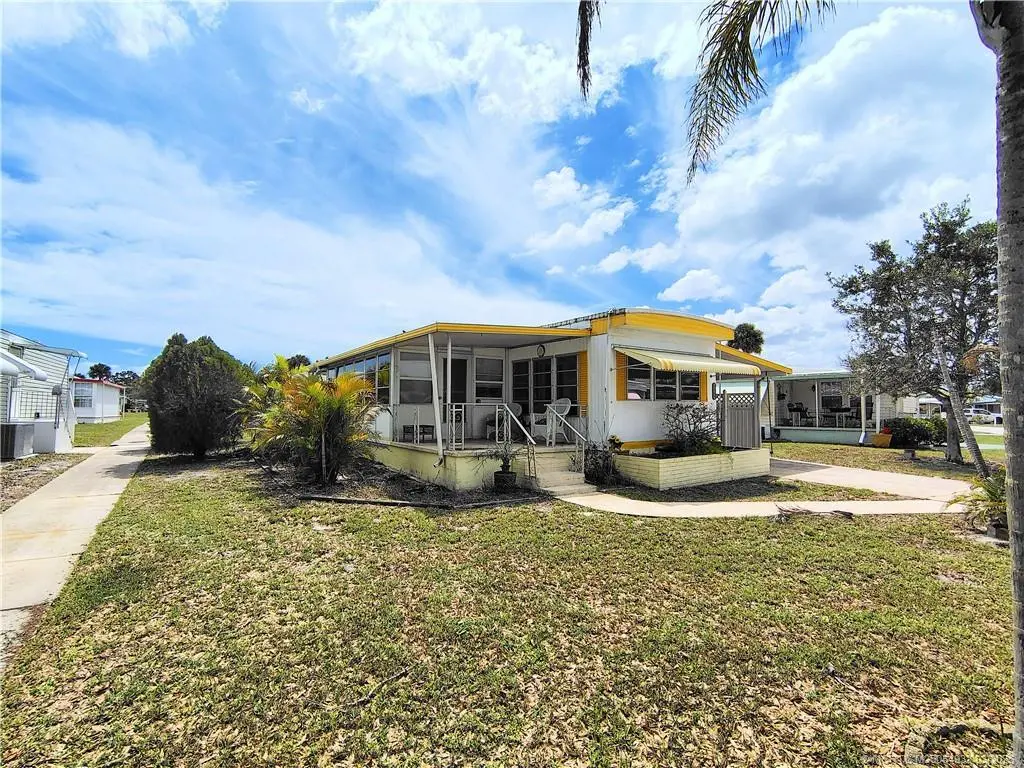
2465 SE Penny Ln · Stuart, FL
Flood risk 4/10 · Minor
- FEMA flood zone
- X (unshaded)
- Chance of flooding over 30 yrs
- 0.21%
- Est. flood insurance / yr
- $507 – $1,088
Fire risk 1/10 · Minimal
- Est. fire insurance / yr
- $947 – $1,759
Heat risk 10/10 · Severe
- Hot days now (above 106°F)
- 7 days/yr
- Hot days in 30 yrs
- 23 days/yr
Wind risk 10/10 · Severe
- Chance of severe wind over 30 yrs
- 99.0%
Air-quality risk 2/10 · Minimal
- Unhealthy air days now
- 1 days/yr
- Unhealthy air days in 30 yrs
- 1 days/yr
Risk factors via First Street. Map © Google.
Why this score? — see what drove the B+ grade
The composite is a weighted blend of 9 inputs, each scored 0–100. Each bar is that input's sub-score; the figure is the points it added to the 100-point composite (weight × sub-score).
- Cash flow +30.0/30.0
- ARV discount +15.0/15.0
- 1% rule +10.0/10.0
- DSCR +10.0/10.0
- Schools +4.5/10.0
- Livability +4.2/5.0
- Condition / age +2.5/5.0
- Rent growth +2.3/5.0
- Appreciation +0.0/10.0
$84,000
🖨 Deal sheet (PDF) 📄 Offer letter ✓ Due diligence
Listing remarks MLS
Great remodeled 2 bedroom 2 bath home. Pass thru from kitchen to dining area. Leisure village co-op is an active adult community with a great heated pool. maintenance fee is only $275 per month and includes water, sewer, lawn, trash removal, cable tv, clubhouse, bocci, shuffleboard Come join the fun
Key facts
- Remodeled
- Heated pool
- 4,922 sq ft lot
Tags
Neighborhood map
What this means for you Summary
Snapshot
- This is a 2-bed/2.0-bath condo listed at $84k.
Deal economics
- At list price, monthly cash flow is $784 ($9k/yr) — positive.
- The deal already cash-flows at list — no discount required.
- Meets the 1% rule at list price ($2k rent vs $84k).
- Recommended offer: $79k (6.0% below list) — sets the bar for market timing.
- Cap rate 17.5% vs local median 4.1% in Stuart — top-decile yield for the area; either an underpriced asset or a hidden risk that comps aren't pricing in. Stress-test before assuming the spread holds.
Location & tenants
- Location reads 84/100 on livability (#39 in FL, #790 nationally) — a professional / high-income tenant draw. Strengths: commute A+, housing A+, health & safety A+; Watch: crime C-, employment C-, amenities D.
- Martin (suburban): math 52% / reading 53% proficiency, ranked #24 of 73 in FL (top 33%) — acceptable for families but not a draw, mixed tenant base, ~2y average lease.
- Zoned schools: Pinewood Elementary School (math 37% / reading 39%, grade F, #1,587 of 2,144 statewide, top 74%, 726 students, 64% FRL); Dr. David L. Anderson Middle School (math 51% / reading 46%, grade C-, #274 of 571 statewide, top 50%, 1,035 students, 63% FRL); Martin County High School (math 45% / reading 54%, grade D, #179 of 667 statewide, top 29%, 2,273 students, 42% FRL) — zoned schools average 56% FRL vs 41% district-wide (16 pts higher); higher-poverty schools than district average — tighter screening recommended.
- Market conditions: Rents soft (-0.7%/yr); 259 active listings in the ZIP; 9 comparable units currently listed for rent nearby; rentals at typical pace (median 16d on market — plan ~3-4 weeks tenant-placement turnaround); 737 units permitted in Martin County in 2024 (167 in 5+ unit buildings).
- This rent runs 39% of the median local income ($63k/yr) — at the standard rent-burdened threshold; future hikes will face affordability resistance.
Forward outlook
- Local home prices are declining (-3.0%/yr); year-one equity from $581 of loan paydown is wiped out by about $3k of value loss. Plan a longer hold.
- Martin County population projected at +19% by 2050 — long-run rental-demand tailwind backs the buy-and-hold thesis.
- At projected returns (-3.0% appreciation + 0.0% rent growth), your $24k cash investment doubles in ~4 years — after that, you're playing with house money.
Negotiation context
- It's been on market 90 days — a 6% lower offer ($79k) is reasonable based on typical stale-listing flexibility.
- 2 sale attempts since 6y ago with the ask held roughly flat each time — persistent listings suggest the price (not the market) is what's stuck; bring a comps-based counter.
Risks & watch-outs
- Climate carrying-cost: severe wind risk, 99% chance of damaging wind over 30y; extreme-heat days projected 7→23/yr by 2055 (HVAC capex compounding) — expect insurance premiums to compound above CPI over the hold.
Questions for the listing agent
- It's been on market 90 days. Have you received any prior offers? Is the seller open to a 6% concession, seller financing, or rate buy-down credit?
- Built in 1970 — when were the roof, HVAC, electrical panel, plumbing, and water heater last replaced?
- What does the HOA fee cover, when was the last increase, and are there any pending special assessments or reserve-fund shortfalls?
- Any open or pending special assessments — roof, HVAC, plumbing, elevator, façade? What's the per-unit balance and payoff schedule, and is the seller paying it off at close or rolling it to the buyer?
- Why hasn't it sold? Are there any deal-killer items the seller is aware of (foundation, flood, title, zoning, code violations)?
- Is there a deadline driving the sale (1031 exchange, divorce, estate, relocation)? That informs how much negotiation room exists.
- Schools are A-rated — typically a magnet for longer-tenancy family renters. What's the average tenant stay here, and is there a school-zone premium baked into asking?
- What's the average days-on-market for RENTAL listings here right now (not sales)? A rising rental-DOM trend means longer vacancies and softer asking-rent achievability than the comps imply.
- What's the recent tenant-quality profile in this submarket — average credit score on applications, eviction rate, late-payment / NSF rate, and stable-employment percentage? A property-management company in the area should have these aggregated.
- How much new apartment / multifamily construction is in the pipeline within 1–3 miles? Heavy new supply (>2% of stock underway) typically softens rents 12–24 months out; light construction supports rent growth.
Investment metrics
- 1% rule
- 2.39% ✓
- Cap rate
- 17.49%
- Cash-on-cash
- 39.99%
- DSCR
- 2.78
- GRM
- 3.5
CMA / ARV
- ARV (median comp)
- $105,595
- List price
- $84,000
- Delta
- -20.45%
- Verdict
- UNDERPRICED
- Comps
- 1 within 2.0 mi
Projected returns pro-forma
-3.0% appreciation · 0.0% rent growth · sell at horizon
- IRR
- 32.4%
- Equity multiple
- 2.30×
- Total profit
- $30,592
- Equity at exit
- $12,525
- IRR
- 37.5%
- Equity multiple
- 3.93×
- Total profit
- $68,857
- Equity at exit
- $7,263
Cash invested: $23,520 (down + closing). Projections, not guarantees.
Landlord ↔ Tenant lean methodology
- Overall (STATE)
- 87 Strongly Landlord-Friendly
- State Florida
- 87 Strongly Landlord-Friendly · R+3
- County
- — inherits STATE
- City
- — inherits STATE
ZIP-level market 34994
- Home prices YoY
- -27.1%
- Rents YoY
- -0.7%
- Active inventory
- 259
- Price-to-rent
- 3.5×
Monthly cashflow live
- Estimated rent
- $2,008 high interval (Pro) →
- Mortgage (P&I)
- −$441
- Tax from tax record
- −$52 /mo · $622/yr
- Insurance
- −$35
- HOA
- −$275
- Vacancy / Maint / Mgmt
- −$422
- Net cashflow
- $784
Break-even live
Sensitivity live
| Price | -10% $831 | -5% $808 | +0% $784 | +5% $760 | +10% $736 |
|---|---|---|---|---|---|
| Rent | -10% $625 | -5% $704 | +0% $784 | +5% $863 | +10% $942 |
| Rate | -1.0pp $826 | -0.5pp $805 | base $784 | +0.5pp $762 | +1.0pp $740 |
UW: 25.0% down · 7.5% · 30yr · 1.5% tax · 5.0% vac · 8.0% maint · 8.0% mgmt
Financing live
Cash to close
- Down payment
- $21,000
- Closing costs
- $2,520
- Reserves months
- —
- Total cash needed
- —
Loan-product check · same deal, 3 products live
Conventional
25% down · 7.5% · 30yr
- Down + closing
- —
- Monthly P&I
- —
- Monthly cashflow
- —
- DSCR
- —
- Eligible?
- —
Personal DTI + credit; lowest rate.
DSCR
20% down · 8.5% · 30yr
- Down + closing
- —
- Monthly P&I
- —
- Monthly cashflow
- —
- DSCR
- —
- Eligible?
- —
No personal income docs; deal must DSCR.
Hard money
10% down · 12.0% · 12mo
- Down + closing
- —
- Monthly P&I
- —
- Monthly cashflow
- —
- DSCR
- —
- Eligible?
- —
Short-term bridge; refi at stabilization.
Rent comps 9 comps
| Address | Beds | Baths | Sqft | Rent | $/sqft | DOM | Units | Dist |
|---|---|---|---|---|---|---|---|---|
| 2600 S Kanner Hwy Stuart, FL | 1.0–2.0 | 1.5–2.0 | 890 | $1,950 | $2.19 | 15d | 3 | 0.20mi |
| 400 SE Central Pkwy Stuart, FL | 1.0–2.0 | 1.0–2.0 | 918 | $2,640 | $2.87 | 15d | 16 | 0.54mi |
| 1041 SE Monterey Rd Unit 2-4 Stuart, FL | 1.0 | 1.0 | 424 | $1,375 | $3.24 | 22d | 1 | 0.73mi |
| 1081 SE Monterey Rd Unit 3-31 Stuart, FL | 1.0 | 1.0 | 424 | $1,200 | $2.83 | 25d | 1 | 0.75mi |
| 2104 SE Edler Dr Stuart, FL | 1.0 | 1.0 | 726 | $1,500 | $2.07 | 25d | 1 | 0.89mi |
| 950 S Kanner Hwy Stuart, FL | 1.0–2.0 | 1.0–2.0 | 850 | $2,000 | $2.35 | 15d | 4 | 1.04mi |
| 3800 S Kanner Hwy Stuart, FL | 3.0 | 1.0–2.0 | 970 | $2,604 | $2.68 | 15d | 21 | 1.14mi |
| 906 SE Tarpon Ave Unit B Stuart, FL | 1.0 | 1.0 | 600 | $1,350 | $2.25 | 25d | 1 | 1.28mi |
| 633 SW Cleveland Ave Stuart, FL | 1.0 | 1.0 | 548 | $2,100 | $3.83 | 15d | 1 | 1.42mi |
HOA detail condo
- Monthly dues
- $275 · $3,300/yr
- Likely covers
- watersewertrashcablepool
- Assessments
- None detected in remarks — confirm with the listing agent.
Listing history 21 events
-
2026-06-21days on market $84,000 Active 90 DOM
-
2026-06-18days on market $84,000 Active 87 DOM
-
2026-06-17days on market $84,000 Active 86 DOM
-
2026-06-16days on market $84,000 Active 85 DOM
-
2026-06-15days on market $84,000 Active 84 DOM
-
2026-06-14days on market $84,000 Active 82 DOM
-
2026-06-13days on market $84,000 Active 81 DOM
-
2026-06-10days on market $84,000 Active 79 DOM
-
2026-06-09days on market $84,000 Active 78 DOM
-
2026-06-08days on market $84,000 Active 77 DOM
-
2026-06-07days on market $84,000 Active 76 DOM
-
2026-06-03days on market $84,000 Active 72 DOM
-
2026-06-02days on market $84,000 Active 71 DOM
-
2026-06-01days on market $84,000 Active 70 DOM
-
2026-05-31days on market $84,000 Active 69 DOM
-
2026-05-31days on market $84,000 Active 68 DOM
-
2026-03-22$84,000 Active 301-char remark
Show marketing remark (301 chars)
Great remodeled 2 bedroom 2 bath home. Pass thru from kitchen to dining area. Leisure village co-op is an active adult community with a great heated pool. maintenance fee is only $275 per month and includes water, sewer, lawn, trash removal, cable tv, clubhouse, bocci, shuffleboard Come join the fun
-
2020-03-19historical
-
2020-03-09price $67,500
-
2020-02-24price $69,500
-
2020-01-27$74,900 Active
ⓘ Source: listings_history table (triggers on properties + properties_extension) + one-shot
backfill from property_details.listing_events for pre-trigger history.
Tax reassessment forecast FL · Resets to sale price
- Current annual tax
- $622 · $52/mo
- Projected year-2 tax
- $697 · $58/mo
- Expected delta
- +$75/yr (+$6/mo · 12.0%)
ⓘ Screening estimate from a state-policy table — verify with the county assessor before closing.
Climate risk First Street
- Flood 4/10 Moderate FEMA zone X (unshaded) · 21% chance over 30 yrs
- Wildfire 1/10 Low
- Heat 10/10 Extreme 7 d/yr ≥106°F today · 23 d/yr by 30 yrs out
- Wind 10/10 Extreme 99% chance of damaging wind over 30 yrs
- Air quality 2/10 Low 1 unhealthy d/yr today · 1 by 30 yrs out
Nearby sold comps map
Loading sold comps map…
Walkable amenities ~0.75 mi
Loading nearby amenities…
Taxation est. · year 1
- Rental income
- $24,094
- − Mortgage interest
- −$4,705
- − Property taxes
- −$622
- − Insurance
- −$420
- − Repairs & maintenance
- −$1,927
- − Management
- −$1,927
- − HOA
- −$3,300
- − Depreciation
- −$2,444
- Taxable income
- $8,747
- Est. tax owed @ 24.0%
- −$2,099
- After-tax cash flow
- $7,306/yr
For passive investors: Depreciation is non-cash, so a rental often shows a tax loss while cash-flowing — sheltering income. Rental losses are passive: they offset passive income freely, and up to $25,000/yr can offset ordinary (W-2) income if you actively participate and your MAGI is under $100k (phasing out to $0 by $150k); unused losses carry forward. On sale, claimed depreciation is recaptured at up to 25%, and gains may owe capital-gains tax (a 1031 exchange can defer both). Figures are a year-1 estimate at your 24.0% rate — not tax advice; consult a CPA.
Schools (NCES district)
- District
- Martin
- NCES district ID
- 1201290
- Math proficiency
- 52% ▼ -14.00%
- Reading proficiency
- 53% ▼ -4.00%
- Median HH income
- $52,482
- Composite
- 45.1/100
- National rank
- #2690
- State rank
- #24 of 73 in FL
Livability — Stuart
- Score
- 84/100
- State rank
- #39
- US rank
- #790
Category grades
Schools grade is shown separately in the Schools card above.
Census & demographics
- County
- Martin County · 165,223 people
- City population
- 65,812
- Metro
- Port St. Lucie, FL
- Population (ZIP)
- 18,737
- Household income
- $62,533
- Rent vs Own
- Severe rent burden
- 1408.0
Population outlook (Martin County) Hauer SSP2
- Today (2025)
- 172,383 people
- By 2030
- 180,192 · +4.5%
- By 2040
- 194,114 · +12.6%
- By 2050
- 204,992 · +18.9%
- By 2075
- 229,641 · +33.2%
- By 2100
- 232,146 · +34.7%
Race, ethnicity, and origin ACS 2023
- Neighborhood character
- Majority White (65%)
- Race & ethnicity
- White 65% Hispanic / Latino 21% Two or more races 12% Black 11%
- Hispanic origin (detail)
- Mexican 6% Puerto Rican 5% Cuban 1%
- Common ancestry
- Romanian 5% Lithuanian 3% Slovak 2%
- Foreign-born
- 12% · Canada
- Languages at home
- 80% English-only · Spanish 16% Russian/Polish/Slavic 2% Other Indo-European 1%
Political lean MEDSL · Martin
- 2024 margin
- Solid R (+31.1) · D 34.1% · R 65.2%
- 2008→2024 swing
- -17.5pp toward R · 2008: -13.6pp · 2024: -31.1pp
- All cycles
- 2024: R+31.1 2020: R+24.6 2016: R+26.9 2012: R+22.9 2008: R+13.6
Not yet ingested
- Civics
- —
Market trends
- HPI YoY
- ▼ -130.08%
- Current HPI
- 349.7061
- Rent YoY
- ▼ -0.69%
- Metro
- Port St. Lucie, FL
- State GDP YoY
- ▲ 3.28%
- F500 in state
- 36
Industry mix (Fortune 500 HQ in FL)
| Industry | F500 HQs | Revenue |
|---|---|---|
| Industrial Technology | 2 | $29B |
|
||
| Insurance | 2 | $17B |
|
||
| Retail | 1 | $60B |
|
||
| Technology Distribution | 1 | $58B |
|
||
| Homebuilding | 1 | $35B |
|
||
| Technology Manufacturing | 1 | $35B |
|
||
Price history
+12.1% since first listed5 events — show timeline
- 2026-03-22 Listed $84,000 MCRTC
- 2020-03-19 Listing Removed — Beaches MLS
- 2020-03-09 Price Changed $67,500 Beaches MLS
- 2020-02-24 Price Changed $69,500 Beaches MLS
- 2020-01-27 Listed $74,900 Beaches MLS
Property tax history
+7.6%/yrLatest (2025): $622 · -4.0% YoY. Source: county tax records.
Cash-flow waterfall
monthlySold comps — $/sqft
last 12 mo · ≤1 miLoading sold comps…