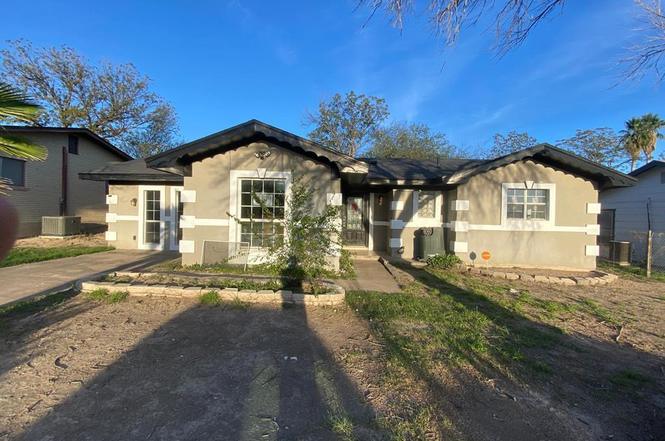
1607 Avenue P · Del Rio, TX
Flood risk 1/10 · Minimal
- FEMA flood zone
- X (unshaded)
- Chance of flooding over 30 yrs
- 0.0%
- Est. flood insurance / yr
- $507 – $1,088
Fire risk 6/10 · Moderate
- Est. fire insurance / yr
- $1,222 – $2,270
Heat risk 8/10 · Major
- Hot days now (above 108°F)
- 7 days/yr
- Hot days in 30 yrs
- 23 days/yr
Wind risk 4/10 · Minor
- Chance of severe wind over 30 yrs
- 12.0%
Air-quality risk 1/10 · Minimal
- Unhealthy air days now
- 0 days/yr
- Unhealthy air days in 30 yrs
- 0 days/yr
Risk factors via First Street. Map © Google.
Why this score? — see what drove the D grade
The composite is a weighted blend of 9 inputs, each scored 0–100. Each bar is that input's sub-score; the figure is the points it added to the 100-point composite (weight × sub-score).
- Cash flow +13.6/30.0
- ARV discount +7.5/15.0
- 1% rule +4.4/10.0
- DSCR +4.1/10.0
- Livability +3.5/5.0
- Rent growth +2.9/5.0
- Condition / age +2.5/5.0
- Schools +2.4/10.0
- Appreciation +0.0/10.0
$173,000
🖨 Deal sheet (PDF) 📄 Offer letter ✓ Due diligence
Listing remarks
HUD home For Sale, Case #514-326001, located in the heart of Del Rio, TX. Features 4-bedrooms, 2 baths, Living-dining area, tile floors, kitchen, breakfast area and lots of cabinet space. Large backyard with storage and covered porch, home is fenced in. HUD homes are SOLD AS IS. Exclusive agency. Contact the Listing broker or visit www. hudhomestore. gov for more information. This home is located between W15th and W 14th St. ; Original MLS#: 81919; Age Range: 21-30 Yrs; Appraisal District ID: 23995; Apx Bsmt SqFt: 0; Apx Lot Size SqFt: 8400.00; Dining: Hard Surface; Family Room/Den: Hard Surface; Finished %: 100; Kitchen: Hard Surface; Living Room: Hard Surface; Misc Exterior: Fenced; Qu
Key facts
- Covered porch
- Fenced in
- Living dining area
Tags
Neighborhood map
What this means for you Summary
Snapshot
- This is a 4-bed/1.0-bath single-family listed at $173k.
Deal economics
- At list price, monthly cash flow is $8 ($97/yr) — positive.
- The deal already cash-flows at list — no discount required.
- To meet the 1% rule (rent ≥ 1% of price), the offer needs to be $163k (5.8% below list).
- Recommended offer: $163k (5.8% below list) — sets the bar for 1% rule.
Location & tenants
- Location reads 70/100 on livability (#349 in TX) — a middle-class / working-renter tenant base. Strengths: cost of living A+, housing A+, crime A-; Watch: health & safety C-, employment D+, amenities F.
- San Felipe-Del Rio CISD (town): math 25% / reading 32% proficiency, ranked #667 of 826 in TX (top 81%) — low school quality limits family demand, transient renter base, plan for 1-2y turnover; 70% free/reduced lunch — lower-income household profile, screen leases tightly.
- Zoned schools: North Heights El (math 21% / reading 30%, grade F, #2,982 of 4,322 statewide, top 70%, 539 students, 83% FRL); Del Rio Middle (math 26% / reading 43%, grade F, #858 of 1,662 statewide, top 54%, 1,478 students, 74% FRL); Del Rio H S (math 27% / reading 30%, grade F, #1,157 of 1,632 statewide, top 72%, 2,470 students, 65% FRL) — zoned schools at 74% FRL track the district average.
- Market conditions: Rents rising (+1.6%/yr); 549 active listings in the ZIP; 12 comparable units currently listed for rent nearby; rentals lingering (median 46d on market — plan ~5-8 weeks vacancy on turnover, expect pricing pressure); 100% of comp listings sitting > 30 days — soft ceiling on asking rent; 85 units permitted in Val Verde County in 2024 (0 in 5+ unit buildings).
Forward outlook
- Local home prices are declining (-3.0%/yr); year-one equity from $1k of loan paydown is wiped out by about $5k of value loss. Plan a longer hold.
- Val Verde County population projected to shrink 9% by 2050 — rents likely to lag national; underwrite the cash flow, not the appreciation.
Negotiation context
- It's been on market 21 days — a 2% lower offer ($170k) is reasonable based on typical stale-listing flexibility.
- 9 sale attempts since 4y ago with the ask held roughly flat each time — persistent listings suggest the price (not the market) is what's stuck; bring a comps-based counter.
Risks & watch-outs
- Climate carrying-cost: major wildfire risk; extreme-heat days projected 7→23/yr by 2055 (HVAC capex compounding) — expect insurance premiums to compound above CPI over the hold.
Questions for the listing agent
- Is there a deadline driving the sale (1031 exchange, divorce, estate, relocation)? That informs how much negotiation room exists.
- Schools are D-rated, which usually means shorter tenancies and higher turnover. Who's the typical renter profile here, and what's been the actual vacancy rate?
- The area grade is low — what's the realistic commute time and amenity access for the typical tenant pool here? Any planned neighborhood developments (good or bad) we should know about?
- What's the average days-on-market for RENTAL listings here right now (not sales)? A rising rental-DOM trend means longer vacancies and softer asking-rent achievability than the comps imply.
- What's the recent tenant-quality profile in this submarket — average credit score on applications, eviction rate, late-payment / NSF rate, and stable-employment percentage? A property-management company in the area should have these aggregated.
- How much new for-sale + rental construction is in the pipeline within 1–3 miles? Heavy new supply typically softens prices + rents 12–24 months out; constrained supply supports both.
Investment metrics
- 1% rule
- 0.94% ✗
- Cap rate
- 6.35%
- Cash-on-cash
- 0.20%
- DSCR
- 1.01
- GRM
- 8.8
CMA / ARV
No comps found within radius.
Projected returns pro-forma
-3.0% appreciation · 1.55% rent growth · sell at horizon
- IRR
- -17.7%
- Equity multiple
- 0.39×
- Total profit
- $-29,784
- Equity at exit
- $25,795
- IRR
- -12.9%
- Equity multiple
- 0.29×
- Total profit
- $-34,301
- Equity at exit
- $14,958
Cash invested: $48,440 (down + closing). Projections, not guarantees.
Landlord ↔ Tenant lean methodology
- Overall (STATE)
- 87 Strongly Landlord-Friendly
- State Texas
- 87 Strongly Landlord-Friendly · R+5
- County
- — inherits STATE
- City
- — inherits STATE
ZIP-level market 78840
- Home prices YoY
- -33.6%
- Rents YoY
- 1.6%
- Active inventory
- 549
- Price-to-rent
- 8.8×
Monthly cashflow live
- Estimated rent
- $1,629 high interval (Pro) →
- Mortgage (P&I)
- −$907
- Tax from tax record
- −$300 /mo · $3,598/yr
- Insurance
- −$72
- HOA
- −$0
- Vacancy / Maint / Mgmt
- −$342
- Net cashflow
- $8
Break-even live
Sensitivity live
| Price | -10% $106 | -5% $57 | +0% $8 | +5% $-41 | +10% $-90 |
|---|---|---|---|---|---|
| Rent | -10% $-121 | -5% $-56 | +0% $8 | +5% $72 | +10% $137 |
| Rate | -1.0pp $95 | -0.5pp $52 | base $8 | +0.5pp $-37 | +1.0pp $-82 |
UW: 25.0% down · 7.5% · 30yr · 1.5% tax · 5.0% vac · 8.0% maint · 8.0% mgmt
Financing live
Cash to close
- Down payment
- $43,250
- Closing costs
- $5,190
- Reserves months
- —
- Total cash needed
- —
Loan-product check · same deal, 3 products live
Conventional
25% down · 7.5% · 30yr
- Down + closing
- —
- Monthly P&I
- —
- Monthly cashflow
- —
- DSCR
- —
- Eligible?
- —
Personal DTI + credit; lowest rate.
DSCR
20% down · 8.5% · 30yr
- Down + closing
- —
- Monthly P&I
- —
- Monthly cashflow
- —
- DSCR
- —
- Eligible?
- —
No personal income docs; deal must DSCR.
Hard money
10% down · 12.0% · 12mo
- Down + closing
- —
- Monthly P&I
- —
- Monthly cashflow
- —
- DSCR
- —
- Eligible?
- —
Short-term bridge; refi at stabilization.
Rent comps 12 comps
| Address | Beds | Baths | Sqft | Rent | $/sqft | DOM | Units | Dist |
|---|---|---|---|---|---|---|---|---|
| 224 Highland St Del Rio, TX | 4.0 | 2.0 | 1751 | $1,250 | $0.71 | 45d | 1 | 0.48mi |
| 105 Margaret Ln Del Rio, TX | 3.0 | 3.0 | 1613 | $1,650 | $1.02 | 45d | 1 | 0.68mi |
| 100 Royal Way Dr Del Rio, TX | 3.0 | 2.0 | 1465 | $1,200 | $0.82 | 45d | 1 | 0.69mi |
| 105 Rockwell Way Unit 3 Del Rio, TX | 3.0 | 2.0 | 1100 | $925 | $0.84 | 45d | 1 | 0.75mi |
| 504 Avenue V Del Rio, TX | 3.0 | 2.0 | 1196 | $1,350 | $1.13 | 45d | 1 | 0.92mi |
| 311 Javier Dr Del Rio, TX | 3.0 | 2.0 | 1623 | $1,875 | $1.16 | 45d | 1 | 1.04mi |
| 312 Javier Dr Del Rio, TX | 3.0 | 2.0 | 1600 | $1,850 | $1.16 | 45d | 1 | 1.04mi |
| 401 Saint Joseph St Del Rio, TX | 3.0 | 2.0 | 1302 | $1,700 | $1.31 | 45d | 1 | 1.12mi |
| 105 Saint Joseph St Del Rio, TX | 3.0 | 2.0 | 1318 | $1,600 | $1.21 | 45d | 1 | 1.21mi |
| 203 Kennedy Dr Del Rio, TX | 3.0 | 2.0 | 1215 | $1,350 | $1.11 | 45d | 1 | 1.28mi |
| 118 Rawhide Trl Del Rio, TX | 4.0 | 2.0 | 1902 | $1,700 | $0.89 | 45d | 1 | 1.45mi |
| 410 Pulliam St Del Rio, TX | 3.0 | 2.0 | 1700 | $1,800 | $1.06 | 45d | 1 | 1.49mi |
Listing history 21 events
-
2026-06-16statusdays on market $173,000 Pending 21 DOM
-
2026-06-12remarks 699-char remark
-
2026-06-12statusdays on market $173,000 Pending SB
-
2026-02-19soldstatus
-
2025-12-31status Pending
-
2025-12-19historical $1,900
-
2025-12-10$173,000 Active
-
2025-12-10$173,000 Active
-
2025-10-09status Active
-
2025-07-31$1,900
-
2025-07-18historical $1,900
-
2025-04-09$1,900
-
2025-02-11price $250,000
-
2024-10-08$289,000 Active
-
2022-07-22soldstatus
-
2022-07-22soldstatus
-
2022-06-01$215,000
-
2022-05-14$219,500
-
2022-05-12$219,500
-
2021-02-12soldstatus
-
2003-11-12soldstatus
ⓘ Source: listings_history table (triggers on properties + properties_extension) + one-shot
backfill from property_details.listing_events for pre-trigger history.
Tax reassessment forecast TX · Resets to sale price
- Current annual tax
- $3,598 · $300/mo
- Projected year-2 tax
- $3,598 · $300/mo
- Expected delta
- $0/yr ($0/mo · -0.0%)
ⓘ Screening estimate from a state-policy table — verify with the county assessor before closing.
Climate risk First Street
- Flood 1/10 Low FEMA zone X (unshaded) · 0% chance over 30 yrs
- Wildfire 6/10 Major
- Heat 8/10 Severe 7 d/yr ≥108°F today · 23 d/yr by 30 yrs out
- Wind 4/10 Moderate 12% chance of damaging wind over 30 yrs
- Air quality 1/10 Low 0 unhealthy d/yr today · 0 by 30 yrs out
Nearby sold comps map
Loading sold comps map…
Walkable amenities ~0.75 mi
Loading nearby amenities…
Taxation est. · year 1
- Rental income
- $19,553
- − Mortgage interest
- −$9,691
- − Property taxes
- −$3,598
- − Insurance
- −$865
- − Repairs & maintenance
- −$1,564
- − Management
- −$1,564
- − Depreciation
- −$5,033
- Taxable loss
- −$2,762
- Est. tax savings @ 24.0%
- +$663
- After-tax cash flow
- $760/yr
For passive investors: Depreciation is non-cash, so a rental often shows a tax loss while cash-flowing — sheltering income. Rental losses are passive: they offset passive income freely, and up to $25,000/yr can offset ordinary (W-2) income if you actively participate and your MAGI is under $100k (phasing out to $0 by $150k); unused losses carry forward. On sale, claimed depreciation is recaptured at up to 25%, and gains may owe capital-gains tax (a 1031 exchange can defer both). Figures are a year-1 estimate at your 24.0% rate — not tax advice; consult a CPA.
Schools (NCES district)
- District
- San Felipe-Del Rio CISD
- NCES district ID
- 4838900
- Math proficiency
- 25% ▼ -18.00%
- Reading proficiency
- 32% ▼ -5.00%
- Median HH income
- $40,582
- Composite
- 24.04/100
- National rank
- #7766
- State rank
- #667 of 826 in TX
Livability — Del Rio
- Score
- 70/100
- State rank
- #349
- US rank
- #7531
Category grades
Schools grade is shown separately in the Schools card above.
Census & demographics
- Census place
- Del Rio, TX
- County
- Val Verde County · 47,256 people
- City population
- 47,256
- Metro
- Del Rio, TX
- Population (ZIP)
- 47,256
- Household income
- $66,084
- Rent vs Own
- Severe rent burden
- 1111.0
Population outlook (Val Verde County) Hauer SSP2
- Today (2025)
- 48,073 people
- By 2030
- 47,468 · -1.3%
- By 2040
- 45,930 · -4.5%
- By 2050
- 43,904 · -8.7%
- By 2075
- 38,126 · -20.7%
- By 2100
- 26,217 · -45.5%
Race, ethnicity, and origin ACS 2023
- Neighborhood character
- Predominantly Hispanic (82%)
- Race & ethnicity
- Hispanic / Latino 82% Two or more races 24% White 15% Black 1%
- Hispanic origin (detail)
- Mexican 75%
- Common ancestry
- Italian 1% Lithuanian 1% Slovak 1%
- Foreign-born
- 19% · Canada
- Languages at home
- 36% English-only · Spanish 63%
Political lean MEDSL · Val Verde
- 2024 margin
- Strong R (+26.6) · D 36.2% · R 62.9%
- 2008→2024 swing
- -36.2pp toward R · 2008: 9.6pp · 2024: -26.6pp
- All cycles
- 2024: R+26.6 2020: R+9.9 2016: D+7.9 2012: D+5.4 2008: D+9.6
Not yet ingested
- Civics
- —
Market trends
- HPI YoY
- ▼ -81.95%
- Current HPI
- 161.762
- Rent YoY
- ▲ 1.55%
- Metro
- Del Rio, TX
- State GDP YoY
- ▲ 3.95%
- F500 in state
- 110
Industry mix (Fortune 500 HQ in TX)
| Industry | F500 HQs | Revenue |
|---|---|---|
| Energy | 16 | $1,198B |
|
||
| Technology | 5 | $198B |
|
||
| Engineering / Construction | 4 | $72B |
|
||
| Energy Services | 3 | $60B |
|
||
| Utilities | 3 | $41B |
|
||
| Healthcare | 2 | $330B |
|
||
Price history
-99.1% since first listed18 events — show timeline
- 2026-02-19 Sold (Public Records) — Public Records
- 2025-12-31 Pending — DRBORMLS
- 2025-12-19 Rental Removed $1,900 EPBOR
- 2025-12-10 Listed $173,000 EPBOR
- 2025-12-10 Listed $173,000 DRBORMLS
- 2025-10-09 Relisted — EPBOR
- 2025-07-31 Listed for Rent $1,900 EPBOR
- 2025-07-18 Rental Removed $1,900 EPBOR
- 2025-04-09 Listed for Rent $1,900 EPBOR
- 2025-02-11 Price Changed $250,000 EPBOR
- 2024-10-08 Listed $289,000 EPBOR
- 2022-07-22 Sold (Public Records) — Public Records
- 2022-07-22 Sold (MLS) — DRBORMLS
- 2022-06-01 Listed $215,000 DRBORMLS
- 2022-05-14 Listed $219,500 DRBORMLS
- 2022-05-12 Listed $219,500 DRBORMLS
- 2021-02-12 Sold (Public Records) — Public Records
- 2003-11-12 Sold (Public Records) — Public Records
Property tax history
+6.7%/yrLatest (2025): $3,598 · +0.6% YoY. Source: county tax records.
Cash-flow waterfall
monthlySold comps — $/sqft
last 12 mo · ≤1 miLoading sold comps…