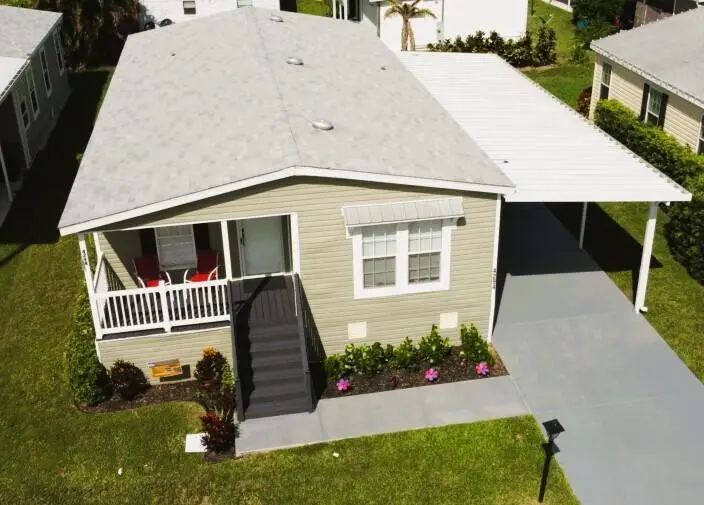
4294 Janet Dr #825 · Greenacres, FL
Flood risk 1/10 · Minimal
- FEMA flood zone
- X (unshaded)
- Chance of flooding over 30 yrs
- 0.0%
- Est. flood insurance / yr
- $507 – $1,088
Fire risk 1/10 · Minimal
- Est. fire insurance / yr
- $947 – $1,759
Heat risk 9/10 · Severe
- Hot days now (above 105°F)
- 7 days/yr
- Hot days in 30 yrs
- 27 days/yr
Wind risk 10/10 · Severe
- Chance of severe wind over 30 yrs
- 99.0%
Air-quality risk 2/10 · Minimal
- Unhealthy air days now
- 0 days/yr
- Unhealthy air days in 30 yrs
- 2 days/yr
Risk factors via First Street. Map © Google.
Why this score? — see what drove the B grade
The composite is a weighted blend of 9 inputs, each scored 0–100. Each bar is that input's sub-score; the figure is the points it added to the 100-point composite (weight × sub-score).
- Cash flow +30.0/30.0
- 1% rule +10.0/10.0
- DSCR +10.0/10.0
- ARV discount +7.5/15.0
- Schools +4.3/10.0
- Condition / age +4.0/5.0
- Livability +3.5/5.0
- Rent growth +2.8/5.0
- Appreciation +0.0/10.0
$128,770
🖨 Deal sheet 📄 Offer letter ✓ Due diligence
Listing remarks
STUNNING 2016 HOME—MOVE-IN READY! Recently remodeled with key upgrades, including a new water heater (6 months old). Located in desirable Greenacres close to Lake Worth Rd commerce and top local amenities. Excellent choice for those seeking a modern, low-maintenance home in a friendly neighborhood setting. Greenacres is recognized as a "Tree City USA" and a family-friendly community with numerous parks and recreational facilities Experience worry-free living in this modern 2016-built home! Recently remodeled and move-in ready, this residence features a brand-new water heater (installed just 6 months ago) for maximum efficiency.
Key facts
- 116.94 acre lot
- 4 parking spots
- Community pool
Property features AI
Finance
- Financial info: Pets allowed with size limit
- HOA & community: Part of Lake Worth Village association; Monthly association fee (paid monthly); Association amenities include clubhouse, fitness center, jogging path, management, park, picnic area, playground, pool, tennis courts, on-site manager, trash chute, sidewalks, and soccer field; Association fees include security, sewer, water, common areas, and common real estate tax
Exterior
- Parking: Four total parking spaces; Attached carport (includes 1 carport space); Covered parking for 2 vehicles; Driveway and open parking available
- Security: Gated community (no guard)
- Utilities: Public water; Public sewer; Electricity available; Cable available
- Home design: Manufactured home (double wide); One story; Resale, updated/remodeled; Faces east
- Construction: Modular construction; Rolled/Hot Mop and shingle roof; Double wide body type; Built as a single-story structure
- Exterior features: Deck; Porch; Not waterfront
Interior
- Kitchen: Dishwasher; Electric range; Microwave; Refrigerator
- Bedrooms: One bedroom on the main level
- Flooring: Laminate flooring; Wood flooring
- Bathrooms: Two full bathrooms (one on the main level)
- Heating & cooling: Central electric heating; Central electric air conditioning
- Interior features: Kitchen island; Negotiable furnishings
- Laundry & utility: Laundry closet inside; Electric water heater
Neighborhood map
What this means for you Summary
Snapshot
- This is a 3-bed/2.0-bath manufactured listed at $129k. Condition is rated good.
Deal economics
- At list price, monthly cash flow is $479 ($6k/yr) — positive.
- The deal already cash-flows at list — no discount required.
- Meets the 1% rule at list price ($3k rent vs $129k).
Location & tenants
- Location reads 69/100 on livability (#490 in FL) — a middle-class / working-renter tenant base. Strengths: cost of living A+, housing A+, health & safety A; Watch: employment D, amenities F, commute F.
- Palm Beach (suburban): math 46% / reading 53% proficiency, ranked #34 of 73 in FL (top 47%) — families likely to look elsewhere, expect single-tenant / working-renter base with shorter leases.
- Zoned schools: Heritage Elementary School (math 35% / reading 39%, grade F, #1,609 of 2,144 statewide, top 77%, 786 students, 75% FRL); L C Swain Middle School (math 26% / reading 33%, grade F, #469 of 571 statewide, top 84%, 1,451 students, 74% FRL); Santaluces Community High (math 22% / reading 39%, grade F, #434 of 667 statewide, top 66%, 2,675 students, 61% FRL) — zoned schools average 70% FRL vs 52% district-wide (18 pts higher); higher-poverty schools than district average — tighter screening recommended.
- Zoned-school proficiency averages 32% at this address vs 50% district-wide (-17 pts) — the specific schools serving this property underperform the Palm Beach average; the district grade overstates school quality for this exact location.
- Market conditions: Rents rising (+1.3%/yr); 346 active listings in the ZIP; 40 comparable units currently listed for rent nearby; rentals at typical pace (median 24d on market — plan ~3-4 weeks tenant-placement turnaround); 3,974 units permitted in Palm Beach County in 2024 (1,012 in 5+ unit buildings).
- At $2,967/mo this rent would consume 48% of the median local household income ($74k/yr) (locally 1466% of renters already pay >50% of income on rent) — very limited rent-growth headroom before tenants either downsize or default.
Forward outlook
- Local home prices are declining (-3.0%/yr); year-one equity from $890 of loan paydown is wiped out by about $4k of value loss. Plan a longer hold.
- Palm Beach County population projected at +30% by 2050 — long-run rental-demand tailwind backs the buy-and-hold thesis.
- At projected returns (-3.0% appreciation + 1.3% rent growth), your $36k cash investment doubles in ~10 years — after that, you're playing with house money.
Negotiation context
- Only 1 days on market — expect competitive offers; lowballing is unlikely to land.
- 2 sale attempts since 4y ago with the ask held roughly flat each time — persistent listings suggest the price (not the market) is what's stuck; bring a comps-based counter.
Risks & watch-outs
- Watch-outs: HOA is 33% of rent.
- Climate carrying-cost: severe wind risk, 99% chance of damaging wind over 30y; extreme-heat days projected 7→27/yr by 2055 (HVAC capex compounding) — expect insurance premiums to compound above CPI over the hold.
Questions for the listing agent
- What does the HOA fee cover, when was the last increase, and are there any pending special assessments or reserve-fund shortfalls?
- Is there a deadline driving the sale (1031 exchange, divorce, estate, relocation)? That informs how much negotiation room exists.
- Schools are D-rated, which usually means shorter tenancies and higher turnover. Who's the typical renter profile here, and what's been the actual vacancy rate?
- What's the average days-on-market for RENTAL listings here right now (not sales)? A rising rental-DOM trend means longer vacancies and softer asking-rent achievability than the comps imply.
- What's the recent tenant-quality profile in this submarket — average credit score on applications, eviction rate, late-payment / NSF rate, and stable-employment percentage? A property-management company in the area should have these aggregated.
- How much new for-sale + rental construction is in the pipeline within 1–3 miles? Heavy new supply typically softens prices + rents 12–24 months out; constrained supply supports both.
Investment metrics
- 1% rule
- 2.30% ✓
- Cap rate
- 10.76%
- Cash-on-cash
- 15.94%
- DSCR
- 1.71
- GRM
- 3.6
CMA / ARV
No comps found within radius.
Projected returns pro-forma
-3.0% appreciation · 1.33% rent growth · sell at horizon
- IRR
- 4.0%
- Equity multiple
- 1.15×
- Total profit
- $5,378
- Equity at exit
- $19,200
- IRR
- 10.9%
- Equity multiple
- 1.75×
- Total profit
- $27,120
- Equity at exit
- $11,134
Cash invested: $36,056 (down + closing). Projections, not guarantees.
Landlord ↔ Tenant lean methodology
- Overall (STATE)
- 87 Strongly Landlord-Friendly
- State Florida
- 87 Strongly Landlord-Friendly · R+3
- County
- — inherits STATE
- City
- — inherits STATE
ZIP-level market 33463
- Home prices YoY
- -30.9%
- Rents YoY
- 1.3%
- Active inventory
- 346
- Price-to-rent
- 3.6×
Monthly cashflow live
- Estimated rent
- $2,967 high interval (Pro) →
- Mortgage (P&I)
- −$675
- Tax est. 1.5%
- −$161 /mo · $1,932/yr
- Insurance
- −$54
- HOA
- −$975
- Vacancy / Maint / Mgmt
- −$623
- Net cashflow
- $479
Break-even live
UW: 25.0% down · 7.5% · 30yr · 1.5% tax · 5.0% vac · 8.0% maint · 8.0% mgmt
Financing live
Cash to close
- Down payment
- $32,192
- Closing costs
- $3,863
- Reserves months
- —
- Total cash needed
- —
Loan-product check · same deal, 3 products live
Conventional
25% down · 7.5% · 30yr
- Down + closing
- —
- Monthly P&I
- —
- Monthly cashflow
- —
- DSCR
- —
- Eligible?
- —
Personal DTI + credit; lowest rate.
DSCR
20% down · 8.5% · 30yr
- Down + closing
- —
- Monthly P&I
- —
- Monthly cashflow
- —
- DSCR
- —
- Eligible?
- —
No personal income docs; deal must DSCR.
Hard money
10% down · 12.0% · 12mo
- Down + closing
- —
- Monthly P&I
- —
- Monthly cashflow
- —
- DSCR
- —
- Eligible?
- —
Short-term bridge; refi at stabilization.
Rent comps 40 comps
| Address | Beds | Baths | Sqft | Rent | $/sqft | DOM | Units | Dist |
|---|---|---|---|---|---|---|---|---|
| 160 Baldwin Blvd Greenacres, FL | 4.0 | 3.0 | 1650 | $3,300 | $2.00 | 13d | 1 | 0.33mi |
| 140 Baldwin Blvd Greenacres, FL | 4.0 | 3.0 | 1561 | $3,400 | $2.18 | 24d | 1 | 0.39mi |
| 4648 Suburban Pines Dr #4648 Lake Worth, FL | 3.0 | 2.5 | 1514 | $2,500 | $1.65 | 24d | 1 | 0.41mi |
| 4124 Pine Hollow Cir Greenacres, FL | 4.0 | 2.5 | 1872 | $3,195 | $1.71 | 17d | 1 | 0.42mi |
| 130 Baldwin Blvd Greenacres, FL | 3.0 | 2.5 | 1338 | $2,700 | $2.02 | 10d | 1 | 0.42mi |
| 1421 14th Ln Unit D Greenacres, FL | 3.0 | 3.0 | 1488 | $3,000 | $2.02 | 5d | 1 | 0.45mi |
| 4251 Pine Hollow Cir Greenacres, FL | 3.0 | 2.5 | 2245 | $3,650 | $1.63 | 15d | 1 | 0.45mi |
| 239 Leland Ln Greenacres, FL | 3.0 | 2.5 | 1338 | $3,250 | $2.43 | 24d | 1 | 0.51mi |
| 261 Martin Ave Greenacres, FL | 3.0 | 2.0 | 1339 | $2,770 | $2.07 | 20d | 1 | 0.58mi |
| 4240 S Landar Dr Lake Worth, FL | 3.0 | 2.0 | 1646 | $2,745 | $1.67 | 7d | 1 | 0.65mi |
| 4240 S Landar Dr Lake Worth, FL | 3.0 | 2.0 | 1646 | $2,800 | $1.70 | 17d | 1 | 0.65mi |
| 2116 21th Ln Unit 2116 Greenacres, FL | 3.0 | 3.0 | 1488 | $2,500 | $1.68 | 24d | 1 | 0.72mi |
| 4300 S Landar Dr Lake Worth, FL | 3.0 | 2.0 | 1646 | $3,200 | $1.94 | 24d | 1 | 0.76mi |
| 5049 Starblaze Dr Greenacres, FL | 4.0 | 2.5 | 2077 | $3,100 | $1.49 | 24d | 1 | 0.79mi |
| 5029 Starblaze Dr Greenacres, FL | 4.0 | 2.5 | 2077 | $3,500 | $1.69 | 22d | 1 | 0.79mi |
| 4169 Oak Terrace Dr Unit 41 Greenacres, FL | 2.0 | 2.0 | 1500 | $2,000 | $1.33 | 24d | 1 | 0.80mi |
| 4588 Holly Lake Dr Lake Worth, FL | 3.0 | 2.0 | 1646 | $2,800 | $1.70 | 24d | 1 | 0.81mi |
| 413 Martin Ave Greenacres, FL | 3.0 | 2.0 | 1454 | $3,000 | $2.06 | 24d | 1 | 0.82mi |
| 5012 Starblaze Dr Greenacres, FL | 3.0 | 2.5 | 1616 | $2,900 | $1.79 | 24d | 1 | 0.83mi |
| 4860 Dillon St Unit 4860 Greenacres, FL | 4.0 | 3.0 | 1685 | $3,650 | $2.17 | 10d | 1 | 0.88mi |
| 4844 Dillion St Lake Worth, FL | 4.0 | 2.5 | 1644 | $3,299 | $2.01 | 15d | 1 | 0.88mi |
| 4860 Dillon St Unit 4860 Greenacres, FL | 4.0 | 3.0 | 1685 | $3,650 | $2.17 | 1d | 1 | 0.88mi |
| 4844 Dillion St Lake Worth, FL | 4.0 | 2.5 | 1644 | $3,300 | $2.01 | 7d | 1 | 0.88mi |
| 4412 Cotswold Hills Dr Lake Worth, FL | 3.0 | 2.5 | 2000 | $2,800 | $1.40 | 24d | 1 | 0.89mi |
| 4390 Berkshire Wharf Dr Lake Worth, FL | 3.0 | 2.5 | 1890 | $2,900 | $1.53 | 24d | 1 | 0.89mi |
| 4185 Oak Terrace Dr Unit 21 Greenacres, FL | 2.0 | 2.0 | 1400 | $2,000 | $1.43 | 24d | 1 | 0.89mi |
| 4305 Coventry Pointe Way Lake Worth, FL | 3.0 | 2.5 | 1881 | $2,700 | $1.44 | 19d | 1 | 0.92mi |
| 4259 Oak Terrace Dr Unit 2 Greenacres, FL | 2.0 | 2.0 | 1400 | $2,000 | $1.43 | 24d | 1 | 0.94mi |
| 303 Seminole Palms Dr Lake Worth, FL | 2.0 | 2.5 | 1652 | $2,400 | $1.45 | 24d | 1 | 0.96mi |
| 5005 Northern Lights Dr Unit 5005 Greenacres, FL | 3.0 | 2.5 | 1616 | $3,200 | $1.98 | 24d | 1 | 0.97mi |
| 3868 Patio Ct #5 Lake Worth, FL | 3.0 | 2.5 | 1446 | $2,850 | $1.97 | 18d | 1 | 1.08mi |
| 4376 Boatman St Unit 4376 Lake Worth Corridor, FL | 3.0 | 2.5 | 1680 | $3,040 | $1.81 | 24d | 1 | 1.11mi |
| 5404 Sunseeker Blvd Greenacres, FL | 4.0 | 2.5 | 2077 | $3,600 | $1.73 | 1d | 1 | 1.14mi |
| 4400 Boatman St Lake Worth, FL | 3.0 | 3.0 | 1944 | $2,890 | $1.49 | 22d | 1 | 1.15mi |
| 4400 Boatman St Unit 4400 Lake Worth Corridor, FL | 3.0 | 2.5 | 1680 | $2,890 | $1.72 | 24d | 1 | 1.15mi |
| 6034 Triphammer Rd Lake Worth, FL | 4.0 | 2.0 | 1401 | $2,950 | $2.11 | 24d | 1 | 1.15mi |
| 5409 Eastbay Dr Greenacres, FL | 3.0 | 2.5 | 1619 | $3,050 | $1.88 | 24d | 1 | 1.19mi |
| 704 Riverside Dr Greenacres, FL | 2.0 | 2.5 | 1278 | $1,950 | $1.53 | 3d | 1 | 1.20mi |
| 441 Pine Glen Ln Unit A1 Greenacres, FL | 2.0 | 1.0 | 1700 | $1,600 | $0.94 | 24d | 1 | 1.21mi |
| 6273 Tall Cypress Cir Greenacres, FL | 3.0 | 2.0 | 1360 | $2,400 | $1.76 | 24d | 1 | 1.24mi |
HOA detail
- Monthly dues
- $975 · $11,700/yr
- Likely covers
- water
Listing history 4 events
-
2026-05-28$128,770 Active
-
2022-07-13historical
-
2022-07-07$130,000 Active
-
2022-07-06historical
ⓘ Source: listings_history table (triggers on properties + properties_extension) + one-shot
backfill from property_details.listing_events for pre-trigger history.
Climate risk First Street
- Flood 1/10 Low FEMA zone X (unshaded) · 0% chance over 30 yrs
- Wildfire 1/10 Low
- Heat 9/10 Extreme 7 d/yr ≥105°F today · 27 d/yr by 30 yrs out
- Wind 10/10 Extreme 99% chance of damaging wind over 30 yrs
- Air quality 2/10 Low 0 unhealthy d/yr today · 2 by 30 yrs out
Nearby sold comps map
Loading sold comps map…
Walkable amenities ~0.75 mi
Loading nearby amenities…
Taxation est. · year 1
- Rental income
- $35,603
- − Mortgage interest
- −$7,213
- − Property taxes
- −$1,932
- − Insurance
- −$644
- − Repairs & maintenance
- −$2,848
- − Management
- −$2,848
- − HOA
- −$11,700
- − Depreciation
- −$3,746
- Taxable income
- $4,672
- Est. tax owed @ 24.0%
- −$1,121
- After-tax cash flow
- $4,626/yr
For passive investors: Depreciation is non-cash, so a rental often shows a tax loss while cash-flowing — sheltering income. Rental losses are passive: they offset passive income freely, and up to $25,000/yr can offset ordinary (W-2) income if you actively participate and your MAGI is under $100k (phasing out to $0 by $150k); unused losses carry forward. On sale, claimed depreciation is recaptured at up to 25%, and gains may owe capital-gains tax (a 1031 exchange can defer both). Figures are a year-1 estimate at your 24.0% rate — not tax advice; consult a CPA.
Condition & rehab AI · 12 photos
This 2016-built manufactured home is move-in ready with recent updates and a good condition score. It offers a modern, low-maintenance living experience in a family-friendly neighborhood.
Value-add opportunities
- Resale Paint exterior siding — Fresh paint can enhance curb appeal and property value.
- Rental Clean gutters — Clean gutters improve drainage and reduce maintenance costs for tenants.
Renovation cost estimate screening
Value-add ROI direction
- Resale Paint exterior siding — Fresh paint can enhance curb appeal and property value. ↑
- Rental Clean gutters — Clean gutters improve drainage and reduce maintenance costs for tenants. ↑
ⓘ Cost ranges are severity-bucket heuristics (US national rule-of-thumb). Get contractor quotes + a written scope before underwriting a rehab budget.
Schools (NCES district)
- District
- Palm Beach
- NCES district ID
- 1201500
- Math proficiency
- 46% ▼ -16.00%
- Reading proficiency
- 53% ▼ -4.00%
- Median HH income
- $53,943
- Composite
- 42.72/100
- National rank
- #3160
- State rank
- #34 of 73 in FL
Livability — Greenacres
- Score
- 69/100
- State rank
- #490
- US rank
- #9008
Category grades
Schools grade is shown separately in the Schools card above.
Census & demographics
- County
- Palm Beach County · 1,438,312 people
- City population
- 65,478
- Metro
- Miami-Fort Lauderdale-Pompano Beach, FL
- Population (ZIP)
- 65,478
- Household income
- $73,865
- Rent vs Own
- Severe rent burden
- 1466.0
Population outlook (Palm Beach County) Hauer SSP2
- Today (2025)
- 1,637,487 people
- By 2030
- 1,743,255 · +6.5%
- By 2040
- 1,948,712 · +19.0%
- By 2050
- 2,132,979 · +30.3%
- By 2075
- 2,530,027 · +54.5%
- By 2100
- 2,706,979 · +65.3%
Race, ethnicity, and origin ACS 2023
- Neighborhood character
- Diverse neighborhood (Simpson 0.70)
- Race & ethnicity
- Hispanic / Latino 38% Black 29% White 27% Two or more races 11% Asian 4%
- Hispanic origin (detail)
- Mexican 8% Puerto Rican 6% Cuban 5% Dominican 2%
- Common ancestry
- Hispanic 15% Romanian 1% Slovak 1%
- Foreign-born
- 39% · Canada, Jamaica, China
- Languages at home
- 45% English-only · Spanish 32% French/Haitian/Cajun 17% Other Indo-European 2%
Political lean MEDSL · Palm Beach
- 2024 margin
- Toss-up / Even · D 50.0% · R 49.2%
- 2008→2024 swing
- -22.1pp toward R · 2008: 22.9pp · 2024: 0.8pp
- All cycles
- 2024: D+0.8 2020: D+12.8 2016: D+15.3 2012: D+17.0 2008: D+22.9
Not yet ingested
- Civics
- —
Market trends
- HPI YoY
- ▼ -175.33%
- Current HPI
- 392.055
- Rent YoY
- ▲ 1.33%
- Metro
- Miami-Fort Lauderdale-Pompano Beach, FL
- State GDP YoY
- ▲ 3.28%
- F500 in state
- 36
Industry mix (Fortune 500 HQ in FL)
| Industry | F500 HQs | Revenue |
|---|---|---|
| Industrial Technology | 2 | $29B |
|
||
| Insurance | 2 | $17B |
|
||
| Retail | 1 | $60B |
|
||
| Technology Distribution | 1 | $58B |
|
||
| Homebuilding | 1 | $35B |
|
||
| Technology Manufacturing | 1 | $35B |
|
||
Price history
-0.9% since first listed4 events — show timeline
- 2026-05-28 Listed $128,770 Beaches MLS
- 2022-07-13 Listing Removed — Beaches MLS
- 2022-07-07 Listed $130,000 Beaches MLS
- 2022-07-06 Coming Soon — Beaches MLS
Cash-flow waterfall
monthlySold comps — $/sqft
last 12 mo · ≤1 miLoading sold comps…