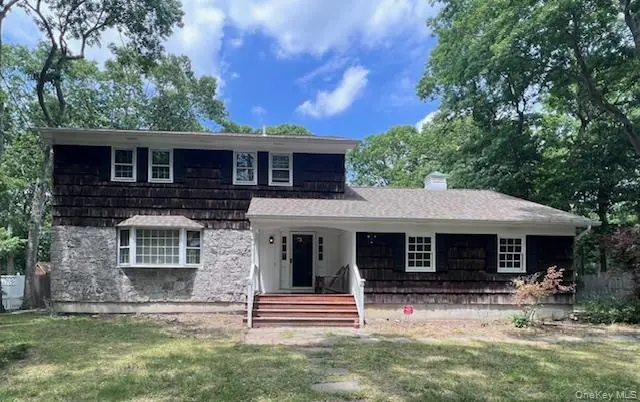
37 Sunset Dr · Shirley, NY
Flood risk 1/10 · Minimal
- FEMA flood zone
- X (unshaded)
- Chance of flooding over 30 yrs
- 0.0%
- Est. flood insurance / yr
- $473 – $860
Fire risk 2/10 · Minimal
- Est. fire insurance / yr
- $691 – $1,283
Heat risk 4/10 · Minor
- Hot days now (above 93°F)
- 7 days/yr
- Hot days in 30 yrs
- 19 days/yr
Wind risk 8/10 · Major
- Chance of severe wind over 30 yrs
- 80.0%
Air-quality risk 4/10 · Minor
- Unhealthy air days now
- 3 days/yr
- Unhealthy air days in 30 yrs
- 5 days/yr
Risk factors via First Street. Map © Google.
Why this score? — see what drove the C- grade
The composite is a weighted blend of 9 inputs, each scored 0–100. Each bar is that input's sub-score; the figure is the points it added to the 100-point composite (weight × sub-score).
- Cash flow +19.5/30.0
- ARV discount +12.0/15.0
- DSCR +6.2/10.0
- Schools +4.7/10.0
- 1% rule +4.3/10.0
- Livability +3.1/5.0
- Rent growth +2.5/5.0
- Condition / age +2.5/5.0
- Appreciation +0.0/10.0
$599,000
🖨 Deal sheet 📄 Offer letter ✓ Due diligence
Listing remarks
Welcome to this spacious Colonial located in Mastic Acres offering 2,218 square feet of comfortable living space. This inviting home features 3 bedrooms and 2.5 bathrooms, along with a thoughtfully designed layout that includes a welcoming living room, formal dining room, bright eat-in kitchen, and a cozy family room perfect for relaxing or entertaining. Additional highlights include a convenient laundry room, oversized 2 car attached garage, full basement, numerous closets for plenty of storage, beautiful hardwood floors throughout much of the home, and a roof that is only 4 years old providing peace of mind for years to come. This home combines classic Colonial charm with the space and f
Key facts
- Formal dining room
- Laundry room
- Eat in kitchen
Tags
Property features AI
Exterior
- Parking: Driveway; 2-car garage
- Security: Security system
- Utilities: Electricity available and connected (PSEG); Water available and connected; Sewer available and connected (cesspool); Cable available; Phone available
- Home design: Single family residence; Living area reported from plans
- Construction: Cedar and frame construction; Concrete perimeter foundation
- Exterior features: Back yard; Front yard; Fenced yard (wood); Security system
Interior
- Kitchen: Range; Refrigerator
- Bedrooms: Total rooms: 9; Attic with pull-down stairs; Basement: full, unfinished
- Flooring: Hardwood floors
- Bathrooms: 2 full bathrooms; 1 half bathroom
- Heating & cooling: Hot air heating; Oil heating; No central cooling
- Interior features: Eat-in kitchen; Entrance foyer; Formal dining room; His and hers closets; Primary bathroom; Storage; Bay windows; Shutters; Storm windows; Covered patio/porch; Deck; Porch
- Laundry & utility: Washer hookup; Washer; Dryer; Inside laundry room
Neighborhood map
What this means for you Summary
Snapshot
- This is a 3-bed/2.5-bath single-family listed at $599k.
Deal economics
- At list price, monthly cash flow is $681 ($8k/yr) — positive.
- The deal already cash-flows at list — no discount required.
- To meet the 1% rule (rent ≥ 1% of price), the offer needs to be $558k (6.8% below list).
- Recommended offer: $558k (6.8% below list) — sets the bar for 1% rule.
- Cap rate 7.7% vs local median 4.8% in Shirley — top-decile yield for the area; either an underpriced asset or a hidden risk that comps aren't pricing in. Stress-test before assuming the spread holds.
Location & tenants
- Location reads 62/100 on livability (#886 in NY) — a middle-class / working-renter tenant base. Strengths: employment A+, housing A+; Watch: crime D+, amenities F, commute F.
- William Floyd Union Free School District (suburban): math 48% / reading 57% proficiency, ranked #309 of 590 in NY (top 52%) — acceptable for families but not a draw, mixed tenant base, ~2y average lease.
- Zoned schools: William Floyd Elementary School (math 48% / reading 54%, grade C-, #1,047 of 2,108 statewide, top 50%, 742 students, 54% FRL); William Floyd Middle School (math 36% / reading 47%, grade F, #394 of 729 statewide, top 55%, 1,053 students, 54% FRL); William Floyd High School (math 65% / reading 87%, grade A-, #616 of 1,100 statewide, top 57%, 3,013 students, 54% FRL).
- Market conditions: 183 active listings in the ZIP; 2 comparable units currently listed for rent nearby; 1,366 units permitted in Suffolk County in 2024 (216 in 5+ unit buildings).
Forward outlook
- Local home prices are declining (-3.0%/yr); year-one equity from $4k of loan paydown is wiped out by about $18k of value loss. Plan a longer hold.
- Suffolk County population projected to shrink 5% by 2050 — rents likely to lag national; underwrite the cash flow, not the appreciation.
Negotiation context
- Only 8 days on market — expect competitive offers; lowballing is unlikely to land.
Risks & watch-outs
- Climate carrying-cost: severe wind risk, 80% chance of damaging wind over 30y — expect insurance premiums to compound above CPI over the hold.
Questions for the listing agent
- Is there a deadline driving the sale (1031 exchange, divorce, estate, relocation)? That informs how much negotiation room exists.
- Schools are F-rated, which usually means shorter tenancies and higher turnover. Who's the typical renter profile here, and what's been the actual vacancy rate?
- Crime grade is D in this area — have there been break-ins, vandalism, or insurance claims at this property in the last 3 years? What carrier currently insures it and at what premium?
- What's the average days-on-market for RENTAL listings here right now (not sales)? A rising rental-DOM trend means longer vacancies and softer asking-rent achievability than the comps imply.
- What's the recent tenant-quality profile in this submarket — average credit score on applications, eviction rate, late-payment / NSF rate, and stable-employment percentage? A property-management company in the area should have these aggregated.
- How much new for-sale + rental construction is in the pipeline within 1–3 miles? Heavy new supply typically softens prices + rents 12–24 months out; constrained supply supports both.
Investment metrics
- 1% rule
- 0.93% ✗
- Cap rate
- 7.66%
- Cash-on-cash
- 4.87%
- DSCR
- 1.22
- GRM
- 8.9
CMA / ARV
- ARV (on-the-fly)
- $665,400
- Comps found
- 4
Show comp detail 4 sales within ~0.75 mi
| Address | Dist | Beds/Ba | Sqft | Sold | Price | $/sf | Match |
|---|---|---|---|---|---|---|---|
| 249 Revilo Ave | 0.22mi | 4/2.5 (+1) | 2,222 (+0%) | 4mo | $440,000 | $198 | 81 |
| 55 Ridgewood Dr | 0.39mi | 4/2.0 (+1) | 2,132 (-4%) | 11mo | $625,000 | $293 | 59 |
| 120 River Rd | 0.52mi | 4/2.5 (+1) | 2,035 (-8%) | 4mo | $740,000 | $364 | 54 |
| 317 Grand | 0.44mi | 4/2.0 (+1) | 2,100 (-5%) | 15mo | $630,000 | $300 | 51 |
Match score weights: distance 35% · size 25% · config 20% · recency 20%. Top-matched comps best support the ARV.
Projected returns pro-forma
-3.0% appreciation · 3.0% rent growth · sell at horizon
- IRR
- -8.8%
- Equity multiple
- 0.68×
- Total profit
- $-53,881
- Equity at exit
- $89,313
- IRR
- 0.7%
- Equity multiple
- 1.05×
- Total profit
- $8,223
- Equity at exit
- $51,791
Cash invested: $167,720 (down + closing). Projections, not guarantees.
Landlord ↔ Tenant lean methodology
- Overall (STATE)
- 15 Strongly Tenant-Friendly
- State New York
- 15 Strongly Tenant-Friendly · D+10
- County
- — inherits STATE
- City
- — inherits STATE
ZIP-level market 11967
- Home prices YoY
- -33.1%
- Active inventory
- 183
- Price-to-rent
- 8.9×
Monthly cashflow live
- Estimated rent
- $5,584 medium interval (Pro) →
- Mortgage (P&I)
- −$3,141
- Tax from tax record
- −$340 /mo · $4,083/yr
- Insurance
- −$250
- HOA
- −$0
- Vacancy / Maint / Mgmt
- −$1,173
- Net cashflow
- $681
Break-even live
UW: 25.0% down · 7.5% · 30yr · 1.5% tax · 5.0% vac · 8.0% maint · 8.0% mgmt
Financing live
Cash to close
- Down payment
- $149,750
- Closing costs
- $17,970
- Reserves months
- —
- Total cash needed
- —
Loan-product check · same deal, 3 products live
Conventional
25% down · 7.5% · 30yr
- Down + closing
- —
- Monthly P&I
- —
- Monthly cashflow
- —
- DSCR
- —
- Eligible?
- —
Personal DTI + credit; lowest rate.
DSCR
20% down · 8.5% · 30yr
- Down + closing
- —
- Monthly P&I
- —
- Monthly cashflow
- —
- DSCR
- —
- Eligible?
- —
No personal income docs; deal must DSCR.
Hard money
10% down · 12.0% · 12mo
- Down + closing
- —
- Monthly P&I
- —
- Monthly cashflow
- —
- DSCR
- —
- Eligible?
- —
Short-term bridge; refi at stabilization.
Rent comps 2 comps
| Address | Beds | Baths | Sqft | Rent | $/sqft | DOM | Units | Dist |
|---|---|---|---|---|---|---|---|---|
| 42 Revilo Ave Shirley, NY | 3.0 | 2.0 | 2670 | $5,000 | $1.87 | 24d | 1 | 0.86mi |
| 357 Smith Rd Shirley, NY | 3.0 | 2.0 | 2000 | $6,500 | $3.25 | 3d | 1 | 1.46mi |
Listing history 7 events
-
2026-06-18days on market $599,000 Active 8 DOM
-
2026-06-17days on market $599,000 Active 7 DOM
-
2026-06-16days on market $599,000 Active 6 DOM
-
2026-06-15days on market $599,000 Active 5 DOM
-
2026-06-13days on market $599,000 Active 3 DOM
-
2026-06-13remarks 699-char remark
-
2026-06-13$599,000 Active 2 DOM
ⓘ Source: listings_history table (triggers on properties + properties_extension) + one-shot
backfill from property_details.listing_events for pre-trigger history.
Tax reassessment forecast NY · Partial reset (capped growth)
- Current annual tax
- $4,083 · $340/mo
- Projected year-2 tax
- $7,103 · $592/mo
- Expected delta
- +$3,020/yr (+$252/mo · 74.0%)
ⓘ Screening estimate from a state-policy table — verify with the county assessor before closing.
Climate risk First Street
- Flood 1/10 Low FEMA zone X (unshaded) · 0% chance over 30 yrs
- Wildfire 2/10 Low
- Heat 4/10 Moderate 7 d/yr ≥93°F today · 19 d/yr by 30 yrs out
- Wind 8/10 Severe 80% chance of damaging wind over 30 yrs
- Air quality 4/10 Moderate 3 unhealthy d/yr today · 5 by 30 yrs out
Nearby sold comps map
Loading sold comps map…
Walkable amenities ~0.75 mi
Loading nearby amenities…
Taxation est. · year 1
- Rental income
- $67,013
- − Mortgage interest
- −$33,553
- − Property taxes
- −$4,083
- − Insurance
- −$2,995
- − Repairs & maintenance
- −$5,361
- − Management
- −$5,361
- − Depreciation
- −$17,425
- Taxable loss
- −$1,766
- Est. tax savings @ 24.0%
- +$424
- After-tax cash flow
- $8,591/yr
For passive investors: Depreciation is non-cash, so a rental often shows a tax loss while cash-flowing — sheltering income. Rental losses are passive: they offset passive income freely, and up to $25,000/yr can offset ordinary (W-2) income if you actively participate and your MAGI is under $100k (phasing out to $0 by $150k); unused losses carry forward. On sale, claimed depreciation is recaptured at up to 25%, and gains may owe capital-gains tax (a 1031 exchange can defer both). Figures are a year-1 estimate at your 24.0% rate — not tax advice; consult a CPA.
Schools (NCES district)
- District
- William Floyd Union Free School District
- NCES district ID
- 3618690
- Math proficiency
- 48% ▲ 3.00%
- Reading proficiency
- 57% ▲ 11.00%
- Median HH income
- $70,564
- Composite
- 46.79/100
- National rank
- #2383
- State rank
- #309 of 590 in NY
Livability — Shirley
- Score
- 62/100
- State rank
- #886
- US rank
- #17184
Category grades
Schools grade is shown separately in the Schools card above.
Census & demographics
- Census place
- Shirley, NY
- City population
- 27,266
- Population (ZIP)
- 27,266
Population outlook (Suffolk County) Hauer SSP2
- Today (2025)
- 1,505,262 people
- By 2030
- 1,498,318 · -0.5%
- By 2040
- 1,471,101 · -2.3%
- By 2050
- 1,424,848 · -5.3%
- By 2075
- 1,337,157 · -11.2%
- By 2100
- 1,217,720 · -19.1%
Race, ethnicity, and origin ACS 2023
- Neighborhood character
- Diverse neighborhood (Simpson 0.57)
- Race & ethnicity
- White 59% Hispanic / Latino 25% Black 9% Two or more races 8% Asian 4%
- Hispanic origin (detail)
- Puerto Rican 10% Dominican 2%
- Common ancestry
- Romanian 3% Lithuanian 2% Scotch-Irish 1%
- Foreign-born
- 12% · Canada, China, Jamaica
- Languages at home
- 76% English-only · Spanish 17% Other Indo-European 4% Chinese 1%
Political lean MEDSL · Suffolk
- 2024 margin
- Lean R (+10.0) · D 45.0% · R 55.0%
- 2008→2024 swing
- -16.0pp toward R · 2008: 6.0pp · 2024: -10.0pp
- All cycles
- 2024: R+10.0 2020: R+0.0 2016: R+8.2 2012: D+2.9 2008: D+6.0
Not yet ingested
- Civics
- —
Market trends
- HPI YoY
- ▼ -212.21%
- Current HPI
- 428.8362
- Rent YoY
- —
- Metro
- —
- State GDP YoY
- ▲ 2.60%
- F500 in state
- 92
Industry mix (Fortune 500 HQ in NY)
| Industry | F500 HQs | Revenue |
|---|---|---|
| Financial Services | 10 | $950B |
|
||
| Consumer Goods | 9 | $162B |
|
||
| Insurance | 4 | $225B |
|
||
| Telecommunications | 2 | $144B |
|
||
| Pharmaceuticals | 2 | $112B |
|
||
| Media / Entertainment | 2 | $69B |
|
||
Price history
1 event — show timeline
- 2026-06-10 Listed $599,000 OneKey® MLS as Distributed by MLS Grid
Property tax history
-1.5%/yrLatest (2025): $4,083 · +0.0% YoY. Source: county tax records.
Cash-flow waterfall
monthlySold comps — $/sqft
last 12 mo · ≤1 miLoading sold comps…