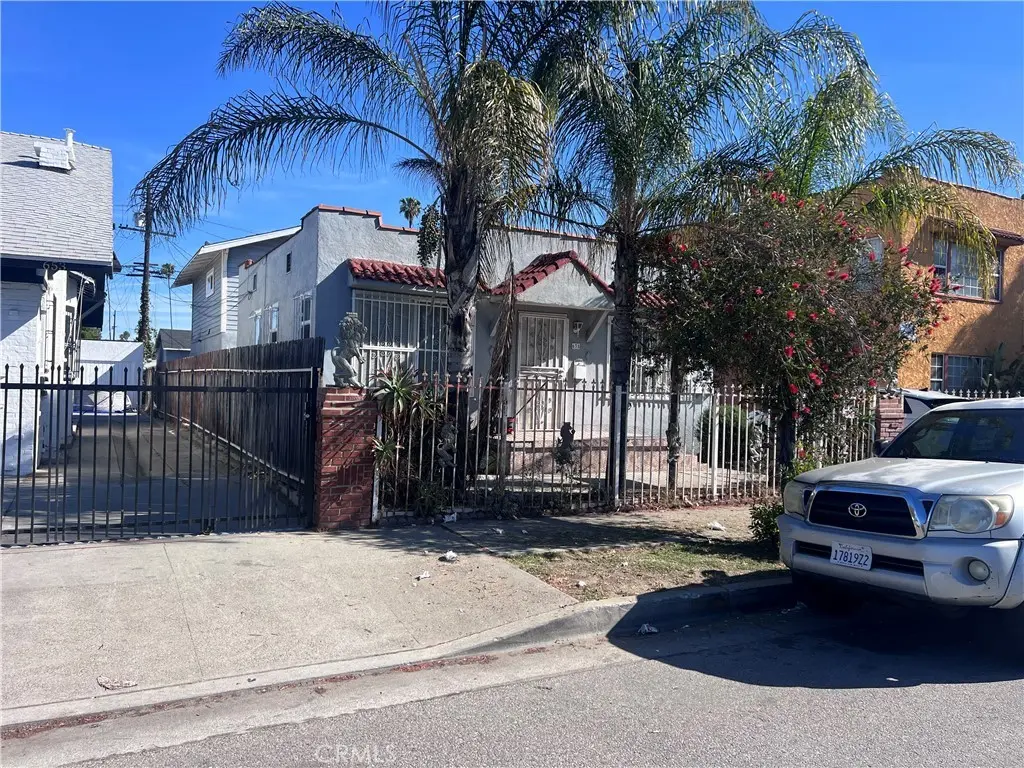
 Triplex
629-w GAGE Ave · Los Angeles, CA
Flood risk 1/10 · Minimal
- FEMA flood zone
- X (unshaded)
- Chance of flooding over 30 yrs
- 0.0%
- Est. flood insurance / yr
- $507 – $1,088
Fire risk 1/10 · Minimal
- Est. fire insurance / yr
- $659 – $1,223
Heat risk 6/10 · Moderate
- Hot days now (above 88°F)
- 7 days/yr
- Hot days in 30 yrs
- 22 days/yr
Wind risk 1/10 · Minimal
- Chance of severe wind over 30 yrs
- —
Air-quality risk 5/10 · Moderate
- Unhealthy air days now
- 7 days/yr
- Unhealthy air days in 30 yrs
- 7 days/yr
Risk factors via First Street. Map © Google.
Why this score? — see what drove the C+ grade
The composite is a weighted blend of 9 inputs, each scored 0–100. Each bar is that input's sub-score; the figure is the points it added to the 100-point composite (weight × sub-score).
- Cash flow +24.8/30.0
- ARV discount +11.9/15.0
- DSCR +8.0/10.0
- 1% rule +5.5/10.0
- Schools +3.6/10.0
- Livability +3.4/5.0
- Condition / age +2.5/5.0
- Rent growth +1.9/5.0
- Appreciation +0.0/10.0
$599,990
🖨 Deal sheet 📄 Offer letter ✓ Due diligence
Multi-family units
County records classify this as Multi-Family (2-4 Unit). Listing-text estimate: 3 units. confirmed
Listing remarks MLS
WOW!!!!! WOW!!!!! WOW!!!!! WOW!!!! WOW!!!! WOW!!!! SUPER CLEAN TRIPLEX IN SOUTH CENTRAL LOS ANGELES WITH EASY ACCESS TO THE PROPERTY THE PROPERTY HAS 2 2BEDROOMS AND 1BA AND 1 1BEDROOM AND 1BA ALL RENTERS PAY ON TIME PROPERTY SITS NEAR ALMOST EVERYTHING 8MILES TO DTL , 6MILES TO USC, 10 MILES TO LAX PROPERTY HAS SEPARATE METERS EXCEPT WATER VERY STRONG POTENTIAL APPRECIATION OF RENTS BECAUSE WHERE THE PROPERTY IS SITUATED WILL NOT LAST
Key facts
- Super clean triplex
- 4,993 sq ft lot
- 3 garage spots
Tags
Neighborhood map
What this means for you Summary
Snapshot
- This is a 2×2bd/1ba + 1×1bd/1ba units multifamily listed at $600k.
Deal economics
- At list price, monthly cash flow is $1k ($15k/yr) — positive. Per door: $424/mo.
- The deal already cash-flows at list — no discount required.
- Meets the 1% rule at list price ($6k rent vs $600k).
- Recommended offer: $564k (6.0% below list) — sets the bar for market timing.
- Cap rate 8.8% vs local median 2.1% in Los Angeles — top-decile yield for the area; either an underpriced asset or a hidden risk that comps aren't pricing in. Stress-test before assuming the spread holds.
Location & tenants
- Location reads 68/100 on livability (#273 in CA) — a middle-class / working-renter tenant base. Strengths: amenities A+, commute A+, employment B; Watch: health & safety C-, schools D+, crime F.
- Los Angeles Unified (urban): math 29% / reading 54% proficiency, ranked #223 of 517 in CA (top 43%) — families likely to look elsewhere, expect single-tenant / working-renter base with shorter leases; 67% free/reduced lunch — lower-income household profile, screen leases tightly.
- Market conditions: Rents soft (-2.5%/yr); 172 active listings in the ZIP; 40 comparable units currently listed for rent nearby; rentals lingering (median 44d on market — plan ~5-8 weeks vacancy on turnover, expect pricing pressure); 58% of comp listings sitting > 30 days — soft ceiling on asking rent; 19,697 units permitted in Los Angeles County in 2024 (9,426 in 5+ unit buildings).
- At $6,322/mo this rent would consume 142% of the median local household income ($53k/yr) (locally 7490% of renters already pay >50% of income on rent) — very limited rent-growth headroom before tenants either downsize or default.
Forward outlook
- Local home prices are declining (-3.0%/yr); year-one equity from $4k of loan paydown is wiped out by about $18k of value loss. Plan a longer hold.
- Los Angeles County population projected at +9% by 2050 — modest demand growth; plan on rents tracking national, not racing it.
Negotiation context
- It's been on market 81 days — a 6% lower offer ($564k) is reasonable based on typical stale-listing flexibility.
- 11 sale attempts since 23y ago; this cycle's ask has dropped $39k (6%) from the opening price — seller is motivated, your offer sets the floor, not the list.
- Current owner paid $225k; list at $600k implies a 167% gain — meaningful room to come down on a strong offer.
Risks & watch-outs
- Watch-outs: built in 1925 — expect roof / HVAC / electrical / plumbing capex.
- Climate carrying-cost: extreme-heat days projected 7→22/yr by 2055 (HVAC capex compounding) — expect insurance premiums to compound above CPI over the hold.
Questions for the listing agent
- It's been on market 81 days. Have you received any prior offers? Is the seller open to a 6% concession, seller financing, or rate buy-down credit?
- Can we see the unit-by-unit rent roll, current vacancy, and any below-market leases? What's the average tenancy length?
- What capital expenditures (roof, boiler, parking lot, exteriors) have been made in the last 5 years, and what's planned in the next 2?
- Built in 1925 — when were the roof, HVAC, electrical panel, plumbing, and water heater last replaced?
- Why hasn't it sold? Are there any deal-killer items the seller is aware of (foundation, flood, title, zoning, code violations)?
- Is there a deadline driving the sale (1031 exchange, divorce, estate, relocation)? That informs how much negotiation room exists.
- Schools are D-rated, which usually means shorter tenancies and higher turnover. Who's the typical renter profile here, and what's been the actual vacancy rate?
- Crime grade is F in this area — have there been break-ins, vandalism, or insurance claims at this property in the last 3 years? What carrier currently insures it and at what premium?
- What's the average days-on-market for RENTAL listings here right now (not sales)? A rising rental-DOM trend means longer vacancies and softer asking-rent achievability than the comps imply.
- What's the recent tenant-quality profile in this submarket — average credit score on applications, eviction rate, late-payment / NSF rate, and stable-employment percentage? A property-management company in the area should have these aggregated.
- How much new apartment / multifamily construction is in the pipeline within 1–3 miles? Heavy new supply (>2% of stock underway) typically softens rents 12–24 months out; light construction supports rent growth.
Investment metrics
- 1% rule
- 1.05% ✓
- Cap rate
- 8.84%
- Cash-on-cash
- 9.08%
- DSCR
- 1.40
- GRM
- 7.9
CMA / ARV
- ARV (median comp)
- $665,266
- List price
- $599,990
- Delta
- -9.81%
- Verdict
- FAIR
- Comps
- 20 within 1.0 mi
Projected returns pro-forma
-3.0% appreciation · 0.0% rent growth · sell at horizon
- IRR
- -5.8%
- Equity multiple
- 0.79×
- Total profit
- $-34,934
- Equity at exit
- $89,460
- IRR
- 0.2%
- Equity multiple
- 1.01×
- Total profit
- $1,587
- Equity at exit
- $51,876
Cash invested: $167,997 (down + closing). Projections, not guarantees.
Landlord ↔ Tenant lean methodology
- Overall (CITY)
- 0 Strongly Tenant-Friendly
- State California
- 18 Strongly Tenant-Friendly · D+13
- County
- — inherits STATE
- City Los Angeles
- 0 Strongly Tenant-Friendly · D+22
ZIP-level market 90044
- Rents YoY
- -2.5%
- Active inventory
- 172
- Price-to-rent
- 22.4×
Monthly cashflow live
- Estimated rent
- $6,322 high interval (Pro) →
- Mortgage (P&I)
- −$3,146
- Tax from tax record
- −$326 /mo · $3,918/yr
- Insurance
- −$250
- HOA
- −$0
- Vacancy / Maint / Mgmt
- −$1,328
- Net cashflow
- $1,271
Break-even live
3-unit breakdown (identical units grouped — click to expand)
| Units | Beds | Baths | Est. rent |
|---|---|---|---|
| 2× units | 2 | 1 | $4,464 |
| #1 | 2 | 1 | $2,232 |
| #2 | 2 | 1 | $2,232 |
| 1× unit | 1 | 1 | $1,857 |
| Total (3 units) | $6,322 | ||
UW: 25.0% down · 7.5% · 30yr · 1.5% tax · 5.0% vac · 8.0% maint · 8.0% mgmt
Financing live
Cash to close
- Down payment
- $149,998
- Closing costs
- $18,000
- Reserves months
- —
- Total cash needed
- —
Loan-product check · same deal, 3 products live
Conventional
25% down · 7.5% · 30yr
- Down + closing
- —
- Monthly P&I
- —
- Monthly cashflow
- —
- DSCR
- —
- Eligible?
- —
Personal DTI + credit; lowest rate.
DSCR
20% down · 8.5% · 30yr
- Down + closing
- —
- Monthly P&I
- —
- Monthly cashflow
- —
- DSCR
- —
- Eligible?
- —
No personal income docs; deal must DSCR.
Hard money
10% down · 12.0% · 12mo
- Down + closing
- —
- Monthly P&I
- —
- Monthly cashflow
- —
- DSCR
- —
- Eligible?
- —
Short-term bridge; refi at stabilization.
Rent comps 40 comps
| Address | Beds | Baths | Sqft | Rent | $/sqft | DOM | Units | Dist |
|---|---|---|---|---|---|---|---|---|
| 810 W 62nd St Unit 4 Los Angeles, CA | 1.0 | 1.0 | 546 | $1,890 | $3.46 | 2d | 1 | 0.15mi |
| 626 W 59th Pl Los Angeles, CA | 2.0 | 1.0 | 680 | $2,400 | $3.53 | 43d | 1 | 0.20mi |
| 622 W 59th Pl Los Angeles, CA | 2.0 | 1.0 | 680 | $2,300 | $3.38 | 43d | 1 | 0.20mi |
| 456 W 59th Pl Los Angeles, CA | — | 1.0 | 400 | $1,500 | $3.75 | 43d | 1 | 0.27mi |
| 932 W 62nd St Los Angeles, CA | 1.0 | 1.0 | 565 | $1,550 | $2.74 | 7d | 1 | 0.30mi |
| 5862 1/2 Denver Ave Los Angeles, CA | 2.0 | 1.0 | 600 | $2,400 | $4.00 | 43d | 1 | 0.35mi |
| 5862 1/2 Denver Ave Unit 5846 Los Angeles, CA | 2.0 | 1.0 | 600 | $2,400 | $4.00 | 7d | 1 | 0.35mi |
| 5842 Denver Ave Unit 5840 Los Angeles, CA | 2.0 | 1.0 | 600 | $2,400 | $4.00 | 20d | 1 | 0.39mi |
| 5842 Denver Ave Los Angeles, CA | 2.0 | 1.0 | 600 | $2,400 | $4.00 | 43d | 1 | 0.39mi |
| 1033 W 62nd St Los Angeles, CA | 2.0 | 1.0 | 725 | $2,500 | $3.45 | 24d | 1 | 0.44mi |
| 616 W 58th St Los Angeles, CA | 2.0 | 1.0 | 649 | $2,700 | $4.16 | 24d | 1 | 0.45mi |
| 616 W 58th St Los Angeles, CA | 2.0 | 1.0 | 649 | $2,700 | $4.16 | 43d | 1 | 0.45mi |
| 713 1/2 57th St Los Angeles, CA | 1.0 | 1.0 | 550 | $1,900 | $3.45 | 43d | 1 | 0.53mi |
| 713 W 57th St Los Angeles, CA | 1.0 | 1.0 | 500 | $1,800 | $3.60 | 43d | 1 | 0.54mi |
| 445 W Florence Ave Los Angeles, CA | 1.0 | 1.0 | 255 | $1,423 | $5.57 | 43d | 3 | 0.58mi |
| 5606 S Figueroa St Los Angeles, CA | — | 1.0 | 400 | $1,385 | $3.46 | 7d | 1 | 0.59mi |
| 443 W Florence Ave Unit 445 Los Angeles, CA | 1.0 | 1.0 | 358 | $1,423 | $3.97 | 22d | 1 | 0.59mi |
| 934 W 71st St Unit 934 1/2 Los Angeles, CA | 2.0 | 1.0 | 600 | $2,400 | $4.00 | 43d | 1 | 0.61mi |
| 832 W Florence Ave Unit 2 Los Angeles, CA | 1.0 | 1.0 | 570 | $1,850 | $3.25 | 43d | 1 | 0.62mi |
| 832 W Florence Ave Apt 7 Los Angeles, CA | — | 1.0 | 420 | $1,520 | $3.62 | 43d | 1 | 0.62mi |
| 1018 W 57th St Los Angeles, CA | 1.0 | 1.0 | 457 | $1,673 | $3.66 | 43d | 2 | 0.65mi |
| 107 E 65th St Apt 3 Los Angeles, CA | 1.0 | 1.0 | 470 | $1,795 | $3.82 | 24d | 1 | 0.67mi |
| 100 E 66th St Los Angeles, CA | 1.0 | 1.0 | 580 | $1,675 | $2.89 | 24d | 1 | 0.69mi |
| 5600 S Broadway Unit 4 Los Angeles, CA | 1.0 | 1.0 | 410 | $1,800 | $4.39 | 43d | 1 | 0.70mi |
| 533 W 75th St Unit 3 Los Angeles, CA | 1.0 | 1.0 | 600 | $2,298 | $3.83 | 7d | 1 | 0.76mi |
| 533 W 75th St Unit 3 Los Angeles, CA | 1.0 | 1.0 | 600 | $2,298 | $3.83 | 43d | 1 | 0.76mi |
| 7311 S Broadway Unit 100 Los Angeles, CA | 1.0 | 1.0 | 367 | $2,100 | $5.72 | 43d | 1 | 0.76mi |
| 6914 1/2 Main St Los Angeles, CA | — | 1.0 | 700 | $1,950 | $2.79 | 7d | 1 | 0.79mi |
| 932 W 74th St Los Angeles, CA | 1.0 | 1.0 | 700 | $1,995 | $2.85 | 43d | 1 | 0.79mi |
| 240 W 54th St Unit 1/2 Los Angeles, CA | 1.0 | 1.0 | 650 | $1,800 | $2.77 | 43d | 1 | 0.81mi |
| 1114 3/4 W 55th St Los Angeles, CA | 1.0 | 1.0 | 457 | $2,289 | $5.01 | 24d | 1 | 0.82mi |
| 1114 W 55th St Los Angeles, CA | 1.0 | 1.0 | 457 | $2,289 | $5.01 | 22d | 1 | 0.82mi |
| 927 3/4 W 75th St Los Angeles, CA | 1.0 | 1.0 | 555 | $1,750 | $3.15 | 24d | 1 | 0.83mi |
| 7524 S Hoover St Los Angeles, CA | 1.0 | 1.0 | 371 | $1,556 | $4.19 | 3d | 2 | 0.84mi |
| 239 E 65th St Los Angeles, CA | 2.0 | 1.0 | 600 | $2,400 | $4.00 | 7d | 1 | 0.85mi |
| 1356 W 60th Pl Los Angeles, CA | 1.0 | 1.0 | 450 | $1,700 | $3.78 | 43d | 1 | 0.86mi |
| 342 W 52nd Pl Unit 342 Los Angeles, CA | 1.0 | 1.0 | 400 | $2,100 | $5.25 | 43d | 1 | 0.87mi |
| 340 W 52nd Pl Los Angeles, CA | 1.0 | 1.0 | 400 | $2,100 | $5.25 | 43d | 1 | 0.87mi |
| 6570 Normandie Ave Unit 228 Los Angeles, CA | 1.0 | 1.0 | 610 | $1,800 | $2.95 | 43d | 1 | 0.90mi |
| 219 W 53rd St Los Angeles, CA | 1.0 | 1.0 | 469 | $2,289 | $4.88 | 43d | 1 | 0.91mi |
Listing history 46 events
-
2026-06-18days on market $599,990 Active 81 DOM
-
2026-06-17remarks 505-char remark
-
2026-06-17pricedays on market $599,990 Active 80 DOM
-
2026-06-16days on market $628,900 Active 79 DOM
-
2026-06-15days on market $628,900 Active 78 DOM
-
2026-06-13days on market $628,900 Active 76 DOM
-
2026-06-09days on market $628,900 Active 72 DOM
-
2026-06-08days on market $628,900 Active 71 DOM
-
2026-06-07days on market $628,900 Active 70 DOM
-
2026-06-04days on market $628,900 Active 67 DOM
-
2026-06-03days on market $628,900 Active 66 DOM
-
2026-06-02days on market $628,900 Active 65 DOM
-
2026-06-01days on market $628,900 Active 64 DOM
-
2026-06-01price $628,900 Active 63 DOM
-
2026-05-31days on market $638,900 Active 63 DOM
-
2026-03-29$638,900 Active 458-char remark
Show marketing remark (458 chars)
WOW!!!!! WOW!!!!! WOW!!!!! WOW!!!! WOW!!!! WOW!!!! SUPER CLEAN TRIPLEX IN SOUTH CENTRAL LOS ANGELES WITH EASY ACCESS TO THE PROPERTY THE PROPERTY HAS 2 2BEDROOMS AND 1BA AND 1 1BEDROOM AND 1BA ALL RENTERS PAY ON TIME PROPERTY SITS NEAR ALMOST EVERYTHING 8MILES TO DTL , 6MILES TO USC, 10 MILES TO LAX PROPERTY HAS SEPARATE METERS EXCEPT WATER VERY STRONG POTENTIAL APPRECIATION OF RENTS BECAUSE WHERE THE PROPERTY IS SITUATED WILL NOT LAST
-
2025-09-17historical
-
2025-08-12price $649,999
-
2025-07-07price $675,000
-
2025-05-06price $699,999
-
2025-04-14$725,000 Active
-
2022-08-25historical
-
2022-04-09price $699,300
-
2022-03-17$737,400 Active
-
2014-10-08historical
-
2014-06-03price $425,000
-
2014-05-03$450,000 Active
-
2009-10-02soldstatus $225,000 Closed
-
2009-07-18historical
-
2009-07-15price $194,000 Active
-
2009-07-15status Active
-
2009-07-14historical
-
2009-06-03status
-
2009-04-23historical
-
2009-02-14$265,000
-
2006-04-03soldstatus $499,000
-
2006-04-03soldstatus $499,000
-
2006-02-16$499,000
-
2006-02-13historical
-
2006-02-03historical
-
2005-12-12$499,000
-
2005-08-03$499,000
-
2004-04-09soldstatus $255,000
-
2004-03-09historical
-
2003-10-11$260,000
-
1979-02-28soldstatus $22,000
ⓘ Source: listings_history table (triggers on properties + properties_extension) + one-shot
backfill from property_details.listing_events for pre-trigger history.
Tax reassessment forecast CA · Resets to sale price
- Current annual tax
- $3,918 · $326/mo
- Projected year-2 tax
- $4,560 · $380/mo
- Expected delta
- +$642/yr (+$54/mo · 16.4%)
ⓘ Screening estimate from a state-policy table — verify with the county assessor before closing.
Climate risk First Street
- Flood 1/10 Low FEMA zone X (unshaded) · 0% chance over 30 yrs
- Wildfire 1/10 Low
- Heat 6/10 Major 7 d/yr ≥88°F today · 22 d/yr by 30 yrs out
- Wind 1/10 Low
- Air quality 5/10 Major 7 unhealthy d/yr today · 7 by 30 yrs out
Nearby sold comps map
Loading sold comps map…
Walkable amenities ~0.75 mi
Loading nearby amenities…
Taxation est. · year 1
- Rental income
- $75,864
- − Mortgage interest
- −$33,609
- − Property taxes
- −$3,918
- − Insurance
- −$3,000
- − Repairs & maintenance
- −$6,069
- − Management
- −$6,069
- − Depreciation
- −$17,454
- Taxable income
- $5,745
- Est. tax owed @ 24.0%
- −$1,379
- After-tax cash flow
- $13,879/yr
For passive investors: Depreciation is non-cash, so a rental often shows a tax loss while cash-flowing — sheltering income. Rental losses are passive: they offset passive income freely, and up to $25,000/yr can offset ordinary (W-2) income if you actively participate and your MAGI is under $100k (phasing out to $0 by $150k); unused losses carry forward. On sale, claimed depreciation is recaptured at up to 25%, and gains may owe capital-gains tax (a 1031 exchange can defer both). Figures are a year-1 estimate at your 24.0% rate — not tax advice; consult a CPA.
Schools (NCES district)
- District
- Los Angeles Unified
- NCES district ID
- 0622710
- Math proficiency
- 29% ▼ -4.00%
- Reading proficiency
- 54% ▲ 10.00%
- Median HH income
- $50,403
- Composite
- 35.67/100
- National rank
- #4875
- State rank
- #223 of 517 in CA
Livability — Los Angeles
- Score
- 68/100
- State rank
- #273
- US rank
- #9237
Category grades
Schools grade is shown separately in the Schools card above.
Census & demographics
- Census place
- Los Angeles, CA
- County
- Los Angeles County · 9,444,647 people
- City population
- 3,838,149
- Metro
- Los Angeles-Long Beach-Anaheim, CA
- Population (ZIP)
- 94,830
- Household income
- $53,302
- Rent vs Own
- Severe rent burden
- 7490.0
Population outlook (Los Angeles County) Hauer SSP2
- Today (2025)
- 10,940,515 people
- By 2030
- 11,256,481 · +2.9%
- By 2040
- 11,729,929 · +7.2%
- By 2050
- 11,948,407 · +9.2%
- By 2075
- 11,818,114 · +8.0%
- By 2100
- 10,842,928 · -0.9%
Race, ethnicity, and origin ACS 2023
- Neighborhood character
- Predominantly Hispanic (67%)
- Race & ethnicity
- Hispanic / Latino 67% Black 29% Two or more races 23% White 1% Native American 1%
- Hispanic origin (detail)
- Mexican 39%
- Foreign-born
- 34% · Canada
- Languages at home
- 37% English-only · Spanish 62%
Political lean MEDSL · Los Angeles
- 2024 margin
- Solid D (+32.9) · D 64.8% · R 31.9% · Other 3.3%
- 2008→2024 swing
- -7.4pp toward R · 2008: 40.4pp · 2024: 32.9pp
- All cycles
- 2024: D+32.9 2020: D+44.2 2016: D+48.0 2012: D+40.0 2008: D+40.4
Not yet ingested
- Civics
- —
Market trends
- HPI YoY
- ▼ -691.99%
- Current HPI
- 467.9845
- Rent YoY
- ▼ -2.50%
- Metro
- Los Angeles-Long Beach-Anaheim, CA
- State GDP YoY
- ▲ 3.21%
- F500 in state
- 116
Industry mix (Fortune 500 HQ in CA)
| Industry | F500 HQs | Revenue |
|---|---|---|
| Technology | 27 | $1,492B |
|
||
| Financial Services | 3 | $174B |
|
||
| Retail | 3 | $44B |
|
||
| Insurance | 3 | $26B |
|
||
| Media / Entertainment | 2 | $115B |
|
||
| Pharmaceuticals / Biotech | 2 | $62B |
|
||
Price history
+2804.1% since first listed31 events — show timeline
- 2026-03-29 Listed $638,900 CRMLS
- 2025-09-17 Listing Removed — CRMLS
- 2025-08-12 Price Changed $649,999 CRMLS
- 2025-07-07 Price Changed $675,000 CRMLS
- 2025-05-06 Price Changed $699,999 CRMLS
- 2025-04-14 Listed $725,000 CRMLS
- 2022-08-25 Listing Removed — CRMLS
- 2022-04-09 Price Changed $699,300 CRMLS
- 2022-03-17 Listed $737,400 CRMLS
- 2014-10-08 Listing Removed — CRMLS
- 2014-06-03 Price Changed $425,000 CRMLS
- 2014-05-03 Listed $450,000 CRMLS
- 2009-10-02 Sold (MLS) $225,000 TheMLS
- 2009-07-18 Delisted — TheMLS
- 2009-07-15 Relisted — TheMLS
- 2009-07-15 Price Changed $194,000 TheMLS
- 2009-07-14 Delisted — TheMLS
- 2009-06-03 Relisted — TheMLS
- 2009-04-23 Delisted — TheMLS
- 2009-02-14 Listed $265,000 TheMLS
- 2006-04-03 Sold (Public Records) $499,000 Public Records
- 2006-04-03 Sold (MLS) $499,000 CRMLS
- 2006-02-16 Listed $499,000 CRMLS
- 2006-02-13 Listing Removed — CRMLS
- 2006-02-03 Listing Removed — CRMLS
- 2005-12-12 Listed $499,000 CRMLS
- 2005-08-03 Listed $499,000 CRMLS
- 2004-04-09 Sold (Public Records) $255,000 Public Records
- 2004-03-09 Listing Removed — CRMLS
- 2003-10-11 Listed $260,000 CRMLS
- 1979-02-28 Sold (Public Records) $22,000 Public Records
Property tax history
-2.9%/yrLatest (2025): $3,918 · +2.0% YoY. Source: county tax records.
Cash-flow waterfall
monthlySold comps — $/sqft
last 12 mo · ≤1 miLoading sold comps…