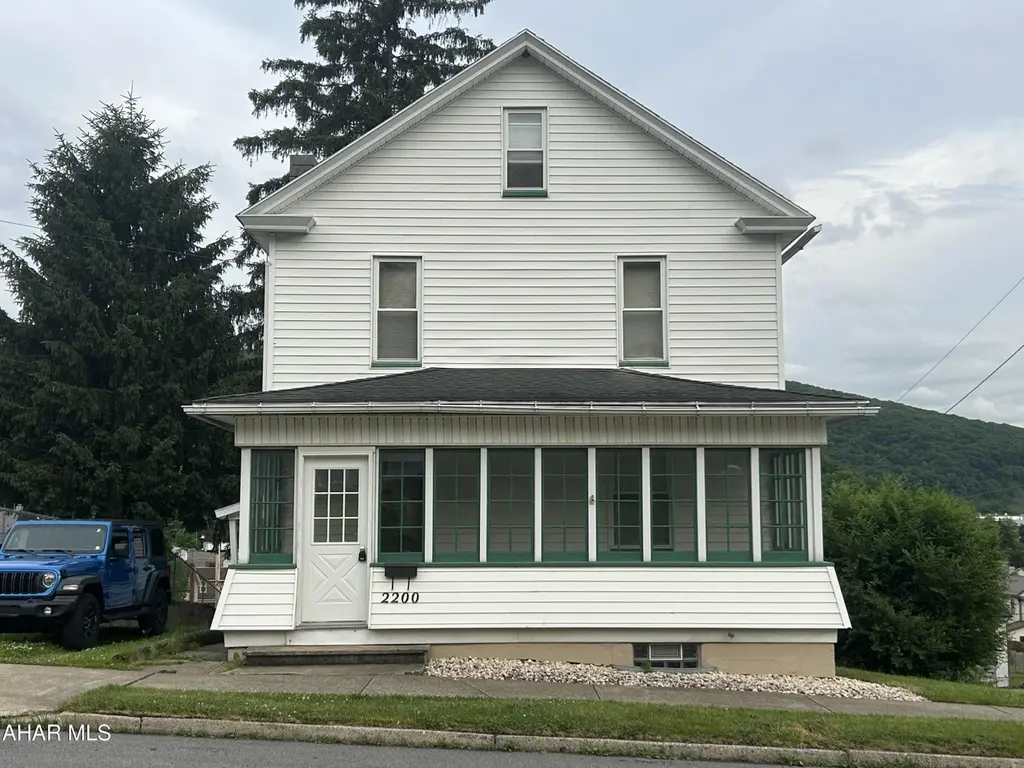
2200 Adams Ave · Tyrone, PA
Flood risk 1/10 · Minimal
- FEMA flood zone
- X (unshaded)
- Chance of flooding over 30 yrs
- 0.0%
- Est. flood insurance / yr
- $507 – $1,088
Fire risk 1/10 · Minimal
- Est. fire insurance / yr
- $511 – $949
Heat risk 4/10 · Minor
- Hot days now (above 96°F)
- 8 days/yr
- Hot days in 30 yrs
- 18 days/yr
Wind risk 2/10 · Minimal
- Chance of severe wind over 30 yrs
- —
Air-quality risk 2/10 · Minimal
- Unhealthy air days now
- 1 days/yr
- Unhealthy air days in 30 yrs
- 2 days/yr
Risk factors via First Street. Map © Google.
Why this score? — see what drove the C+ grade
The composite is a weighted blend of 9 inputs, each scored 0–100. Each bar is that input's sub-score; the figure is the points it added to the 100-point composite (weight × sub-score).
- Cash flow +17.6/30.0
- ARV discount +15.0/15.0
- DSCR +5.5/10.0
- 1% rule +5.0/10.0
- Appreciation +4.1/10.0
- Schools +3.9/10.0
- Livability +3.9/5.0
- Rent growth +2.5/5.0
- Condition / age +2.5/5.0
$98,000
🖨 Deal sheet 📄 Offer letter ✓ Due diligence
Listing remarks MLS
Good 2.5 story on a large corner lot with 3 bedrooms, 1 bath (3/4), LR, DR, kitchen with closed-in front & back porches. Back porch has a beautiful view of Borough & mountains. A one car garage at the base of the lot. Updated siding, roof, windows, electric service, OFA furnace. Large entrance foyer. Attic could be finished. Low taxes & reasonably priced! As-IS condition. Home Warranty!
Key facts
- 0.28 acre lot
- Garage
- Built 1940
Neighborhood map
What this means for you Summary
Snapshot
- This is a 3-bed/1.0-bath single-family listed at $98k.
Deal economics
- At list price, monthly cash flow is $78 ($936/yr) — positive.
- The deal already cash-flows at list — no discount required.
- Meets the 1% rule at list price ($982 rent vs $98k).
- Cap rate 7.2% vs local median 3.5% in Tyrone — top-decile yield for the area; either an underpriced asset or a hidden risk that comps aren't pricing in. Stress-test before assuming the spread holds.
Location & tenants
- Location reads 77/100 on livability (#319 in PA, #2,838 nationally) — a middle-class / working-renter tenant base. Strengths: cost of living A+, housing A+, health & safety A+; Watch: amenities D, commute F, employment F.
- Tyrone Area SD (town): math 35% / reading 57% proficiency, ranked #263 of 539 in PA (top 49%) — families likely to look elsewhere, expect single-tenant / working-renter base with shorter leases.
- Market conditions: 51 active listings in the ZIP; 99 units permitted in Blair County in 2024 (0 in 5+ unit buildings).
Forward outlook
- Local home prices are declining (-1.8%/yr); year-one equity from $678 of loan paydown is wiped out by about $2k of value loss. Plan a longer hold.
- Blair County population projected at -18% by 2050 — secular population decline; favor cash flow + early exit over multi-decade hold.
Negotiation context
- Only 0 days on market — expect competitive offers; lowballing is unlikely to land.
- 2 sale attempts since 13y ago with the ask held roughly flat each time — persistent listings suggest the price (not the market) is what's stuck; bring a comps-based counter.
- Current owner paid $46k; list at $98k implies a 113% gain — meaningful room to come down on a strong offer.
Risks & watch-outs
- Watch-outs: built in 1940 — expect roof / HVAC / electrical / plumbing capex.
Questions for the listing agent
- Built in 1940 — when were the roof, HVAC, electrical panel, plumbing, and water heater last replaced?
- Is there a deadline driving the sale (1031 exchange, divorce, estate, relocation)? That informs how much negotiation room exists.
- Schools are A-rated — typically a magnet for longer-tenancy family renters. What's the average tenant stay here, and is there a school-zone premium baked into asking?
- What's the average days-on-market for RENTAL listings here right now (not sales)? A rising rental-DOM trend means longer vacancies and softer asking-rent achievability than the comps imply.
- What's the recent tenant-quality profile in this submarket — average credit score on applications, eviction rate, late-payment / NSF rate, and stable-employment percentage? A property-management company in the area should have these aggregated.
- How much new for-sale + rental construction is in the pipeline within 1–3 miles? Heavy new supply typically softens prices + rents 12–24 months out; constrained supply supports both.
Investment metrics
- 1% rule
- 1.00% ✓
- Cap rate
- 7.25%
- Cash-on-cash
- 3.41%
- DSCR
- 1.15
- GRM
- 8.3
CMA / ARV
- ARV (on-the-fly)
- $129,792
- Comps found
- 9
Show comp detail 9 sales within ~0.75 mi
| Address | Dist | Beds/Ba | Sqft | Sold | Price | $/sf | Match |
|---|---|---|---|---|---|---|---|
| 2121 Columbia Ave | 0.07mi | 3/1.0 | 1,281 (+3%) | 9mo | $60,000 | $47 | 85 |
| 413 W 22nd St | 0.04mi | 2/1.0 (-1) | 1,222 (-2%) | 8mo | $72,500 | $59 | 82 |
| 521 26th St | 0.29mi | 3/1.0 | 1,220 (-2%) | 12mo | $190,000 | $156 | 72 |
| 2001 Riddle Ave | 0.18mi | 3/1.0 | 1,341 (+8%) | 13mo | $160,000 | $119 | 68 |
| 2107 Glad Ave | 0.24mi | 3/1.5 | 1,332 (+7%) | 14mo | $100,000 | $75 | 64 |
| 2002 Riddle Ave | 0.19mi | 3/1.5 | 1,334 (+7%) | 22mo | $199,999 | $150 | 60 |
| 682 Decker Hollow Rd | 0.47mi | 3/2.0 | 1,336 (+7%) | 10mo | $213,400 | $160 | 53 |
| 1465 Logan Ave | 0.64mi | 3/1.5 | 1,410 (+13%) | 4mo | $72,000 | $51 | 43 |
| 256 Meade St | 0.50mi | 2/1.0 (-1) | 1,158 (-7%) | 23mo | $120,000 | $104 | 40 |
Match score weights: distance 35% · size 25% · config 20% · recency 20%. Top-matched comps best support the ARV.
Projected returns pro-forma
-1.77% appreciation · 3.0% rent growth · sell at horizon
- IRR
- -5.1%
- Equity multiple
- 0.79×
- Total profit
- $-5,756
- Equity at exit
- $20,068
- IRR
- 2.6%
- Equity multiple
- 1.22×
- Total profit
- $6,125
- Equity at exit
- $18,147
Cash invested: $27,440 (down + closing). Projections, not guarantees.
Landlord ↔ Tenant lean methodology
- Overall (STATE)
- 62 Landlord-Friendly
- State Pennsylvania
- 62 Landlord-Friendly · EVEN
- County
- — inherits STATE
- City
- — inherits STATE
ZIP-level market 16686
- Home prices YoY
- -0.7%
- Active inventory
- 51
- Price-to-rent
- 8.3×
Monthly cashflow live
- Estimated rent
- $982 medium interval (Pro) →
- Mortgage (P&I)
- −$514
- Tax from tax record
- −$143 /mo · $1,713/yr
- Insurance
- −$41
- HOA
- −$0
- Vacancy / Maint / Mgmt
- −$206
- Net cashflow
- $78
Break-even live
UW: 25.0% down · 7.5% · 30yr · 1.5% tax · 5.0% vac · 8.0% maint · 8.0% mgmt
Financing live
Cash to close
- Down payment
- $24,500
- Closing costs
- $2,940
- Reserves months
- —
- Total cash needed
- —
Loan-product check · same deal, 3 products live
Conventional
25% down · 7.5% · 30yr
- Down + closing
- —
- Monthly P&I
- —
- Monthly cashflow
- —
- DSCR
- —
- Eligible?
- —
Personal DTI + credit; lowest rate.
DSCR
20% down · 8.5% · 30yr
- Down + closing
- —
- Monthly P&I
- —
- Monthly cashflow
- —
- DSCR
- —
- Eligible?
- —
No personal income docs; deal must DSCR.
Hard money
10% down · 12.0% · 12mo
- Down + closing
- —
- Monthly P&I
- —
- Monthly cashflow
- —
- DSCR
- —
- Eligible?
- —
Short-term bridge; refi at stabilization.
Listing history 2 events
-
2026-06-17remarks 578-char remark
-
2026-06-17$98,000 Pending
ⓘ Source: listings_history table (triggers on properties + properties_extension) + one-shot
backfill from property_details.listing_events for pre-trigger history.
Tax reassessment forecast PA · Partial reset (capped growth)
- Current annual tax
- $1,713 · $143/mo
- Projected year-2 tax
- $1,713 · $143/mo
- Expected delta
- $0/yr ($0/mo · 0.0%)
ⓘ Screening estimate from a state-policy table — verify with the county assessor before closing.
Climate risk First Street
- Flood 1/10 Low FEMA zone X (unshaded) · 0% chance over 30 yrs
- Wildfire 1/10 Low
- Heat 4/10 Moderate 8 d/yr ≥96°F today · 18 d/yr by 30 yrs out
- Wind 2/10 Low
- Air quality 2/10 Low 1 unhealthy d/yr today · 2 by 30 yrs out
Nearby sold comps map
Loading sold comps map…
Walkable amenities ~0.75 mi
Loading nearby amenities…
Taxation est. · year 1
- Rental income
- $11,780
- − Mortgage interest
- −$5,490
- − Property taxes
- −$1,713
- − Insurance
- −$490
- − Repairs & maintenance
- −$942
- − Management
- −$942
- − Depreciation
- −$2,851
- Taxable loss
- −$648
- Est. tax savings @ 24.0%
- +$156
- After-tax cash flow
- $1,092/yr
For passive investors: Depreciation is non-cash, so a rental often shows a tax loss while cash-flowing — sheltering income. Rental losses are passive: they offset passive income freely, and up to $25,000/yr can offset ordinary (W-2) income if you actively participate and your MAGI is under $100k (phasing out to $0 by $150k); unused losses carry forward. On sale, claimed depreciation is recaptured at up to 25%, and gains may owe capital-gains tax (a 1031 exchange can defer both). Figures are a year-1 estimate at your 24.0% rate — not tax advice; consult a CPA.
Schools (NCES district)
- District
- Tyrone Area SD
- NCES district ID
- 4224030
- Math proficiency
- 35% ▼ -10.00%
- Reading proficiency
- 57% ▼ -14.00%
- Median HH income
- $45,447
- Composite
- 38.94/100
- National rank
- #4089
- State rank
- #263 of 539 in PA
Livability — Tyrone
- Score
- 77/100
- State rank
- #319
- US rank
- #2838
Category grades
Schools grade is shown separately in the Schools card above.
Census & demographics
- Census place
- Tyrone, PA
- City population
- 13,000
- Population (ZIP)
- 13,000
Population outlook (Blair County) Hauer SSP2
- Today (2025)
- 121,571 people
- By 2030
- 117,966 · -3.0%
- By 2040
- 109,174 · -10.2%
- By 2050
- 99,542 · -18.1%
- By 2075
- 76,775 · -36.8%
- By 2100
- 54,326 · -55.3%
Race, ethnicity, and origin ACS 2023
- Neighborhood character
- Predominantly White (96%)
- Race & ethnicity
- White 96% Two or more races 2% Hispanic / Latino 2%
- Common ancestry
- Romanian 3% Slovak 2% Subsaharan African 1%
- Foreign-born
- 1%
- Languages at home
- 97% English-only · German/W. Germanic 2% Spanish 1%
Political lean MEDSL · Blair
- 2024 margin
- Solid R (+43.5) · D 27.9% · R 71.4%
- 2008→2024 swing
- -19.2pp toward R · 2008: -24.3pp · 2024: -43.5pp
- All cycles
- 2024: R+43.5 2020: R+43.5 2016: R+46.4 2012: R+33.5 2008: R+24.3
Not yet ingested
- Civics
- —
Market trends
- HPI YoY
- ▼ -1.77%
- Current HPI
- 254.3042
- Rent YoY
- —
- Metro
- —
- State GDP YoY
- ▲ 1.68%
- F500 in state
- 34
Industry mix (Fortune 500 HQ in PA)
| Industry | F500 HQs | Revenue |
|---|---|---|
| Healthcare | 2 | $309B |
|
||
| Insurance | 2 | $27B |
|
||
| Telecommunications / Media | 1 | $124B |
|
||
| Industrial Distribution | 1 | $22B |
|
||
| Financial Services | 1 | $20B |
|
||
| Chemicals / Materials | 1 | $18B |
|
||
Price history
+96.4% since first listed5 events — show timeline
- 2026-06-12 Delisted — AHARMLS
- 2026-06-11 Listed $98,000 AHARMLS
- 2013-05-15 Sold (Public Records) $46,000 Public Records
- 2013-05-15 Sold (MLS) $46,000 AHARMLS
- 2013-02-19 Listed $49,900 AHARMLS
Property tax history
+5.2%/yrLatest (2025): $1,713 · +7.1% YoY. Source: county tax records.
Cash-flow waterfall
monthlySold comps — $/sqft
last 12 mo · ≤1 miLoading sold comps…