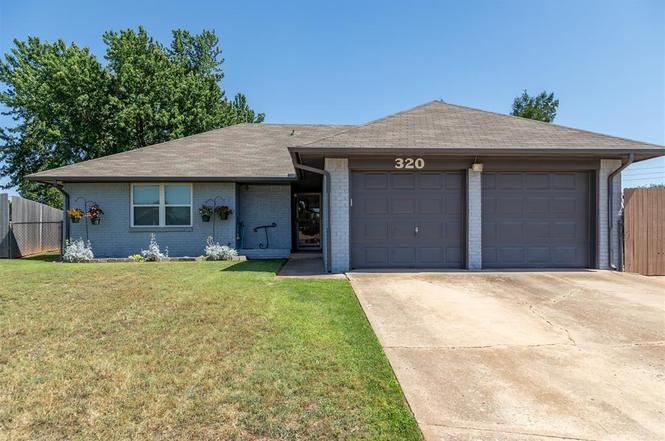
320 E Elder Ln · Mustang, OK
Flood risk 1/10 · Minimal
- FEMA flood zone
- X (unshaded)
- Chance of flooding over 30 yrs
- 0.0%
- Est. flood insurance / yr
- $507 – $1,088
Fire risk 4/10 · Minor
- Est. fire insurance / yr
- $2,463 – $4,575
Heat risk 6/10 · Moderate
- Hot days now (above 106°F)
- 7 days/yr
- Hot days in 30 yrs
- 19 days/yr
Wind risk 2/10 · Minimal
- Chance of severe wind over 30 yrs
- 4.0%
Air-quality risk 1/10 · Minimal
- Unhealthy air days now
- 0 days/yr
- Unhealthy air days in 30 yrs
- 0 days/yr
Risk factors via First Street. Map © Google.
Why this score? — see what drove the D+ grade
The composite is a weighted blend of 9 inputs, each scored 0–100. Each bar is that input's sub-score; the figure is the points it added to the 100-point composite (weight × sub-score).
- Cash flow +19.7/30.0
- DSCR +6.2/10.0
- ARV discount +5.4/15.0
- 1% rule +4.5/10.0
- Livability +3.5/5.0
- Schools +3.1/10.0
- Condition / age +2.5/5.0
- Rent growth +2.4/5.0
- Appreciation +0.0/10.0
$170,000
🖨 Deal sheet (PDF) 📄 Offer letter ✓ Due diligence
Listing remarks MLS
Come see this adorable 3-bedroom home in Mustang school district! The home has been well-maintained featuring new carpet and paint throughout. Located in a quiet neighborhood cul-de-sac in the heart of Mustang. Great school system and just minutes to all the shopping and restaurants! Don't miss out on this little gem.
Key facts
- Roomy backyard space
- Painted cabinetry
- Updated landscaping
Tags
Property features AI
Finance
- Other: Lot size approximately 0.2076 acre; Homestead not indicated; Flood insurance not required (per listing); Located close to HWY-152 and the Kilpatrick Turnpike
- Financial info: Loan qualification permitted; Not assumable
- HOA & community: No mandatory association dues
Exterior
- Parking: 2-car garage
- Home design: Single-family residence; One-story; Existing property
- Construction: Brick construction; Composition roof; Slab foundation; Built (existing)
- Exterior features: Outbuildings; Located on a cul-de-sac
Interior
- Bedrooms: 3 bedrooms (all on one level)
- Bathrooms: 1 full bathroom
- Interior features: No fireplace; No in-law plan indicated; One living area; One dining area
Neighborhood map
What this means for you Summary
Snapshot
- This is a 3-bed/1.0-bath single-family listed at $170k.
Deal economics
- At list price, monthly cash flow is $200 ($2k/yr) — positive.
- The deal already cash-flows at list — no discount required.
- To meet the 1% rule (rent ≥ 1% of price), the offer needs to be $161k (5.1% below list).
- Recommended offer: $161k (5.1% below list) — sets the bar for 1% rule.
- Cap rate 7.7% vs local median 4.6% in Mustang — top-decile yield for the area; either an underpriced asset or a hidden risk that comps aren't pricing in. Stress-test before assuming the spread holds.
Location & tenants
- Location reads 69/100 on livability (#52 in OK) — a middle-class / working-renter tenant base. Strengths: crime A+, cost of living A+, housing A+; Watch: amenities F, commute F, health & safety F.
- Mustang (suburban): math 35% / reading 33% proficiency, ranked #28 of 270 in OK (top 10%) — families likely to look elsewhere, expect single-tenant / working-renter base with shorter leases.
- Zoned schools: Mustang Es (math 37% / reading 32%, grade F, #168 of 845 statewide, top 24%, 654 students, 0% FRL); Mustang Ms (math 30% / reading 29%, grade F, #52 of 345 statewide, top 15%, 723 students, 0% FRL); Mustang Hs (math 28% / reading 39%, grade F, #65 of 447 statewide, top 14%, 3,756 students, 0% FRL) — zoned schools average 0% FRL vs 28% district-wide (28 pts lower); this property's tenant base skews higher-income than the district average.
- Market conditions: Rents soft (-0.3%/yr); 523 active listings in the ZIP; 4 comparable units currently listed for rent nearby; rentals leasing fast (median 3d on market — plan ~1-2 weeks tenant-placement turnaround); solid renter incomes; 260 units permitted in Canadian County in 2024 (0 in 5+ unit buildings).
Forward outlook
- Local home prices are declining (-3.0%/yr); year-one equity from $1k of loan paydown is wiped out by about $5k of value loss. Plan a longer hold.
- Canadian County population projected at +64% by 2050 — long-run rental-demand tailwind backs the buy-and-hold thesis.
Negotiation context
- Only 10 days on market — expect competitive offers; lowballing is unlikely to land.
- 5 sale attempts since 19y ago with the ask held roughly flat each time — persistent listings suggest the price (not the market) is what's stuck; bring a comps-based counter.
Risks & watch-outs
- Climate carrying-cost: extreme-heat days projected 7→19/yr by 2055 (HVAC capex compounding) — expect insurance premiums to compound above CPI over the hold.
Questions for the listing agent
- Built in 1973 — when were the roof, HVAC, electrical panel, plumbing, and water heater last replaced?
- Is there a deadline driving the sale (1031 exchange, divorce, estate, relocation)? That informs how much negotiation room exists.
- The area grade is low — what's the realistic commute time and amenity access for the typical tenant pool here? Any planned neighborhood developments (good or bad) we should know about?
- What's the average days-on-market for RENTAL listings here right now (not sales)? A rising rental-DOM trend means longer vacancies and softer asking-rent achievability than the comps imply.
- What's the recent tenant-quality profile in this submarket — average credit score on applications, eviction rate, late-payment / NSF rate, and stable-employment percentage? A property-management company in the area should have these aggregated.
- How much new for-sale + rental construction is in the pipeline within 1–3 miles? Heavy new supply typically softens prices + rents 12–24 months out; constrained supply supports both.
Investment metrics
- 1% rule
- 0.95% ✗
- Cap rate
- 7.71%
- Cash-on-cash
- 5.05%
- DSCR
- 1.22
- GRM
- 8.8
CMA / ARV
- ARV (on-the-fly)
- $162,511
- Comps found
- 12
Show comp detail 12 sales within ~0.75 mi
| Address | Dist | Beds/Ba | Sqft | Sold | Price | $/sf | Match |
|---|---|---|---|---|---|---|---|
| 410 S Meadow Ln | 0.06mi | 3/1.5 | 1,015 (+2%) | 2mo | $175,000 | $172 | 90 |
| 115 S Meadow Ln | 0.18mi | 3/1.0 | 999 (+0%) | 13mo | $166,800 | $167 | 80 |
| 516 S Brookview Ln | 0.09mi | 3/1.0 | 876 (-12%) | 1mo | $138,500 | $158 | 75 |
| 709 S Meadow Ln | 0.17mi | 3/1.5 | 952 (-4%) | 15mo | $130,000 | $137 | 70 |
| 714 S Meadow Ln | 0.19mi | 3/1.0 | 900 (-10%) | 7mo | $146,500 | $163 | 69 |
| 116 E Juniper Ln | 0.36mi | 3/2.0 | 1,058 (+6%) | 10mo | $170,000 | $161 | 61 |
| 405 W Hillcrest Dr | 0.72mi | 3/1.5 | 992 (-0%) | 5mo | $170,000 | $171 | 60 |
| 142 E Forster Ln | 0.37mi | 2/1.0 (-1) | 971 (-3%) | 16mo | $153,000 | $158 | 60 |
| 138 E Carson Ln | 0.56mi | 3/2.0 | 1,096 (+10%) | 7mo | $189,000 | $172 | 47 |
| 246 W Chantilly Way | 0.73mi | 2/1.0 (-1) | 1,070 (+7%) | 7mo | $171,500 | $160 | 43 |
| 433 W Forest Dr | 0.75mi | 3/1.5 | 1,135 (+14%) | 6mo | $188,000 | $166 | 35 |
| 401 W Hillcrest Dr | 0.71mi | 3/1.5 | 1,124 (+13%) | 16mo | $174,000 | $155 | 30 |
Match score weights: distance 35% · size 25% · config 20% · recency 20%. Top-matched comps best support the ARV.
Projected returns pro-forma
-3.0% appreciation · 0.0% rent growth · sell at horizon
- IRR
- -11.7%
- Equity multiple
- 0.59×
- Total profit
- $-19,555
- Equity at exit
- $25,348
- IRR
- -7.2%
- Equity multiple
- 0.60×
- Total profit
- $-19,025
- Equity at exit
- $14,698
Cash invested: $47,600 (down + closing). Projections, not guarantees.
Landlord ↔ Tenant lean methodology
- Overall (STATE)
- 83 Strongly Landlord-Friendly
- State Oklahoma
- 83 Strongly Landlord-Friendly · R+20
- County
- — inherits STATE
- City
- — inherits STATE
ZIP-level market 73064
- Home prices YoY
- -17.9%
- Rents YoY
- -0.3%
- Active inventory
- 523
- Price-to-rent
- 8.8×
Monthly cashflow live
- Estimated rent
- $1,613 medium interval (Pro) →
- Mortgage (P&I)
- −$891
- Tax from tax record
- −$112 /mo · $1,344/yr
- Insurance
- −$71
- HOA
- −$0
- Vacancy / Maint / Mgmt
- −$339
- Net cashflow
- $200
Break-even live
Sensitivity live
| Price | -10% $297 | -5% $248 | +0% $200 | +5% $152 | +10% $104 |
|---|---|---|---|---|---|
| Rent | -10% $73 | -5% $137 | +0% $200 | +5% $264 | +10% $328 |
| Rate | -1.0pp $286 | -0.5pp $244 | base $200 | +0.5pp $156 | +1.0pp $111 |
UW: 25.0% down · 7.5% · 30yr · 1.5% tax · 5.0% vac · 8.0% maint · 8.0% mgmt
Financing live
Cash to close
- Down payment
- $42,500
- Closing costs
- $5,100
- Reserves months
- —
- Total cash needed
- —
Loan-product check · same deal, 3 products live
Conventional
25% down · 7.5% · 30yr
- Down + closing
- —
- Monthly P&I
- —
- Monthly cashflow
- —
- DSCR
- —
- Eligible?
- —
Personal DTI + credit; lowest rate.
DSCR
20% down · 8.5% · 30yr
- Down + closing
- —
- Monthly P&I
- —
- Monthly cashflow
- —
- DSCR
- —
- Eligible?
- —
No personal income docs; deal must DSCR.
Hard money
10% down · 12.0% · 12mo
- Down + closing
- —
- Monthly P&I
- —
- Monthly cashflow
- —
- DSCR
- —
- Eligible?
- —
Short-term bridge; refi at stabilization.
Rent comps 4 comps
| Address | Beds | Baths | Sqft | Rent | $/sqft | DOM | Units | Dist |
|---|---|---|---|---|---|---|---|---|
| Greens at Mustang Creek Mustang, OK | 1.0–2.0 | 1.0–2.0 | 818 | $1,275 | $1.56 | 3d | 1 | 0.40mi |
| 742 W Juniper Dr Mustang, OK | 3.0 | 1.5 | 1100 | $1,475 | $1.34 | 3d | 1 | 1.14mi |
| 733 W Perry Dr Mustang, OK | 3.0 | 1.5 | 999 | $1,345 | $1.35 | 3d | 1 | 1.20mi |
| 736 W Celestial Way Mustang, OK | 1.0–2.0 | 1.0 | 838 | $1,695 | $2.02 | 3d | 8 | 1.22mi |
Listing history 7 events
-
2026-06-21days on market $170,000 Active 10 DOM
-
2026-06-18days on market $170,000 Active 7 DOM
-
2026-06-17days on market $170,000 Active 6 DOM
-
2026-06-16days on market $170,000 Active 5 DOM
-
2026-06-15days on market $170,000 Active 4 DOM
-
2026-06-13remarks 699-char remark
-
2026-06-13$170,000 Active 2 DOM
ⓘ Source: listings_history table (triggers on properties + properties_extension) + one-shot
backfill from property_details.listing_events for pre-trigger history.
Tax reassessment forecast OK · Resets to sale price
- Current annual tax
- $1,344 · $112/mo
- Projected year-2 tax
- $1,530 · $127/mo
- Expected delta
- +$186/yr (+$15/mo · 13.8%)
ⓘ Screening estimate from a state-policy table — verify with the county assessor before closing.
Climate risk First Street
- Flood 1/10 Low FEMA zone X (unshaded) · 0% chance over 30 yrs
- Wildfire 4/10 Moderate
- Heat 6/10 Major 7 d/yr ≥106°F today · 19 d/yr by 30 yrs out
- Wind 2/10 Low 4% chance of damaging wind over 30 yrs
- Air quality 1/10 Low 0 unhealthy d/yr today · 0 by 30 yrs out
Nearby sold comps map
Loading sold comps map…
Walkable amenities ~0.75 mi
Loading nearby amenities…
Taxation est. · year 1
- Rental income
- $19,362
- − Mortgage interest
- −$9,523
- − Property taxes
- −$1,344
- − Insurance
- −$850
- − Repairs & maintenance
- −$1,549
- − Management
- −$1,549
- − Depreciation
- −$4,945
- Taxable loss
- −$398
- Est. tax savings @ 24.0%
- +$96
- After-tax cash flow
- $2,499/yr
For passive investors: Depreciation is non-cash, so a rental often shows a tax loss while cash-flowing — sheltering income. Rental losses are passive: they offset passive income freely, and up to $25,000/yr can offset ordinary (W-2) income if you actively participate and your MAGI is under $100k (phasing out to $0 by $150k); unused losses carry forward. On sale, claimed depreciation is recaptured at up to 25%, and gains may owe capital-gains tax (a 1031 exchange can defer both). Figures are a year-1 estimate at your 24.0% rate — not tax advice; consult a CPA.
Schools (NCES district)
- District
- Mustang
- NCES district ID
- 4021000
- Math proficiency
- 35% ▼ -10.00%
- Reading proficiency
- 33% ▼ -7.00%
- Median HH income
- $67,559
- Composite
- 31.21/100
- National rank
- #6038
- State rank
- #28 of 270 in OK
Livability — Mustang
- Score
- 69/100
- State rank
- #52
- US rank
- #8746
Category grades
Schools grade is shown separately in the Schools card above.
Census & demographics
- Census place
- Mustang, OK
- County
- Canadian County · 154,341 people
- City population
- 28,919
- Metro
- Oklahoma City, OK
- Population (ZIP)
- 28,919
- Household income
- $94,402
- Rent vs Own
- Severe rent burden
- 384.0
Population outlook (Canadian County) Hauer SSP2
- Today (2025)
- 174,062 people
- By 2030
- 195,170 · +12.1%
- By 2040
- 239,293 · +37.5%
- By 2050
- 285,457 · +64.0%
- By 2075
- 403,766 · +132.0%
- By 2100
- 498,766 · +186.5%
Race, ethnicity, and origin ACS 2023
- Neighborhood character
- Predominantly White (74%)
- Race & ethnicity
- White 74% Two or more races 11% Hispanic / Latino 10% Native American 3% Black 3% Asian 2%
- Hispanic origin (detail)
- Mexican 8%
- Common ancestry
- Italian 2% Scottish 2% Slovak 2%
- Foreign-born
- 4% · Canada, Vietnam
- Languages at home
- 93% English-only · Spanish 5% Other Indo-European 1% Tagalog/Filipino 1%
Political lean MEDSL · Canadian
- 2024 margin
- Solid R (+40.4) · D 28.8% · R 69.2% · Other 2.0%
- 2008→2024 swing
- +11.9pp toward D · 2008: -52.2pp · 2024: -40.4pp
- All cycles
- 2024: R+40.4 2020: R+43.3 2016: R+51.2 2012: R+54.4 2008: R+52.2
Not yet ingested
- Civics
- —
Market trends
- HPI YoY
- ▼ -56.66%
- Current HPI
- 260.2863
- Rent YoY
- ▼ -0.33%
- Metro
- Oklahoma City, OK
- State GDP YoY
- ▲ 1.55%
- F500 in state
- 6
Industry mix (Fortune 500 HQ in OK)
| Industry | F500 HQs | Revenue |
|---|---|---|
| Energy | 3 | $48B |
|
||
Price history
+157.6% since first listed17 events — show timeline
- 2026-06-02 Listed $170,000 MLSOK
- 2025-02-27 Sold (Public Records) $157,000 Public Records
- 2025-02-14 Sold (MLS) $157,000 MLSOK
- 2025-01-09 Pending — MLSOK
- 2024-12-18 Listed $157,000 MLSOK
- 2018-08-28 Sold (MLS) $95,400 MLSOK
- 2018-07-30 Pending — MLSOK
- 2018-07-26 Sold (Public Records) $73,500 Public Records
- 2018-07-25 Listed $99,900 MLSOK
- 2018-07-17 Sold (Public Records) $70,000 Public Records
- 2018-06-25 Sold (MLS) $70,000 MLSOK
- 2018-06-05 Pending — MLSOK
- 2018-06-05 Listed $70,000 MLSOK
- 2007-08-16 Sold (MLS) $67,000 MLSOK
- 2007-05-22 Listed $70,000 MLSOK
- 2002-05-27 Sold (Public Records) $74,000 Public Records
- 2001-10-23 Sold (Public Records) $66,000 Public Records
Property tax history
+3.3%/yrLatest (2025): $1,344 · +6.2% YoY. Source: county tax records.
Cash-flow waterfall
monthlySold comps — $/sqft
last 12 mo · ≤1 miLoading sold comps…