 Fourplex
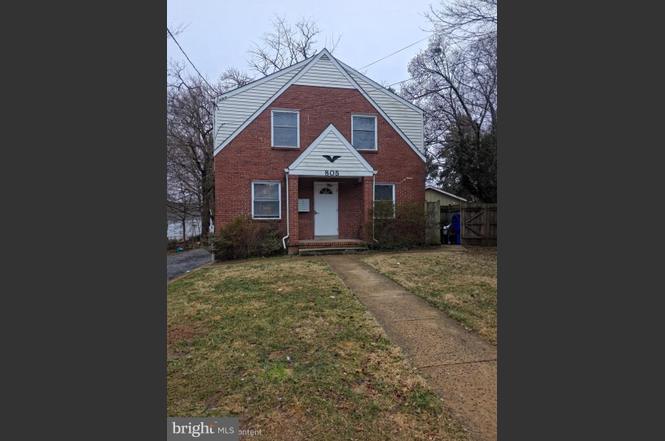
805 Houston Ave · Silver Spring, MD
Flood risk 1/10 · Minimal
- FEMA flood zone
- X (unshaded)
- Chance of flooding over 30 yrs
- 0.0%
- Est. flood insurance / yr
- $507 – $1,088
Fire risk 1/10 · Minimal
- Est. fire insurance / yr
- $755 – $1,403
Heat risk 7/10 · Major
- Hot days now (above 105°F)
- 7 days/yr
- Hot days in 30 yrs
- 15 days/yr
Wind risk 4/10 · Minor
- Chance of severe wind over 30 yrs
- 17.0%
Air-quality risk 4/10 · Minor
- Unhealthy air days now
- 5 days/yr
- Unhealthy air days in 30 yrs
- 6 days/yr
Risk factors via First Street. Map © Google.
Why this score? — see what drove the B grade
The composite is a weighted blend of 9 inputs, each scored 0–100. Each bar is that input's sub-score; the figure is the points it added to the 100-point composite (weight × sub-score).
- Cash flow +30.0/30.0
- DSCR +10.0/10.0
- 1% rule +9.8/10.0
- ARV discount +7.5/15.0
- Livability +4.2/5.0
- Schools +3.6/10.0
- Rent growth +3.0/5.0
- Condition / age +2.5/5.0
- Appreciation +0.0/10.0
$659,900
🖨 Deal sheet 📄 Offer letter ✓ Due diligence
Multi-family units
County records classify this as Multi-Family (5+ Unit). Listing-text estimate: 4 units. estimate disagrees with records
5+ unit building — per-unit beds/baths from public records are typically unavailable; the breakdown below (if shown) is an estimate from the listing text.
Listing remarks
Exceptional 4-unit multifamily opportunity in the heart of Takoma Park. Each unit features 1 bedroom and 1 bathroom, offering strong rental appeal and consistent income potential. Three units are currently tenant-occupied. Showings are limited to the upper-level vacant unit#3 and the common areas only. The property includes an unfinished basement with a designated laundry area, which houses the water heaters and utility meters, providing centralized utility access and additional storage options. Each unit has separate utilities (tenants pay for electricity), while the owner covers the water bill. The estimated above-grade finished square footage is approximately 2,100 square feet, as no pu
Key facts
- Separate utilities
- Unfinished basement
- 6,098 sq ft lot
Tags
Neighborhood map
What this means for you Summary
Snapshot
- This is a 4 × 4-bed/?-bath units multifamily listed at $660k.
Deal economics
- At list price, monthly cash flow is $3k ($39k/yr) — positive. Per door: $821/mo.
- The deal already cash-flows at list — no discount required.
- Meets the 1% rule at list price ($10k rent vs $660k).
- Cap rate 12.3% vs local median 2.4% in Silver Spring — top-decile yield for the area; either an underpriced asset or a hidden risk that comps aren't pricing in. Stress-test before assuming the spread holds.
Location & tenants
- Location reads 83/100 on livability (#27 in MD, #973 nationally) — a professional / high-income tenant draw. Strengths: amenities A+, commute A+, employment A+; Watch: cost of living F.
- Montgomery County Public Schools (suburban): math 27% / reading 45% proficiency, ranked #3 of 24 in MD (top 12%) — families likely to look elsewhere, expect single-tenant / working-renter base with shorter leases.
- Market conditions: Rents rising (+1.9%/yr); 59 active listings in the ZIP; solid renter incomes; 3,880 units permitted in Montgomery County in 2024 (2,054 in 5+ unit buildings).
- At $9,783/mo this rent would consume 140% of the median local household income ($84k/yr) (locally 1516% of renters already pay >50% of income on rent) — very limited rent-growth headroom before tenants either downsize or default.
Forward outlook
- Local home prices are declining (-3.0%/yr); year-one equity from $5k of loan paydown is wiped out by about $20k of value loss. Plan a longer hold.
- Montgomery County population projected at +27% by 2050 — long-run rental-demand tailwind backs the buy-and-hold thesis.
- At projected returns (-3.0% appreciation + 1.9% rent growth), your $185k cash investment doubles in ~7 years — after that, you're playing with house money.
Negotiation context
- Only 11 days on market — expect competitive offers; lowballing is unlikely to land.
- 8 sale attempts since 29y ago with the ask held roughly flat each time — persistent listings suggest the price (not the market) is what's stuck; bring a comps-based counter.
- Current owner paid $286k; list at $660k implies a 131% gain — meaningful room to come down on a strong offer.
Risks & watch-outs
- Watch-outs: built in 1939 — expect roof / HVAC / electrical / plumbing capex.
- Climate carrying-cost: extreme-heat days projected 7→15/yr by 2055 (HVAC capex compounding) — expect insurance premiums to compound above CPI over the hold.
Questions for the listing agent
- Can we see the unit-by-unit rent roll, current vacancy, and any below-market leases? What's the average tenancy length?
- What capital expenditures (roof, boiler, parking lot, exteriors) have been made in the last 5 years, and what's planned in the next 2?
- Built in 1939 — when were the roof, HVAC, electrical panel, plumbing, and water heater last replaced?
- Is there a deadline driving the sale (1031 exchange, divorce, estate, relocation)? That informs how much negotiation room exists.
- What's the average days-on-market for RENTAL listings here right now (not sales)? A rising rental-DOM trend means longer vacancies and softer asking-rent achievability than the comps imply.
- What's the recent tenant-quality profile in this submarket — average credit score on applications, eviction rate, late-payment / NSF rate, and stable-employment percentage? A property-management company in the area should have these aggregated.
- How much new apartment / multifamily construction is in the pipeline within 1–3 miles? Heavy new supply (>2% of stock underway) typically softens rents 12–24 months out; light construction supports rent growth.
Investment metrics
- 1% rule
- 1.48% ✓
- Cap rate
- 12.27%
- Cash-on-cash
- 21.34%
- DSCR
- 1.95
- GRM
- 5.6
CMA / ARV
No comps found within radius.
Projected returns pro-forma
-3.0% appreciation · 1.91% rent growth · sell at horizon
- IRR
- 12.6%
- Equity multiple
- 1.50×
- Total profit
- $91,782
- Equity at exit
- $98,393
- IRR
- 20.7%
- Equity multiple
- 2.66×
- Total profit
- $307,066
- Equity at exit
- $57,056
Cash invested: $184,772 (down + closing). Projections, not guarantees.
Landlord ↔ Tenant lean methodology
- Overall (STATE)
- 27 Tenant-Leaning
- State Maryland
- 27 Tenant-Leaning · D+14
- County
- — inherits STATE
- City
- — inherits STATE
ZIP-level market 20912
- Rents YoY
- 1.9%
- Active inventory
- 59
- Price-to-rent
- 22.5×
Monthly cashflow live
- Estimated rent
- $9,783 medium interval (Pro) →
- Mortgage (P&I)
- −$3,461
- Tax from tax record
- −$708 /mo · $8,491/yr
- Insurance
- −$275
- HOA
- −$0
- Vacancy / Maint / Mgmt
- −$2,054
- Net cashflow
- $3,285
Break-even live
4-unit breakdown (identical units grouped — click to expand)
| Units | Beds | Baths | Est. rent |
|---|---|---|---|
| 4× units | 4 | — | $9,784 |
| #1 | 4 | — | $2,446 |
| #2 | 4 | — | $2,446 |
| #3 | 4 | — | $2,446 |
| #4 | 4 | — | $2,446 |
| Total (4 units) | $9,783 | ||
UW: 25.0% down · 7.5% · 30yr · 1.5% tax · 5.0% vac · 8.0% maint · 8.0% mgmt
Financing live
Cash to close
- Down payment
- $164,975
- Closing costs
- $19,797
- Reserves months
- —
- Total cash needed
- —
Loan-product check · same deal, 3 products live
Conventional
25% down · 7.5% · 30yr
- Down + closing
- —
- Monthly P&I
- —
- Monthly cashflow
- —
- DSCR
- —
- Eligible?
- —
Personal DTI + credit; lowest rate.
DSCR
20% down · 8.5% · 30yr
- Down + closing
- —
- Monthly P&I
- —
- Monthly cashflow
- —
- DSCR
- —
- Eligible?
- —
No personal income docs; deal must DSCR.
Hard money
10% down · 12.0% · 12mo
- Down + closing
- —
- Monthly P&I
- —
- Monthly cashflow
- —
- DSCR
- —
- Eligible?
- —
Short-term bridge; refi at stabilization.
Listing history 23 events
-
2026-03-27status Pending
-
2026-03-19status Active
-
2026-03-04status Pending
-
2026-03-04historical
-
2026-03-01$659,900 Active
-
2022-04-18historical
-
2022-04-15$610,000 Active
-
2022-04-15$610,000
-
2022-04-15historical
-
2002-11-20soldstatus $286,000
-
2002-10-30soldstatus $286,000
-
2002-09-27historical
-
2002-09-13$280,000
-
2001-04-12soldstatus $236,100
-
2001-04-03soldstatus $236,100
-
2001-04-03soldstatus $236,100
-
2001-01-28historical
-
2001-01-18historical
-
2000-10-30$229,000
-
2000-10-26$229,000
-
1997-10-22historical
-
1997-07-22
-
1982-07-28soldstatus $105,000
ⓘ Source: listings_history table (triggers on properties + properties_extension) + one-shot
backfill from property_details.listing_events for pre-trigger history.
Tax reassessment forecast MD · Partial reset (capped growth)
- Current annual tax
- $8,491 · $708/mo
- Projected year-2 tax
- $8,491 · $708/mo
- Expected delta
- $0/yr ($0/mo · 0.0%)
ⓘ Screening estimate from a state-policy table — verify with the county assessor before closing.
Climate risk First Street
- Flood 1/10 Low FEMA zone X (unshaded) · 0% chance over 30 yrs
- Wildfire 1/10 Low
- Heat 7/10 Severe 7 d/yr ≥105°F today · 15 d/yr by 30 yrs out
- Wind 4/10 Moderate 17% chance of damaging wind over 30 yrs
- Air quality 4/10 Moderate 5 unhealthy d/yr today · 6 by 30 yrs out
Nearby sold comps map
Loading sold comps map…
Walkable amenities ~0.75 mi
Loading nearby amenities…
Taxation est. · year 1
- Rental income
- $117,396
- − Mortgage interest
- −$36,965
- − Property taxes
- −$8,491
- − Insurance
- −$3,300
- − Repairs & maintenance
- −$9,392
- − Management
- −$9,392
- − Depreciation
- −$19,197
- Taxable income
- $30,661
- Est. tax owed @ 24.0%
- −$7,359
- After-tax cash flow
- $32,067/yr
For passive investors: Depreciation is non-cash, so a rental often shows a tax loss while cash-flowing — sheltering income. Rental losses are passive: they offset passive income freely, and up to $25,000/yr can offset ordinary (W-2) income if you actively participate and your MAGI is under $100k (phasing out to $0 by $150k); unused losses carry forward. On sale, claimed depreciation is recaptured at up to 25%, and gains may owe capital-gains tax (a 1031 exchange can defer both). Figures are a year-1 estimate at your 24.0% rate — not tax advice; consult a CPA.
Schools (NCES district)
- District
- Montgomery County Public Schools
- NCES district ID
- 2400480
- Math proficiency
- 27% ▼ -21.00%
- Reading proficiency
- 45% ▼ -10.00%
- Median HH income
- $97,191
- Composite
- 35.62/100
- National rank
- #4889
- State rank
- #3 of 24 in MD
Livability — Silver Spring
- Score
- 83/100
- State rank
- #27
- US rank
- #973
Category grades
Schools grade is shown separately in the Schools card above.
Census & demographics
- Census place
- Silver Spring, MD
- County
- Montgomery County · 961,106 people
- City population
- 309,699
- Metro
- Washington-Arlington-Alexandria, DC-VA-MD-WV
- Population (ZIP)
- 25,749
- Household income
- $83,870
- Rent vs Own
- Severe rent burden
- 1516.0
Population outlook (Montgomery County) Hauer SSP2
- Today (2025)
- 1,173,231 people
- By 2030
- 1,237,402 · +5.5%
- By 2040
- 1,365,115 · +16.4%
- By 2050
- 1,491,592 · +27.1%
- By 2075
- 1,803,893 · +53.8%
- By 2100
- 2,035,619 · +73.5%
Race, ethnicity, and origin ACS 2023
- Neighborhood character
- Highly diverse neighborhood (Simpson 0.72)
- Race & ethnicity
- White 34% Black 32% Hispanic / Latino 25% Two or more races 10% Asian 4% Native American 1%
- Hispanic origin (detail)
- Mexican 5%
- Common ancestry
- Italian 3% Serbian 2% Scotch-Irish 2%
- Foreign-born
- 36% · Canada, United Kingdom, Vietnam
- Languages at home
- 54% English-only · Spanish 23% French/Haitian/Cajun 6% Other Indo-European 2%
Political lean MEDSL · Montgomery
- 2024 margin
- Solid D (+53.3) · D 75.2% · R 21.9% · Other 2.9%
- 2008→2024 swing
- +8.7pp toward D · 2008: 44.6pp · 2024: 53.3pp
- All cycles
- 2024: D+53.3 2020: D+59.6 2016: D+55.5 2012: D+43.4 2008: D+44.6
Not yet ingested
- Civics
- —
Market trends
- HPI YoY
- ▼ -542.68%
- Current HPI
- 345.3665
- Rent YoY
- ▲ 1.91%
- Metro
- Washington-Arlington-Alexandria, DC-VA-MD-WV
- State GDP YoY
- ▲ 2.97%
- F500 in state
- 12
Industry mix (Fortune 500 HQ in MD)
| Industry | F500 HQs | Revenue |
|---|---|---|
| Aerospace / Defense | 1 | $71B |
|
||
| Utilities | 1 | $25B |
|
||
| Hotels | 1 | $24B |
|
||
| Consumer Goods | 1 | $7B |
|
||
| Real Estate | 1 | $6B |
|
||
| Chemicals | 1 | $2B |
|
||
Price history
+528.5% since first listed23 events — show timeline
- 2026-03-27 Pending — BRIGHT MLS
- 2026-03-19 Relisted — BRIGHT MLS
- 2026-03-04 Pending — BRIGHT MLS
- 2026-03-04 Listing Removed — BRIGHT MLS
- 2026-03-01 Listed $659,900 BRIGHT MLS
- 2022-04-18 Listing Removed — BRIGHT MLS
- 2022-04-15 Listing Removed — BRIGHT MLS
- 2022-04-15 Listed $610,000 BRIGHT MLS
- 2022-04-15 Listed $610,000 BRIGHT MLS
- 2002-11-20 Sold (Public Records) $286,000 Public Records
- 2002-10-30 Sold (MLS) $286,000 MRIS
- 2002-09-27 Delisted — MRIS
- 2002-09-13 Listed $280,000 MRIS
- 2001-04-12 Sold (Public Records) $236,100 Public Records
- 2001-04-03 Sold (MLS) $236,100 MRIS
- 2001-04-03 Sold (MLS) $236,100 MRIS
- 2001-01-28 Delisted — MRIS
- 2001-01-18 Delisted — MRIS
- 2000-10-30 Listed $229,000 MRIS
- 2000-10-26 Listed $229,000 MRIS
- 1997-10-22 Delisted — MRIS
- 1997-07-22 Listed — MRIS
- 1982-07-28 Sold (Public Records) $105,000 Public Records
Property tax history
+7.5%/yrLatest (2025): $8,491 · +9.1% YoY. Source: county tax records.
Cash-flow waterfall
monthlySold comps — $/sqft
last 12 mo · ≤1 miLoading sold comps…