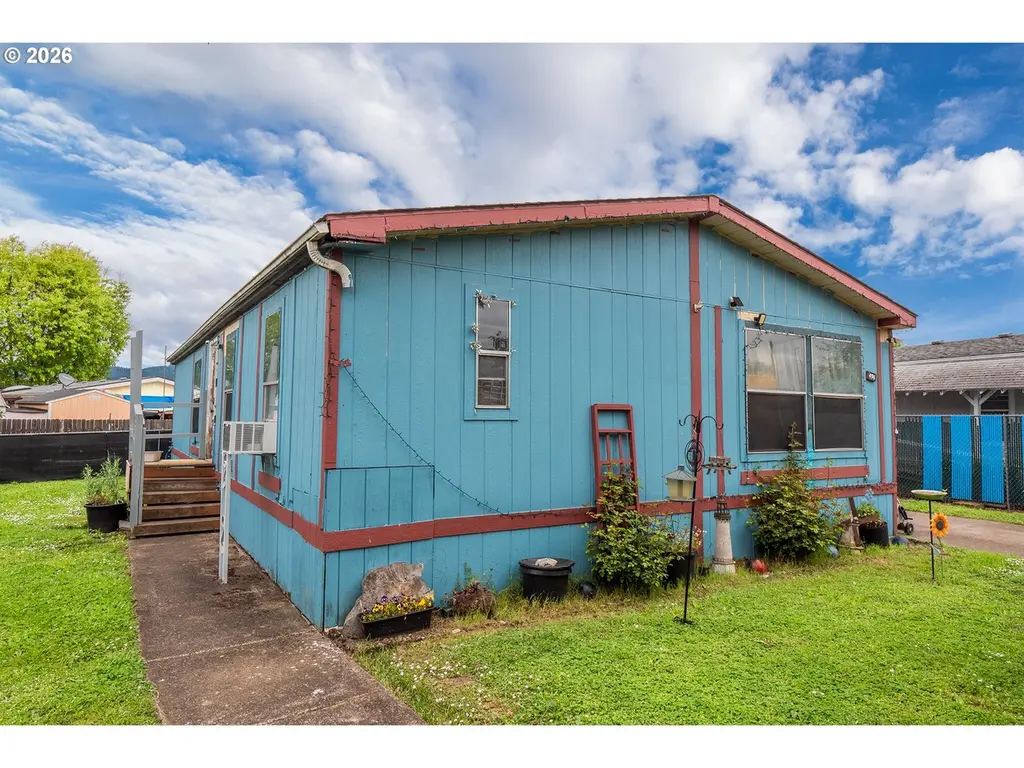
496 Scotts Glen Dr · Springfield, OR
Flood risk 4/10 · Minor
- FEMA flood zone
- X (unshaded)
- Chance of flooding over 30 yrs
- 0.22%
- Est. flood insurance / yr
- $507 – $1,088
Fire risk 3/10 · Minor
- Est. fire insurance / yr
- $498 – $926
Heat risk 4/10 · Minor
- Hot days now (above 92°F)
- 7 days/yr
- Hot days in 30 yrs
- 15 days/yr
Wind risk 1/10 · Minimal
- Chance of severe wind over 30 yrs
- —
Air-quality risk 10/10 · Severe
- Unhealthy air days now
- 15 days/yr
- Unhealthy air days in 30 yrs
- 16 days/yr
Risk factors via First Street. Map © Google.
Why this score? — see what drove the B- grade
The composite is a weighted blend of 9 inputs, each scored 0–100. Each bar is that input's sub-score; the figure is the points it added to the 100-point composite (weight × sub-score).
- Cash flow +30.0/30.0
- DSCR +10.0/10.0
- 1% rule +9.2/10.0
- ARV discount +6.8/15.0
- Livability +4.2/5.0
- Rent growth +3.7/5.0
- Condition / age +2.5/5.0
- Schools +2.4/10.0
- Appreciation +0.0/10.0
$126,500
🖨 Deal sheet (PDF) 📄 Offer letter ✓ Due diligence
Listing remarks
Looking for a home with personality? This 3-bedroom, 2-bath, 1,344 sq ft manufactured home on rented land is ready for its next chapter—and maybe a fresh coat of matching paint while you’re at it. Currently rocking a bold “two-tone exterior, ” it’s basically ahead of the design curve… or at least not afraid to stand out. Inside, you’ll find a spacious layout that’s presently showcasing a full collection of “life in progress” décor (a. k. a. lots of stuff), so bring your imagination—and maybe your ability to see through a little creative clutter. Beneath it all, there’s solid potential waiting to shine. The home
Key facts
- Garage
- Built 1990
- Listed 43 days
Property features AI
Finance
- Other: Lot size range: under 3,000 sq ft; Parcel number 4181309
- HOA & community: Located in Lochaven LLC park; Land lease in effect (monthly lot rent); Land lease monthly rent of $826; Land lease expires October 13, 2026; Not a senior community
Exterior
- Parking: Carport; Driveway (1 parking space total)
- Utilities: Electricity; Public water; Public sewer
- Home design: Manufactured home in park; Residential property; Single-story (main living on one level); Fixer condition; No view
- Construction: Built in 1990; Pillar/post/pier foundation; Manufacturer: Redman; Unit dimensions approximately 48' x 27'
- Exterior features: Wood siding; Shingle roof; Paved road access
Interior
- Kitchen: Free-standing range; Kitchen (Main level)
- Bedrooms: Primary bedroom (Main level); 2nd bedroom (Main level); 3rd bedroom (Main level)
- Bathrooms: 2 full bathrooms (both on main level)
- Heating & cooling: Forced air heating; No cooling
- Interior features: Crawl space basement; Dining room; Family room; Great room; Living room
Neighborhood map
What this means for you Summary
Snapshot
- This is a 3-bed/2.0-bath manufactured listed at $126k.
Deal economics
- At list price, monthly cash flow is $625 ($8k/yr) — positive.
- The deal already cash-flows at list — no discount required.
- Meets the 1% rule at list price ($2k rent vs $126k).
- Recommended offer: $123k (3.0% below list) — sets the bar for market timing.
- Cap rate 12.2% vs local median 3.0% in Springfield — top-decile yield for the area; either an underpriced asset or a hidden risk that comps aren't pricing in. Stress-test before assuming the spread holds.
Location & tenants
- Location reads 83/100 on livability (#40 in OR, #934 nationally) — a professional / high-income tenant draw. Strengths: amenities A+, commute A+, housing A+; Watch: crime D+, employment D+.
- Springfield SD 19 (suburban): math 19% / reading 38% proficiency, ranked #48 of 58 in OR (top 83%) — low school quality limits family demand, transient renter base, plan for 1-2y turnover.
- Zoned schools: Guy Lee Elementary School (math 15% / reading 15%, grade F, #392 of 412 statewide, top 96%, 347 students, 62% FRL); Hamlin Middle School (math 15% / reading 35%, grade F, #104 of 128 statewide, top 83%, 571 students, 64% FRL); Springfield High School (math 30% / reading 54%, grade F, #64 of 143 statewide, top 46%, 1,317 students, 65% FRL).
- Market conditions: Rents rising fast (+4.8%/yr); 163 active listings in the ZIP; 22 comparable units currently listed for rent nearby; rentals at typical pace (median 22d on market — plan ~3-4 weeks tenant-placement turnaround); 41% of comp listings sitting > 30 days — soft ceiling on asking rent; 1,808 units permitted in Lane County in 2024 (972 in 5+ unit buildings).
- This rent runs 33% of the median local income ($66k/yr) — at the standard rent-burdened threshold; future hikes will face affordability resistance.
Forward outlook
- Local home prices are declining (-3.0%/yr); year-one equity from $875 of loan paydown is wiped out by about $4k of value loss. Plan a longer hold.
- Lane County population projected at +15% by 2050 — long-run rental-demand tailwind backs the buy-and-hold thesis.
- At projected returns (-3.0% appreciation + 4.8% rent growth), your $35k cash investment doubles in ~6 years — after that, you're playing with house money.
Negotiation context
- It's been on market 43 days — a 3% lower offer ($123k) is reasonable based on typical stale-listing flexibility.
Questions for the listing agent
- It's been on market 43 days. Have you received any prior offers? Is the seller open to a 3% concession, seller financing, or rate buy-down credit?
- Is there a deadline driving the sale (1031 exchange, divorce, estate, relocation)? That informs how much negotiation room exists.
- Schools are D-rated, which usually means shorter tenancies and higher turnover. Who's the typical renter profile here, and what's been the actual vacancy rate?
- Crime grade is D in this area — have there been break-ins, vandalism, or insurance claims at this property in the last 3 years? What carrier currently insures it and at what premium?
- What's the average days-on-market for RENTAL listings here right now (not sales)? A rising rental-DOM trend means longer vacancies and softer asking-rent achievability than the comps imply.
- What's the recent tenant-quality profile in this submarket — average credit score on applications, eviction rate, late-payment / NSF rate, and stable-employment percentage? A property-management company in the area should have these aggregated.
- How much new for-sale + rental construction is in the pipeline within 1–3 miles? Heavy new supply typically softens prices + rents 12–24 months out; constrained supply supports both.
Investment metrics
- 1% rule
- 1.42% ✓
- Cap rate
- 12.22%
- Cash-on-cash
- 21.18%
- DSCR
- 1.94
- GRM
- 5.9
CMA / ARV
- ARV (median comp)
- $124,500
- List price
- $126,500
- Delta
- 1.61%
- Verdict
- FAIR
- Comps
- 10 within 1.0 mi
Show comp detail 12 sales within ~0.75 mi
| Address | Dist | Beds/Ba | Sqft | Sold | Price | $/sf | Match |
|---|---|---|---|---|---|---|---|
| 451 Lochaven Ave | 0.04mi | 3/2.0 | 1,296 (0%) | 2mo | $157,000 | $121 | 96 |
| 2150 Laura St #202 | 0.16mi | 3/2.0 | 1,296 (0%) | 0mo | $81,500 | $63 | 92 |
| 475 Lochaven Ave | 0.03mi | 3/2.0 | 1,296 (0%) | 14mo | $150,000 | $116 | 87 |
| 898 Lochaven Ave | 0.31mi | 3/2.0 | 1,296 (0%) | 2mo | $150,000 | $116 | 84 |
| 328 Scotts Glen Dr | 0.17mi | 3/2.0 | 1,323 (+2%) | 7mo | $345,000 | $261 | 82 |
| 484 Scotts Glen Dr | 0.01mi | 3/2.0 | 1,404 (+8%) | 4mo | $150,000 | $107 | 82 |
| 1120 W Fairview Dr #3 | 0.42mi | 3/2.0 | 1,232 (-5%) | 4mo | $99,000 | $80 | 69 |
| 595 Lochaven Ave | 0.08mi | 3/2.0 | 1,414 (+9%) | 16mo | $199,800 | $141 | 67 |
| 2150 Laura St #222 | 0.16mi | 3/2.0 | 1,404 (+8%) | 14mo | $68,000 | $48 | 67 |
| 2150 Laura St #213 | 0.16mi | 2/2.0 (-1) | 1,188 (-8%) | 12mo | $74,000 | $62 | 64 |
| 708 Lochaven Ave | 0.19mi | 2/2.0 (-1) | 1,188 (-8%) | 16mo | $105,000 | $88 | 59 |
| 361 Scotts Glen Dr | 0.15mi | 2/2.0 (-1) | 1,120 (-14%) | 17mo | $140,000 | $125 | 52 |
Match score weights: distance 35% · size 25% · config 20% · recency 20%. Top-matched comps best support the ARV.
Projected returns pro-forma
-3.0% appreciation · 4.81% rent growth · sell at horizon
- IRR
- 15.6%
- Equity multiple
- 1.64×
- Total profit
- $22,637
- Equity at exit
- $18,862
- IRR
- 25.5%
- Equity multiple
- 3.40×
- Total profit
- $85,119
- Equity at exit
- $10,937
Cash invested: $35,420 (down + closing). Projections, not guarantees.
Landlord ↔ Tenant lean methodology
- Overall (STATE)
- 28 Tenant-Leaning
- State Oregon
- 28 Tenant-Leaning · D+6
- County
- — inherits STATE
- City
- — inherits STATE
ZIP-level market 97477
- Rents YoY
- 4.8%
- Active inventory
- 163
- Price-to-rent
- 5.9×
Monthly cashflow live
- Estimated rent
- $1,801 high interval (Pro) →
- Mortgage (P&I)
- −$663
- Tax from tax record
- −$82 /mo · $979/yr
- Insurance
- −$53
- HOA
- −$0
- Vacancy / Maint / Mgmt
- −$378
- Net cashflow
- $625
Break-even live
Sensitivity live
| Price | -10% $697 | -5% $661 | +0% $625 | +5% $589 | +10% $554 |
|---|---|---|---|---|---|
| Rent | -10% $483 | -5% $554 | +0% $625 | +5% $696 | +10% $767 |
| Rate | -1.0pp $689 | -0.5pp $657 | base $625 | +0.5pp $592 | +1.0pp $559 |
UW: 25.0% down · 7.5% · 30yr · 1.5% tax · 5.0% vac · 8.0% maint · 8.0% mgmt
Financing live
Cash to close
- Down payment
- $31,625
- Closing costs
- $3,795
- Reserves months
- —
- Total cash needed
- —
Loan-product check · same deal, 3 products live
Conventional
25% down · 7.5% · 30yr
- Down + closing
- —
- Monthly P&I
- —
- Monthly cashflow
- —
- DSCR
- —
- Eligible?
- —
Personal DTI + credit; lowest rate.
DSCR
20% down · 8.5% · 30yr
- Down + closing
- —
- Monthly P&I
- —
- Monthly cashflow
- —
- DSCR
- —
- Eligible?
- —
No personal income docs; deal must DSCR.
Hard money
10% down · 12.0% · 12mo
- Down + closing
- —
- Monthly P&I
- —
- Monthly cashflow
- —
- DSCR
- —
- Eligible?
- —
Short-term bridge; refi at stabilization.
Rent comps 22 comps
| Address | Beds | Baths | Sqft | Rent | $/sqft | DOM | Units | Dist |
|---|---|---|---|---|---|---|---|---|
| 636 W Quinalt St Springfield, OR | 3.0 | 1.5 | 1045 | $1,595 | $1.53 | 44d | 1 | 0.25mi |
| 668 W Quinalt St Springfield, OR | 3.0 | 1.5 | 1100 | $1,695 | $1.54 | 44d | 1 | 0.26mi |
| 2220 Shadylane Dr Springfield, OR | 2.0 | 1.5 | 860 | $1,730 | $2.01 | 22d | 4 | 0.35mi |
| 956 W Olympic St Springfield, OR | 3.0 | 2.0 | 1212 | $2,200 | $1.82 | 14d | 1 | 0.46mi |
| 2609 S Cloverleaf Loop Unit 2609 Springfield, OR | 3.0 | 1.5 | 1500 | $1,975 | $1.32 | 14d | 1 | 0.49mi |
| 2555 Gateway St Springfield, OR | 2.0 | 1.0 | 682 | $1,649 | $2.42 | 22d | 14 | 0.54mi |
| 506 W Centennial Blvd Springfield, OR | 1.0–3.0 | 1.0–2.0 | 1182 | $1,699 | $1.44 | 22d | 3 | 0.57mi |
| 506 W Centennial Blvd Springfield, OR | 2.0 | 1.0 | 885 | $1,684 | $1.90 | 14d | 4 | 0.57mi |
| 243 R St Springfield, OR | 1.0–3.0 | 1.0–2.5 | 867 | $1,649 | $1.90 | 44d | 6 | 0.59mi |
| 859 W M St Springfield, OR | 4.0 | 1.0 | 1504 | $1,700 | $1.13 | 44d | 1 | 0.59mi |
| 175 G St Unit C Springfield, OR | 3.0 | 1.0 | 975 | $1,450 | $1.49 | 44d | 1 | 1.05mi |
| 700 1st St Unit 18 Springfield, OR | 2.0 | 1.0 | 900 | $1,350 | $1.50 | 14d | 1 | 1.09mi |
| 562 Kelly Blvd Springfield, OR | 4.0 | 1.0 | 1500 | $1,995 | $1.33 | 44d | 1 | 1.11mi |
| 3440 Westward Ho Ave Unit 3440 Eugene, OR | 2.0 | 1.0 | 950 | $1,995 | $2.10 | 44d | 1 | 1.21mi |
| 1217 R St #5 Springfield, OR | 2.0 | 1.0 | 900 | $1,395 | $1.55 | 22d | 1 | 1.30mi |
| 3450 McKenna Dr Eugene, OR | 1.0–2.0 | 1.0–2.0 | 1125 | $1,720 | $1.53 | 14d | 5 | 1.30mi |
| 430 Pioneer Pkwy W Unit 432 Springfield, OR | 2.0 | 1.5 | 1100 | $1,795 | $1.63 | 44d | 1 | 1.30mi |
| 375 Marche Chase Dr Eugene, OR | 1.0–2.0 | 1.0–2.0 | 896 | $1,960 | $2.19 | 14d | 8 | 1.31mi |
| 1253 R St Unit 4 Springfield, OR | 2.0 | 1.5 | 1000 | $1,295 | $1.29 | 44d | 1 | 1.32mi |
| 754 Leigh St Eugene, OR | 2.0 | 1.0 | 950 | $1,395 | $1.47 | 14d | 1 | 1.37mi |
| 3225 Kinsrow Ave Eugene, OR | 1.0–4.0 | 1.0–2.5 | 1009 | $2,467 | $2.44 | 22d | 10 | 1.42mi |
| 3120 Van Ave Eugene, OR | 2.0 | 1.5 | 1104 | $1,695 | $1.54 | 14d | 4 | 1.48mi |
Listing history 15 events
-
2026-06-18days on market $126,500 Active 43 DOM
-
2026-06-17days on market $126,500 Active 42 DOM
-
2026-06-16days on market $126,500 Active 41 DOM
-
2026-06-15days on market $126,500 Active 40 DOM
-
2026-06-14days on market $126,500 Active 38 DOM
-
2026-06-10days on market $126,500 Active 35 DOM
-
2026-06-09days on market $126,500 Active 34 DOM
-
2026-06-08days on market $126,500 Active 33 DOM
-
2026-06-07days on market $126,500 Active 32 DOM
-
2026-06-03days on market $126,500 Active 28 DOM
-
2026-06-02days on market $126,500 Active 27 DOM
-
2026-06-01days on market $126,500 Active 26 DOM
-
2026-05-31days on market $126,500 Active 25 DOM
-
2026-05-30days on market $126,500 Active 24 DOM
-
2026-05-06$135,000 Active 1148-char remark
ⓘ Source: listings_history table (triggers on properties + properties_extension) + one-shot
backfill from property_details.listing_events for pre-trigger history.
Tax reassessment forecast OR · Resets to sale price
- Current annual tax
- $979 · $82/mo
- Projected year-2 tax
- $1,227 · $102/mo
- Expected delta
- +$248/yr (+$21/mo · 25.4%)
ⓘ Screening estimate from a state-policy table — verify with the county assessor before closing.
Climate risk First Street
- Flood 4/10 Moderate FEMA zone X (unshaded) · 22% chance over 30 yrs
- Wildfire 3/10 Moderate
- Heat 4/10 Moderate 7 d/yr ≥92°F today · 15 d/yr by 30 yrs out
- Wind 1/10 Low
- Air quality 10/10 Extreme 15 unhealthy d/yr today · 16 by 30 yrs out
Nearby sold comps map
Loading sold comps map…
Walkable amenities ~0.75 mi
Loading nearby amenities…
Taxation est. · year 1
- Rental income
- $21,612
- − Mortgage interest
- −$7,086
- − Property taxes
- −$979
- − Insurance
- −$632
- − Repairs & maintenance
- −$1,729
- − Management
- −$1,729
- − Depreciation
- −$3,680
- Taxable income
- $5,777
- Est. tax owed @ 24.0%
- −$1,386
- After-tax cash flow
- $6,115/yr
For passive investors: Depreciation is non-cash, so a rental often shows a tax loss while cash-flowing — sheltering income. Rental losses are passive: they offset passive income freely, and up to $25,000/yr can offset ordinary (W-2) income if you actively participate and your MAGI is under $100k (phasing out to $0 by $150k); unused losses carry forward. On sale, claimed depreciation is recaptured at up to 25%, and gains may owe capital-gains tax (a 1031 exchange can defer both). Figures are a year-1 estimate at your 24.0% rate — not tax advice; consult a CPA.
Schools (NCES district)
- District
- Springfield SD 19
- NCES district ID
- 4111670
- Math proficiency
- 19% ▼ -13.00%
- Reading proficiency
- 38% ▼ -10.00%
- Median HH income
- $42,236
- Composite
- 24.14/100
- National rank
- #7746
- State rank
- #48 of 58 in OR
Livability — Springfield
- Score
- 83/100
- State rank
- #40
- US rank
- #934
Category grades
Schools grade is shown separately in the Schools card above.
Census & demographics
- Census place
- Springfield, OR
- County
- Lane County · 310,476 people
- City population
- 76,907
- Metro
- Eugene-Springfield, OR
- Population (ZIP)
- 37,534
- Household income
- $65,662
- Rent vs Own
- Severe rent burden
- 1817.0
Population outlook (Lane County) Hauer SSP2
- Today (2025)
- 391,933 people
- By 2030
- 405,860 · +3.6%
- By 2040
- 429,386 · +9.6%
- By 2050
- 452,016 · +15.3%
- By 2075
- 508,825 · +29.8%
- By 2100
- 531,208 · +35.5%
Race, ethnicity, and origin ACS 2023
- Neighborhood character
- Predominantly White (77%)
- Race & ethnicity
- White 77% Hispanic / Latino 13% Two or more races 10% Asian 1% Native American 1%
- Hispanic origin (detail)
- Mexican 10%
- Common ancestry
- Lithuanian 4% Portuguese 4% Italian 3%
- Foreign-born
- 6% · Canada
- Languages at home
- 89% English-only · Spanish 9% Other Asian/Pacific 1%
Political lean MEDSL · Lane
- 2024 margin
- Strong D (+23.1) · D 60.0% · R 36.9% · Other 3.1%
- 2008→2024 swing
- -4.3pp toward R · 2008: 27.4pp · 2024: 23.1pp
- All cycles
- 2024: D+23.1 2020: D+24.3 2016: D+18.9 2012: D+23.4 2008: D+27.4
Not yet ingested
- Civics
- —
Market trends
- HPI YoY
- ▼ -489.08%
- Current HPI
- 299.6863
- Rent YoY
- ▲ 4.81%
- Metro
- Eugene-Springfield, OR
- State GDP YoY
- ▲ 2.05%
- F500 in state
- 2
Industry mix (Fortune 500 HQ in OR)
| Industry | F500 HQs | Revenue |
|---|---|---|
| Consumer Goods | 1 | $51B |
|
||
Price history
-6.3% since first listed2 events — show timeline
- 2026-05-23 Price Changed $126,500 RMLS
- 2026-05-06 Listed $135,000 RMLS
Property tax history
+5.9%/yrLatest (2025): $979 · +1.6% YoY. Source: county tax records.
Cash-flow waterfall
monthlySold comps — $/sqft
last 12 mo · ≤1 miLoading sold comps…