 Duplex
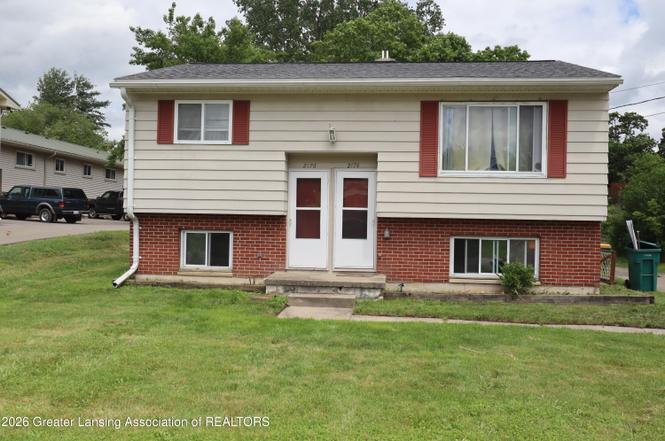
2174-2176 Meadowlawn Dr · Delhi, MI
Flood risk 1/10 · Minimal
- FEMA flood zone
- X (unshaded)
- Chance of flooding over 30 yrs
- 0.0%
- Est. flood insurance / yr
- $473 – $860
Fire risk 1/10 · Minimal
- Est. fire insurance / yr
- $784 – $1,456
Heat risk 2/10 · Minimal
- Hot days now (above 97°F)
- 7 days/yr
- Hot days in 30 yrs
- 16 days/yr
Wind risk 2/10 · Minimal
- Chance of severe wind over 30 yrs
- —
Air-quality risk 2/10 · Minimal
- Unhealthy air days now
- 1 days/yr
- Unhealthy air days in 30 yrs
- 2 days/yr
Risk factors via First Street. Map © Google.
Why this score? — see what drove the B grade
The composite is a weighted blend of 9 inputs, each scored 0–100. Each bar is that input's sub-score; the figure is the points it added to the 100-point composite (weight × sub-score).
- Cash flow +30.0/30.0
- DSCR +10.0/10.0
- ARV discount +9.6/15.0
- 1% rule +9.4/10.0
- Rent growth +4.5/5.0
- Schools +3.3/10.0
- Livability +2.5/5.0
- Condition / age +2.5/5.0
- Appreciation +0.0/10.0
$205,000
🖨 Deal sheet 📄 Offer letter ✓ Due diligence
Multi-family units
County records classify this as Multi-Family (2-4 Unit). Listing-text estimate: 2 units. confirmed
Listing remarks MLS
Get opportunity! Duplex in Holt, each unit has 2 bedrooms and a full bath. If you're an investor, or a new buyer looking to offset high prices this is a great option for you! Both units are currently rented out, but upper unit will be vacant July. New owners will have to take over the current lease agreements. All offers to be in by Sunday 6/12.
Key facts
- 0.37 acre lot
- 4 parking spots
- Built 1965
Property features AI
Finance
- Other: Lot dimensions approximately 66 x 247 (0.37 acres)
- Financial info: Two-unit property (duplex)
Exterior
- Parking: 4 total parking spaces; Asphalt parking surface; No attached garage
- Security: Smoke detector(s)
- Utilities: 100 amp electric service; Public sewer; High-speed internet available
- Home design: Bi-level property; Built in 1965; Subdivision: Meadow Lawn
- Construction: Aluminum siding; Shingle roof; No foundation details listed
- Exterior features: Back yard; Front yard; City lot; Level lot; Asphalt road frontage
Interior
- Flooring: Carpet; Linoleum
- Heating & cooling: Central air conditioning; Central heating with forced air (natural gas)
- Interior features: Electric water heater; Smoke detectors
- Laundry & utility: No in-unit laundry listed
Neighborhood map
What this means for you Summary
Snapshot
- This is a 2 × 2.0-bed/1.0-bath units multifamily listed at $205k.
Deal economics
- At list price, monthly cash flow is $849 ($10k/yr) — positive. Per door: $424/mo.
- The deal already cash-flows at list — no discount required.
- Meets the 1% rule at list price ($3k rent vs $205k).
Location & tenants
- Location reads: area grade B — affects rentability + tenant quality, not the cash-flow math above.
- Holt Public Schools (suburban): math 28% / reading 46% proficiency, ranked #236 of 540 in MI (top 44%) — families likely to look elsewhere, expect single-tenant / working-renter base with shorter leases.
- Market conditions: Rents rising fast (+8.0%/yr); 75 active listings in the ZIP; 1 comparable units currently listed for rent nearby; solid renter incomes; 350 units permitted in Ingham County in 2024 (186 in 5+ unit buildings).
- This rent runs 40% of the median local income ($88k/yr) — at the standard rent-burdened threshold; future hikes will face affordability resistance.
Forward outlook
- Local home prices are declining (-3.0%/yr); year-one equity from $1k of loan paydown is wiped out by about $6k of value loss. Plan a longer hold.
- Ingham County population projected at +11% by 2050 — modest demand growth; plan on rents tracking national, not racing it.
- At projected returns (-3.0% appreciation + 8.0% rent growth), your $57k cash investment doubles in ~6 years — after that, you're playing with house money.
Negotiation context
- Only 1 days on market — expect competitive offers; lowballing is unlikely to land.
- 7 sale attempts since 11y ago with the ask held roughly flat each time — persistent listings suggest the price (not the market) is what's stuck; bring a comps-based counter.
- Current owner paid $145k; 41% above their basis — modest negotiation headroom, anchor on the comps not their cost.
Questions for the listing agent
- Can we see the unit-by-unit rent roll, current vacancy, and any below-market leases? What's the average tenancy length?
- What capital expenditures (roof, boiler, parking lot, exteriors) have been made in the last 5 years, and what's planned in the next 2?
- Built in 1965 — when were the roof, HVAC, electrical panel, plumbing, and water heater last replaced?
- Is there a deadline driving the sale (1031 exchange, divorce, estate, relocation)? That informs how much negotiation room exists.
- What's the average days-on-market for RENTAL listings here right now (not sales)? A rising rental-DOM trend means longer vacancies and softer asking-rent achievability than the comps imply.
- What's the recent tenant-quality profile in this submarket — average credit score on applications, eviction rate, late-payment / NSF rate, and stable-employment percentage? A property-management company in the area should have these aggregated.
- How much new apartment / multifamily construction is in the pipeline within 1–3 miles? Heavy new supply (>2% of stock underway) typically softens rents 12–24 months out; light construction supports rent growth.
Investment metrics
- 1% rule
- 1.44% ✓
- Cap rate
- 11.26%
- Cash-on-cash
- 17.74%
- DSCR
- 1.79
- GRM
- 5.8
CMA / ARV
- ARV (on-the-fly)
- $215,190
- Comps found
- 1
Show comp detail 1 sale within ~0.75 mi
| Address | Dist | Beds/Ba | Sqft | Sold | Price | $/sf | Match |
|---|---|---|---|---|---|---|---|
| 2166-2168 Park Ln | 0.08mi | 4/2.0 | 1,404 (-12%) | 9mo | $190,000 | $135 | 65 |
Match score weights: distance 35% · size 25% · config 20% · recency 20%. Top-matched comps best support the ARV.
Projected returns pro-forma
-3.0% appreciation · 8.0% rent growth · sell at horizon
- IRR
- 14.9%
- Equity multiple
- 1.64×
- Total profit
- $36,530
- Equity at exit
- $30,566
- IRR
- 27.2%
- Equity multiple
- 4.01×
- Total profit
- $172,795
- Equity at exit
- $17,725
Cash invested: $57,400 (down + closing). Projections, not guarantees.
Landlord ↔ Tenant lean methodology
- Overall (STATE)
- 62 Landlord-Friendly
- State Michigan
- 62 Landlord-Friendly · EVEN
- County
- — inherits STATE
- City
- — inherits STATE
ZIP-level market 48842
- Rents YoY
- 8.0%
- Active inventory
- 75
- Price-to-rent
- 11.6×
Monthly cashflow live
- Estimated rent
- $2,953 high interval (Pro) →
- Mortgage (P&I)
- −$1,075
- Tax from tax record
- −$324 /mo · $3,884/yr
- Insurance
- −$85
- HOA
- −$0
- Vacancy / Maint / Mgmt
- −$620
- Net cashflow
- $849
Break-even live
2-unit breakdown (identical units grouped — click to expand)
| Units | Beds | Baths | Est. rent |
|---|---|---|---|
| 2× units | 2.0 | 1 | $2,952 |
| #1 | 2.0 | 1 | $1,476 |
| #2 | 2.0 | 1 | $1,476 |
| Total (2 units) | $2,953 | ||
UW: 25.0% down · 7.5% · 30yr · 1.5% tax · 5.0% vac · 8.0% maint · 8.0% mgmt
Financing live
Cash to close
- Down payment
- $51,250
- Closing costs
- $6,150
- Reserves months
- —
- Total cash needed
- —
Loan-product check · same deal, 3 products live
Conventional
25% down · 7.5% · 30yr
- Down + closing
- —
- Monthly P&I
- —
- Monthly cashflow
- —
- DSCR
- —
- Eligible?
- —
Personal DTI + credit; lowest rate.
DSCR
20% down · 8.5% · 30yr
- Down + closing
- —
- Monthly P&I
- —
- Monthly cashflow
- —
- DSCR
- —
- Eligible?
- —
No personal income docs; deal must DSCR.
Hard money
10% down · 12.0% · 12mo
- Down + closing
- —
- Monthly P&I
- —
- Monthly cashflow
- —
- DSCR
- —
- Eligible?
- —
Short-term bridge; refi at stabilization.
Rent comps 1 comps
| Address | Beds | Baths | Sqft | Rent | $/sqft | DOM | Units | Dist |
|---|---|---|---|---|---|---|---|---|
| 4075 Holt Rd Holt, MI | 1.0–3.0 | 1.0–2.0 | 1000 | $1,239 | $1.24 | 13d | 1 | 0.70mi |
Listing history 1 events
-
2026-06-19$205,000 Active 1 DOM
ⓘ Source: listings_history table (triggers on properties + properties_extension) + one-shot
backfill from property_details.listing_events for pre-trigger history.
Tax reassessment forecast MI · Partial reset (capped growth)
- Current annual tax
- $3,884 · $324/mo
- Projected year-2 tax
- $3,884 · $324/mo
- Expected delta
- $0/yr ($0/mo · 0.0%)
ⓘ Screening estimate from a state-policy table — verify with the county assessor before closing.
Climate risk First Street
- Flood 1/10 Low FEMA zone X (unshaded) · 0% chance over 30 yrs
- Wildfire 1/10 Low
- Heat 2/10 Low 7 d/yr ≥97°F today · 16 d/yr by 30 yrs out
- Wind 2/10 Low
- Air quality 2/10 Low 1 unhealthy d/yr today · 2 by 30 yrs out
Nearby sold comps map
Loading sold comps map…
Walkable amenities ~0.75 mi
Loading nearby amenities…
Taxation est. · year 1
- Rental income
- $35,436
- − Mortgage interest
- −$11,483
- − Property taxes
- −$3,884
- − Insurance
- −$1,025
- − Repairs & maintenance
- −$2,835
- − Management
- −$2,835
- − Depreciation
- −$5,964
- Taxable income
- $7,410
- Est. tax owed @ 24.0%
- −$1,779
- After-tax cash flow
- $8,406/yr
For passive investors: Depreciation is non-cash, so a rental often shows a tax loss while cash-flowing — sheltering income. Rental losses are passive: they offset passive income freely, and up to $25,000/yr can offset ordinary (W-2) income if you actively participate and your MAGI is under $100k (phasing out to $0 by $150k); unused losses carry forward. On sale, claimed depreciation is recaptured at up to 25%, and gains may owe capital-gains tax (a 1031 exchange can defer both). Figures are a year-1 estimate at your 24.0% rate — not tax advice; consult a CPA.
Schools (NCES district)
- District
- Holt Public Schools
- NCES district ID
- 2618480
- Math proficiency
- 28% ▼ -10.00%
- Reading proficiency
- 46% ▼ -5.00%
- Median HH income
- $57,705
- Composite
- 32.68/100
- National rank
- #5653
- State rank
- #236 of 540 in MI
Livability — Delhi
No livability data for this city. (Only ~50 U.S. cities are tracked.)
Census & demographics
- Census place
- Holt, MI
- County
- Ingham County · 237,052 people
- Metro
- Lansing-East Lansing, MI
- Population (ZIP)
- 21,945
- Household income
- $88,340
- Rent vs Own
- Severe rent burden
- 545.0
Population outlook (Ingham County) Hauer SSP2
- Today (2025)
- 300,362 people
- By 2030
- 307,808 · +2.5%
- By 2040
- 320,492 · +6.7%
- By 2050
- 333,223 · +10.9%
- By 2075
- 373,693 · +24.4%
- By 2100
- 392,021 · +30.5%
Race, ethnicity, and origin ACS 2023
- Neighborhood character
- Predominantly White (76%)
- Race & ethnicity
- White 76% Two or more races 9% Hispanic / Latino 7% Black 6% Asian 5%
- Hispanic origin (detail)
- Mexican 6% Cuban 1%
- Common ancestry
- Romanian 7% Lithuanian 3% Iranian 2%
- Foreign-born
- 6% · Vietnam, Canada, China
- Languages at home
- 94% English-only · Other Indo-European 2% Vietnamese 1% Spanish 1%
Political lean MEDSL · Ingham
- 2024 margin
- Strong D (+29.7) · D 63.9% · R 34.2% · Other 2.0%
- 2008→2024 swing
- -3.6pp toward R · 2008: 33.3pp · 2024: 29.7pp
- All cycles
- 2024: D+29.7 2020: D+32.2 2016: D+27.6 2012: D+27.9 2008: D+33.3
Not yet ingested
- Civics
- —
Market trends
- HPI YoY
- ▼ -184.41%
- Current HPI
- 208.5101
- Rent YoY
- ▲ 8.03%
- Metro
- Lansing-East Lansing, MI
- State GDP YoY
- ▲ 1.37%
- F500 in state
- 28
Industry mix (Fortune 500 HQ in MI)
| Industry | F500 HQs | Revenue |
|---|---|---|
| Automotive Parts | 3 | $48B |
|
||
| Automotive | 2 | $372B |
|
||
| Chemicals | 1 | $45B |
|
||
| Automotive Retail | 1 | $29B |
|
||
| Healthcare / Medical Devices | 1 | $23B |
|
||
| Automotive Technology | 1 | $20B |
|
||
Price history
+128.0% since first listed17 events — show timeline
- 2026-06-18 Listed $205,000 Greater Lansing AoR
- 2022-08-23 Sold (Public Records) $145,000 Public Records
- 2022-08-19 Sold (MLS) $145,000 Greater Lansing AoR
- 2022-08-19 Sold (MLS) $145,000 REALCOMP
- 2022-06-13 Pending — Greater Lansing AoR
- 2022-06-09 Listed $135,000 Greater Lansing AoR
- 2022-06-09 Listed $135,000 REALCOMP
- 2016-07-19 Sold (Public Records) $77,900 Public Records
- 2015-09-26 Listing Removed — REALCOMP
- 2015-09-26 Listing Removed — REALCOMP
- 2015-09-25 Listing Removed — Greater Lansing AoR
- 2015-09-25 Listing Removed — Greater Lansing AoR
- 2015-06-25 Listed $97,500 Greater Lansing AoR
- 2015-06-25 Listed $97,500 REALCOMP
- 2015-06-24 Listed $97,500 Greater Lansing AoR
- 2015-06-24 Listed $97,500 REALCOMP
- 2002-07-11 Sold (Public Records) $89,900 Public Records
Property tax history
+3.3%/yrLatest (2025): $3,884 · +3.3% YoY. Source: county tax records.
Cash-flow waterfall
monthlySold comps — $/sqft
last 12 mo · ≤1 miLoading sold comps…