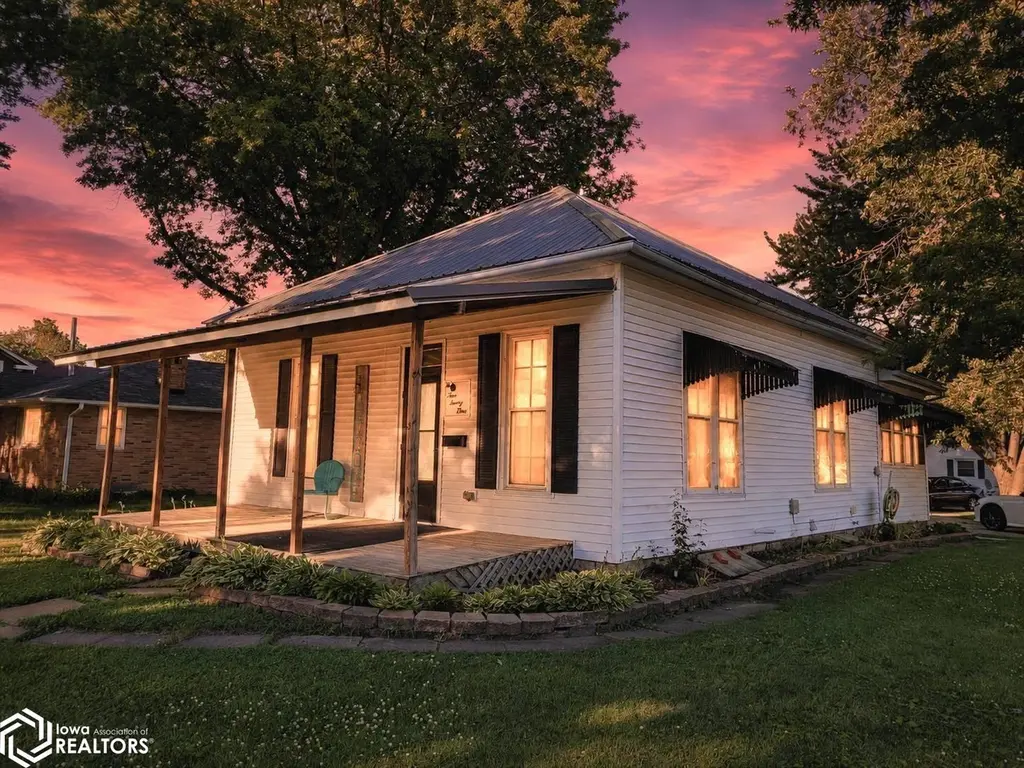
421 S Jefferson St · Sigourney, IA
Flood risk 1/10 · Minimal
- FEMA flood zone
- X (unshaded)
- Chance of flooding over 30 yrs
- 0.0%
- Est. flood insurance / yr
- $473 – $860
Fire risk 4/10 · Minor
- Est. fire insurance / yr
- $902 – $1,676
Heat risk 3/10 · Minor
- Hot days now (above 105°F)
- 7 days/yr
- Hot days in 30 yrs
- 15 days/yr
Wind risk 2/10 · Minimal
- Chance of severe wind over 30 yrs
- —
Air-quality risk 2/10 · Minimal
- Unhealthy air days now
- 1 days/yr
- Unhealthy air days in 30 yrs
- 1 days/yr
Risk factors via First Street. Map © Google.
Why this score? — see what drove the C grade
The composite is a weighted blend of 9 inputs, each scored 0–100. Each bar is that input's sub-score; the figure is the points it added to the 100-point composite (weight × sub-score).
- Cash flow +16.0/30.0
- Appreciation +10.0/10.0
- ARV discount +7.9/15.0
- Schools +6.1/10.0
- DSCR +4.9/10.0
- 1% rule +4.0/10.0
- Livability +4.0/5.0
- Rent growth +2.5/5.0
- Condition / age +2.5/5.0
$94,900
🖨 Deal sheet 📄 Offer letter ✓ Due diligence
Listing remarks
Welcome home to this charming 2 bedroom, 1 bath cottage that offers comfort and an abundance of natural light, with an open floor plan & functional layout, featuring beautiful hardwood floors and trim. Conveniently located close to the elementary school and to the downtown square. Also features a spacious bathroom offering plenty of storage with two closets and a large cabinet that can house a stackable washer and dryer with hook-ups readily available. Updates include a new metal roof in 2024 and a new front porch in 2022. Updated electrical 2010. Sale includes refrigerator, stove, washer, & dryer. The kitchen pantry cabinet is negotiable. Monthly average gas & electric $17
Key facts
- Open floor plan
- New metal roof
- Large cabinet
Tags
Property features AI
Exterior
- Parking: Detached gravel garage with 2 car spaces
- Utilities: Public water; Public sewer
- Home design: Single-family residence; Residential property
- Construction: Vinyl siding
- Exterior features: Public water; Public sewer; Lot approximately 0.2 acres (66 x 132)
Interior
- Bathrooms: 1 full bathroom
- Heating & cooling: Central air conditioning; Forced air heating
- Interior features: Basement present
Neighborhood map
What this means for you Summary
Snapshot
- This is a 2-bed/1.0-bath single-family listed at $95k.
Deal economics
- At list price, monthly cash flow is $46 ($556/yr) — positive.
- The deal already cash-flows at list — no discount required.
- To meet the 1% rule (rent ≥ 1% of price), the offer needs to be $85k (9.9% below list).
- Recommended offer: $85k (9.9% below list) — sets the bar for 1% rule.
Location & tenants
- Location reads 79/100 on livability (#108 in IA, #2,086 nationally) — a middle-class / working-renter tenant base. Strengths: crime A+, cost of living A+, housing A+; Watch: amenities F, commute F.
- Sigourney Community School District (rural): math 76% / reading 68% proficiency, ranked #122 of 289 in IA (top 42%) — strong family-tenant draw, lease renewals of 3-5y typical.
- Market conditions: 25 active listings in the ZIP; 1 units permitted in Keokuk County in 2024 (0 in 5+ unit buildings).
Forward outlook
- In year one you build about $10k of equity ($656 loan paydown + $9k appreciation (10.0% local appreciation)).
- Keokuk County population projected at -24% by 2050 — secular population decline; favor cash flow + early exit over multi-decade hold.
- At projected returns (10.0% appreciation + 3.0% rent growth), your $27k cash investment doubles in ~3 years — after that, you're playing with house money.
- By year 4, paydown + projected appreciation supports a ~$36k cash-out refi (75% LTV) — recoverable capital for the next deal without selling this one.
Negotiation context
- Only 5 days on market — expect competitive offers; lowballing is unlikely to land.
- Current owner paid $25k; list at $95k implies a 280% gain — meaningful room to come down on a strong offer.
Risks & watch-outs
- Watch-outs: built in 1900 — expect roof / HVAC / electrical / plumbing capex.
Questions for the listing agent
- Built in 1900 — when were the roof, HVAC, electrical panel, plumbing, and water heater last replaced?
- Is there a deadline driving the sale (1031 exchange, divorce, estate, relocation)? That informs how much negotiation room exists.
- Schools are A-rated — typically a magnet for longer-tenancy family renters. What's the average tenant stay here, and is there a school-zone premium baked into asking?
- What's the average days-on-market for RENTAL listings here right now (not sales)? A rising rental-DOM trend means longer vacancies and softer asking-rent achievability than the comps imply.
- What's the recent tenant-quality profile in this submarket — average credit score on applications, eviction rate, late-payment / NSF rate, and stable-employment percentage? A property-management company in the area should have these aggregated.
- How much new for-sale + rental construction is in the pipeline within 1–3 miles? Heavy new supply typically softens prices + rents 12–24 months out; constrained supply supports both.
Investment metrics
- 1% rule
- 0.90% ✗
- Cap rate
- 6.88%
- Cash-on-cash
- 2.09%
- DSCR
- 1.09
- GRM
- 9.3
CMA / ARV
- ARV (on-the-fly)
- $95,658
- Comps found
- 6
Show comp detail 6 sales within ~0.75 mi
| Address | Dist | Beds/Ba | Sqft | Sold | Price | $/sf | Match |
|---|---|---|---|---|---|---|---|
| 220 W Washington St | 0.32mi | 3/1.0 (+1) | 913 (+2%) | 1mo | $97,500 | $107 | 75 |
| 306 S Main St | 0.13mi | 2/1.0 | 1,012 (+13%) | 1mo | $75,000 | $74 | 71 |
| 908 S Main St | 0.30mi | 2/1.0 | 960 (+7%) | 8mo | $125,000 | $130 | 67 |
| 514 S Stuart St | 0.16mi | 2/1.0 | 768 (-14%) | 13mo | $35,000 | $46 | 58 |
| 208 E Jackson St | 0.47mi | 2/1.0 | 912 (+2%) | 22mo | $30,000 | $33 | 56 |
| 612 S Stone St | 0.25mi | 2/1.0 | 1,008 (+13%) | 13mo | $153,500 | $152 | 56 |
Match score weights: distance 35% · size 25% · config 20% · recency 20%. Top-matched comps best support the ARV.
Projected returns pro-forma
10.0% appreciation · 3.0% rent growth · sell at horizon
- IRR
- 25.8%
- Equity multiple
- 3.06×
- Total profit
- $54,634
- Equity at exit
- $85,493
- IRR
- 22.7%
- Equity multiple
- 6.97×
- Total profit
- $158,558
- Equity at exit
- $184,370
Cash invested: $26,572 (down + closing). Projections, not guarantees.
Landlord ↔ Tenant lean methodology
- Overall (STATE)
- 83 Strongly Landlord-Friendly
- State Iowa
- 83 Strongly Landlord-Friendly · R+6
- County
- — inherits STATE
- City
- — inherits STATE
ZIP-level market 52591
- Home prices YoY
- 22.5%
- Active inventory
- 25
- Price-to-rent
- 9.3×
Monthly cashflow live
- Estimated rent
- $855 medium interval (Pro) →
- Mortgage (P&I)
- −$498
- Tax from tax record
- −$92 /mo · $1,100/yr
- Insurance
- −$40
- HOA
- −$0
- Vacancy / Maint / Mgmt
- −$179
- Net cashflow
- $46
Break-even live
UW: 25.0% down · 7.5% · 30yr · 1.5% tax · 5.0% vac · 8.0% maint · 8.0% mgmt
Financing live
Cash to close
- Down payment
- $23,725
- Closing costs
- $2,847
- Reserves months
- —
- Total cash needed
- —
Loan-product check · same deal, 3 products live
Conventional
25% down · 7.5% · 30yr
- Down + closing
- —
- Monthly P&I
- —
- Monthly cashflow
- —
- DSCR
- —
- Eligible?
- —
Personal DTI + credit; lowest rate.
DSCR
20% down · 8.5% · 30yr
- Down + closing
- —
- Monthly P&I
- —
- Monthly cashflow
- —
- DSCR
- —
- Eligible?
- —
No personal income docs; deal must DSCR.
Hard money
10% down · 12.0% · 12mo
- Down + closing
- —
- Monthly P&I
- —
- Monthly cashflow
- —
- DSCR
- —
- Eligible?
- —
Short-term bridge; refi at stabilization.
Listing history 6 events
-
2026-06-18days on market $94,900 Active 5 DOM
-
2026-06-17days on market $94,900 Active 4 DOM
-
2026-06-16days on market $94,900 Active 3 DOM
-
2026-06-15days on market $94,900 Active 2 DOM
-
2026-06-13remarks 687-char remark
-
2026-06-13$94,900 Active 1 DOM
ⓘ Source: listings_history table (triggers on properties + properties_extension) + one-shot
backfill from property_details.listing_events for pre-trigger history.
Tax reassessment forecast IA · Partial reset (capped growth)
- Current annual tax
- $1,100 · $92/mo
- Projected year-2 tax
- $1,295 · $108/mo
- Expected delta
- +$195/yr (+$16/mo · 17.7%)
ⓘ Screening estimate from a state-policy table — verify with the county assessor before closing.
Climate risk First Street
- Flood 1/10 Low FEMA zone X (unshaded) · 0% chance over 30 yrs
- Wildfire 4/10 Moderate
- Heat 3/10 Moderate 7 d/yr ≥105°F today · 15 d/yr by 30 yrs out
- Wind 2/10 Low
- Air quality 2/10 Low 1 unhealthy d/yr today · 1 by 30 yrs out
Nearby sold comps map
Loading sold comps map…
Walkable amenities ~0.75 mi
Loading nearby amenities…
Taxation est. · year 1
- Rental income
- $10,257
- − Mortgage interest
- −$5,316
- − Property taxes
- −$1,100
- − Insurance
- −$474
- − Repairs & maintenance
- −$821
- − Management
- −$821
- − Depreciation
- −$2,761
- Taxable loss
- −$1,036
- Est. tax savings @ 24.0%
- +$249
- After-tax cash flow
- $805/yr
For passive investors: Depreciation is non-cash, so a rental often shows a tax loss while cash-flowing — sheltering income. Rental losses are passive: they offset passive income freely, and up to $25,000/yr can offset ordinary (W-2) income if you actively participate and your MAGI is under $100k (phasing out to $0 by $150k); unused losses carry forward. On sale, claimed depreciation is recaptured at up to 25%, and gains may owe capital-gains tax (a 1031 exchange can defer both). Figures are a year-1 estimate at your 24.0% rate — not tax advice; consult a CPA.
Schools (NCES district)
- District
- Sigourney Community School District
- NCES district ID
- 1926280
- Math proficiency
- 76% ▼ -7.00%
- Reading proficiency
- 68% ▼ -9.00%
- Median HH income
- $44,250
- Composite
- 60.52/100
- National rank
- #840
- State rank
- #122 of 289 in IA
Livability — Sigourney
- Score
- 79/100
- State rank
- #108
- US rank
- #2086
Category grades
Schools grade is shown separately in the Schools card above.
Census & demographics
- Census place
- Sigourney, IA
- Population (ZIP)
- 2,646
Population outlook (Keokuk County) Hauer SSP2
- Today (2025)
- 9,354 people
- By 2030
- 8,885 · -5.0%
- By 2040
- 7,956 · -14.9%
- By 2050
- 7,123 · -23.9%
- By 2075
- 5,777 · -38.2%
- By 2100
- 4,808 · -48.6%
Race, ethnicity, and origin ACS 2023
- Neighborhood character
- Predominantly White (98%)
- Race & ethnicity
- White 98% Two or more races 1%
- Common ancestry
- Italian 3% English 2% Iranian 1%
- Foreign-born
- 1% · Canada
- Languages at home
- 96% English-only · German/W. Germanic 4%
Political lean MEDSL · Keokuk
- 2024 margin
- Solid R (+51.5) · D 23.7% · R 75.2% · Other 1.1%
- 2008→2024 swing
- -47.9pp toward R · 2008: -3.6pp · 2024: -51.5pp
- All cycles
- 2024: R+51.5 2020: R+44.9 2016: R+43.6 2012: R+10.4 2008: R+3.6
Not yet ingested
- Civics
- —
Market trends
- HPI YoY
- ▲ 47.08%
- Current HPI
- 256.0682
- Rent YoY
- —
- Metro
- —
- State GDP YoY
- ▲ 2.48%
- F500 in state
- 4
Industry mix (Fortune 500 HQ in IA)
| Industry | F500 HQs | Revenue |
|---|---|---|
| Financial Services | 1 | $16B |
|
||
| Retail / Convenience | 1 | $15B |
|
||
Price history
+279.6% since first listed2 events — show timeline
- 2026-06-12 Listed $94,900 IAR
- 2010-09-29 Sold (Public Records) $25,000 Public Records
Property tax history
+0.3%/yrLatest (2025): $1,100 · +0.5% YoY. Source: county tax records.
Cash-flow waterfall
monthlySold comps — $/sqft
last 12 mo · ≤1 miLoading sold comps…