25545 Lakeshore Dr · Splendora, TX
Flood risk 1/10 · Minimal
- FEMA flood zone
- X (unshaded)
- Chance of flooding over 30 yrs
- 0.0%
- Est. flood insurance / yr
- $507 – $1,088
Fire risk 5/10 · Moderate
- Est. fire insurance / yr
- $1,222 – $2,270
Heat risk 9/10 · Severe
- Hot days now (above 110°F)
- 7 days/yr
- Hot days in 30 yrs
- 24 days/yr
Wind risk 8/10 · Major
- Chance of severe wind over 30 yrs
- 99.0%
Air-quality risk 2/10 · Minimal
- Unhealthy air days now
- 2 days/yr
- Unhealthy air days in 30 yrs
- 2 days/yr
Risk factors via First Street. Map © Google.
Why this score? — see what drove the C grade
The composite is a weighted blend of 9 inputs, each scored 0–100. Each bar is that input's sub-score; the figure is the points it added to the 100-point composite (weight × sub-score).
- Cash flow +19.1/30.0
- ARV discount +15.0/15.0
- DSCR +6.0/10.0
- 1% rule +5.2/10.0
- Livability +3.1/5.0
- Rent growth +2.5/5.0
- Schools +2.5/10.0
- Condition / age +2.5/5.0
- Appreciation +1.8/10.0
$179,000
🖨 Deal sheet 📄 Offer letter ✓ Due diligence
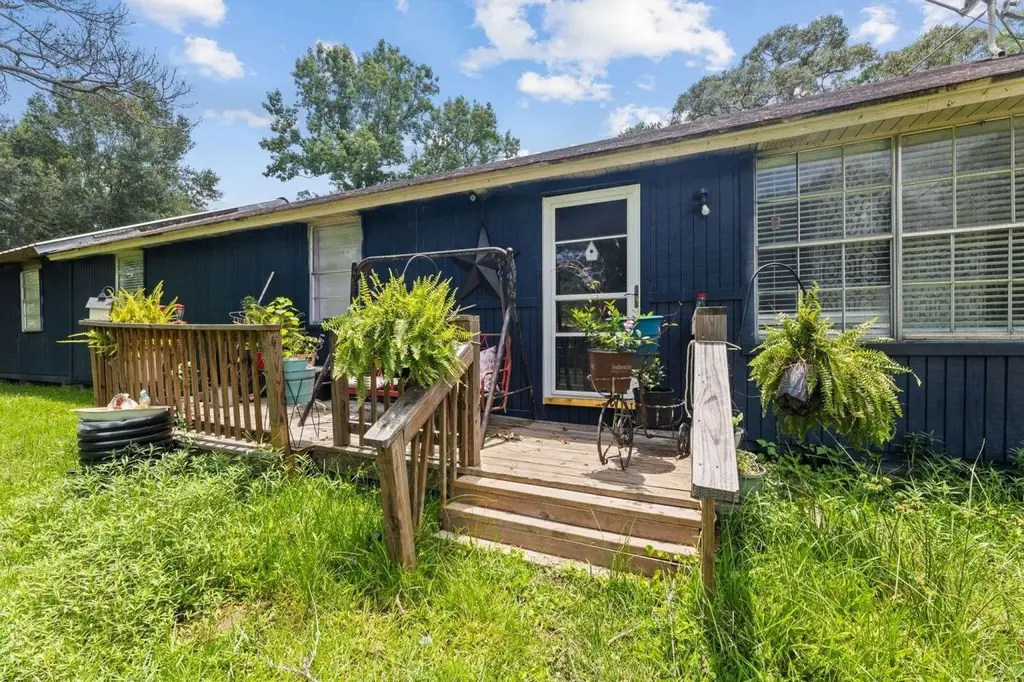
Listing remarks
Charming and move-in ready, this 3-bedroom, 1-bathroom home offers 1,440 square feet of comfortable living space on a spacious 1.09-acre lot. The property has been thoughtfully updated with a renovated kitchen and bathroom, fresh paint, and new flooring throughout. Enjoy the convenience of an attached garage and a carport, providing ample parking and storage. Clean and well-maintained, this home is a perfect blend of modern updates and peaceful country living.
Key facts
- Renovated bathroom
- Modern updates
- Ample parking
Tags
Property features AI
Exterior
- Parking: Attached garage (1 space)
- Utilities: Public sewer and septic tank available
- Home design: Residential property; Built in 1974
- Construction: Cement siding and wood siding construction; Block foundation; Composition roof
- Exterior features: Wooded lot; Other lot features
Interior
- Bedrooms: Three bedrooms on the first floor (including primary bedroom)
- Bathrooms: 1 full bathroom
- Heating & cooling: Central heating (gas); Central electric air conditioning
- Interior features: 3 total rooms
Neighborhood map
What this means for you Summary
Snapshot
- This is a 3-bed/1.0-bath single-family listed at $179k.
Deal economics
- At list price, monthly cash flow is $190 ($2k/yr) — positive.
- The deal already cash-flows at list — no discount required.
- Meets the 1% rule at list price ($2k rent vs $179k).
- Recommended offer: $176k (1.5% below list) — sets the bar for market timing.
- Cap rate 7.6% vs local median 5.2% in Splendora — top-decile yield for the area; either an underpriced asset or a hidden risk that comps aren't pricing in. Stress-test before assuming the spread holds.
Location & tenants
- Location reads 62/100 on livability (#911 in TX) — a middle-class / working-renter tenant base. Strengths: cost of living A+, housing A+; Watch: amenities F, commute F, health & safety F.
- Splendora ISD (rural): math 25% / reading 31% proficiency, ranked #648 of 826 in TX (top 78%) — low school quality limits family demand, transient renter base, plan for 1-2y turnover.
- Zoned schools: Piney Woods El (math 23% / reading 28%, grade F, #2,982 of 4,322 statewide, top 70%, 534 students, 55% FRL); Splendora J H (math 28% / reading 42%, grade F, #842 of 1,662 statewide, top 51%, 774 students, 62% FRL); Splendora H S (math 18% / reading 38%, grade F, #1,170 of 1,632 statewide, top 72%, 1,344 students, 59% FRL) — zoned schools at 59% FRL track the district average.
- Market conditions: 542 active listings in the ZIP; solid renter incomes; 13,259 units permitted in Montgomery County in 2024 (1,402 in 5+ unit buildings).
Forward outlook
- Local home prices are declining (-3.0%/yr); year-one equity from $1k of loan paydown is wiped out by about $5k of value loss. Plan a longer hold.
- Montgomery County population projected at +65% by 2050 — long-run rental-demand tailwind backs the buy-and-hold thesis.
Negotiation context
- It's been on market 22 days — a 2% lower offer ($176k) is reasonable based on typical stale-listing flexibility.
- 3 sale attempts; this cycle's ask has dropped $21k (10%) from the opening price — seller is motivated, your offer sets the floor, not the list.
Risks & watch-outs
- Climate carrying-cost: severe wind risk, 99% chance of damaging wind over 30y; moderate wildfire risk; extreme-heat days projected 7→24/yr by 2055 (HVAC capex compounding) — expect insurance premiums to compound above CPI over the hold.
Questions for the listing agent
- Built in 1974 — when were the roof, HVAC, electrical panel, plumbing, and water heater last replaced?
- Is there a deadline driving the sale (1031 exchange, divorce, estate, relocation)? That informs how much negotiation room exists.
- Schools are F-rated, which usually means shorter tenancies and higher turnover. Who's the typical renter profile here, and what's been the actual vacancy rate?
- What's the average days-on-market for RENTAL listings here right now (not sales)? A rising rental-DOM trend means longer vacancies and softer asking-rent achievability than the comps imply.
- What's the recent tenant-quality profile in this submarket — average credit score on applications, eviction rate, late-payment / NSF rate, and stable-employment percentage? A property-management company in the area should have these aggregated.
- How much new for-sale + rental construction is in the pipeline within 1–3 miles? Heavy new supply typically softens prices + rents 12–24 months out; constrained supply supports both.
Investment metrics
- 1% rule
- 1.02% ✓
- Cap rate
- 7.56%
- Cash-on-cash
- 4.54%
- DSCR
- 1.20
- GRM
- 8.2
CMA / ARV
- ARV (on-the-fly)
- $216,000
- Comps found
- 1
Show comp detail 1 sale within ~0.75 mi
| Address | Dist | Beds/Ba | Sqft | Sold | Price | $/sf | Match |
|---|---|---|---|---|---|---|---|
| 25521 Lakeshore Dr | 0.02mi | 3/2.0 | 1,296 (-10%) | 9mo | $195,000 | $150 | 71 |
Match score weights: distance 35% · size 25% · config 20% · recency 20%. Top-matched comps best support the ARV.
Projected returns pro-forma
-3.0% appreciation · 3.0% rent growth · sell at horizon
- IRR
- -9.2%
- Equity multiple
- 0.66×
- Total profit
- $-16,884
- Equity at exit
- $26,689
- IRR
- 0.3%
- Equity multiple
- 1.02×
- Total profit
- $1,008
- Equity at exit
- $15,477
Cash invested: $50,120 (down + closing). Projections, not guarantees.
Landlord ↔ Tenant lean methodology
- Overall (STATE)
- 87 Strongly Landlord-Friendly
- State Texas
- 87 Strongly Landlord-Friendly · R+5
- County
- — inherits STATE
- City
- — inherits STATE
ZIP-level market 77372
- Home prices YoY
- -2.1%
- Active inventory
- 542
- Price-to-rent
- 8.2×
Monthly cashflow live
- Estimated rent
- $1,826 medium interval (Pro) →
- Mortgage (P&I)
- −$939
- Tax from tax record
- −$239 /mo · $2,870/yr
- Insurance
- −$75
- HOA
- −$0
- Vacancy / Maint / Mgmt
- −$383
- Net cashflow
- $190
Break-even live
UW: 25.0% down · 7.5% · 30yr · 1.5% tax · 5.0% vac · 8.0% maint · 8.0% mgmt
Financing live
Cash to close
- Down payment
- $44,750
- Closing costs
- $5,370
- Reserves months
- —
- Total cash needed
- —
Loan-product check · same deal, 3 products live
Conventional
25% down · 7.5% · 30yr
- Down + closing
- —
- Monthly P&I
- —
- Monthly cashflow
- —
- DSCR
- —
- Eligible?
- —
Personal DTI + credit; lowest rate.
DSCR
20% down · 8.5% · 30yr
- Down + closing
- —
- Monthly P&I
- —
- Monthly cashflow
- —
- DSCR
- —
- Eligible?
- —
No personal income docs; deal must DSCR.
Hard money
10% down · 12.0% · 12mo
- Down + closing
- —
- Monthly P&I
- —
- Monthly cashflow
- —
- DSCR
- —
- Eligible?
- —
Short-term bridge; refi at stabilization.
Listing history 20 events
-
2026-06-18days on market $179,000 Active 22 DOM
-
2026-06-17days on market $179,000 Active 21 DOM
-
2026-06-16days on market $179,000 Active 20 DOM
-
2026-06-15days on market $179,000 Active 19 DOM
-
2026-06-13days on market $179,000 Active 17 DOM
-
2026-06-13days on market $179,000 Active 16 DOM
-
2026-06-09days on market $179,000 Active 13 DOM
-
2026-06-08days on market $179,000 Active 12 DOM
-
2026-06-07days on market $179,000 Active 11 DOM
-
2026-06-04pricedays on market $179,000 Active 8 DOM
-
2026-06-03days on market $199,900 Active 7 DOM
-
2026-06-02days on market $199,900 Active 6 DOM
-
2026-06-01days on market $199,900 Active 5 DOM
-
2026-05-31days on market $199,900 Active 4 DOM
-
2026-05-27$199,900 Active
-
2025-09-11historical
-
2025-06-24$230,000 Active
-
2025-06-16historical
-
2025-06-11price $280,000
-
2025-05-08$310,000 Active
ⓘ Source: listings_history table (triggers on properties + properties_extension) + one-shot
backfill from property_details.listing_events for pre-trigger history.
Tax reassessment forecast TX · Resets to sale price
- Current annual tax
- $2,870 · $239/mo
- Projected year-2 tax
- $3,276 · $273/mo
- Expected delta
- +$406/yr (+$34/mo · 14.1%)
ⓘ Screening estimate from a state-policy table — verify with the county assessor before closing.
Climate risk First Street
- Flood 1/10 Low FEMA zone X (unshaded) · 0% chance over 30 yrs
- Wildfire 5/10 Major
- Heat 9/10 Extreme 7 d/yr ≥110°F today · 24 d/yr by 30 yrs out
- Wind 8/10 Severe 99% chance of damaging wind over 30 yrs
- Air quality 2/10 Low 2 unhealthy d/yr today · 2 by 30 yrs out
Nearby sold comps map
Loading sold comps map…
Walkable amenities ~0.75 mi
Loading nearby amenities…
Taxation est. · year 1
- Rental income
- $21,906
- − Mortgage interest
- −$10,027
- − Property taxes
- −$2,870
- − Insurance
- −$895
- − Repairs & maintenance
- −$1,752
- − Management
- −$1,752
- − Depreciation
- −$5,207
- Taxable loss
- −$598
- Est. tax savings @ 24.0%
- +$143
- After-tax cash flow
- $2,420/yr
For passive investors: Depreciation is non-cash, so a rental often shows a tax loss while cash-flowing — sheltering income. Rental losses are passive: they offset passive income freely, and up to $25,000/yr can offset ordinary (W-2) income if you actively participate and your MAGI is under $100k (phasing out to $0 by $150k); unused losses carry forward. On sale, claimed depreciation is recaptured at up to 25%, and gains may owe capital-gains tax (a 1031 exchange can defer both). Figures are a year-1 estimate at your 24.0% rate — not tax advice; consult a CPA.
Schools (NCES district)
- District
- Splendora ISD
- NCES district ID
- 4841070
- Math proficiency
- 25% ▼ -8.00%
- Reading proficiency
- 31% ▼ -1.00%
- Median HH income
- $54,166
- Composite
- 24.92/100
- National rank
- #7572
- State rank
- #648 of 826 in TX
Livability — Splendora
- Score
- 62/100
- State rank
- #911
- US rank
- #16335
Category grades
Schools grade is shown separately in the Schools card above.
Census & demographics
- County
- Montgomery County · 663,713 people
- City population
- 14,367
- Metro
- Houston-The Woodlands-Sugar Land, TX
- Population (ZIP)
- 14,367
- Household income
- $79,085
- Rent vs Own
- Severe rent burden
- 135.0
Population outlook (Montgomery County) Hauer SSP2
- Today (2025)
- 713,896 people
- By 2030
- 805,263 · +12.8%
- By 2040
- 992,708 · +39.1%
- By 2050
- 1,179,590 · +65.2%
- By 2075
- 1,628,084 · +128.1%
- By 2100
- 1,937,880 · +171.5%
Race, ethnicity, and origin ACS 2023
- Neighborhood character
- Majority White (61%)
- Race & ethnicity
- White 61% Hispanic / Latino 36% Two or more races 9% Native American 1%
- Hispanic origin (detail)
- Mexican 32%
- Common ancestry
- Lithuanian 4% Italian 2% Slovak 1%
- Foreign-born
- 9% · Canada
- Languages at home
- 71% English-only · Spanish 28%
Political lean MEDSL · Montgomery
- 2024 margin
- Solid R (+45.5) · D 26.8% · R 72.3%
- 2008→2024 swing
- +7.2pp toward D · 2008: -52.7pp · 2024: -45.5pp
- All cycles
- 2024: R+45.5 2020: R+43.8 2016: R+51.4 2012: R+60.7 2008: R+52.7
Not yet ingested
- Civics
- —
Market trends
- HPI YoY
- ▼ -6.47%
- Current HPI
- 306.9962
- Rent YoY
- —
- Metro
- Houston-The Woodlands-Sugar Land, TX
- State GDP YoY
- ▲ 3.95%
- F500 in state
- 110
Industry mix (Fortune 500 HQ in TX)
| Industry | F500 HQs | Revenue |
|---|---|---|
| Energy | 16 | $1,198B |
|
||
| Technology | 5 | $198B |
|
||
| Engineering / Construction | 4 | $72B |
|
||
| Energy Services | 3 | $60B |
|
||
| Utilities | 3 | $41B |
|
||
| Healthcare | 2 | $330B |
|
||
Price history
-35.5% since first listed6 events — show timeline
- 2026-05-27 Listed $199,900 HARMLS
- 2025-09-11 Listing Removed — HARMLS
- 2025-06-24 Listed $230,000 HARMLS
- 2025-06-16 Listing Removed — HARMLS
- 2025-06-11 Price Changed $280,000 HARMLS
- 2025-05-08 Listed $310,000 HARMLS
Property tax history
+11.2%/yrLatest (2025): $2,870 · +9.8% YoY. Source: county tax records.
Cash-flow waterfall
monthlySold comps — $/sqft
last 12 mo · ≤1 miLoading sold comps…