 Duplex
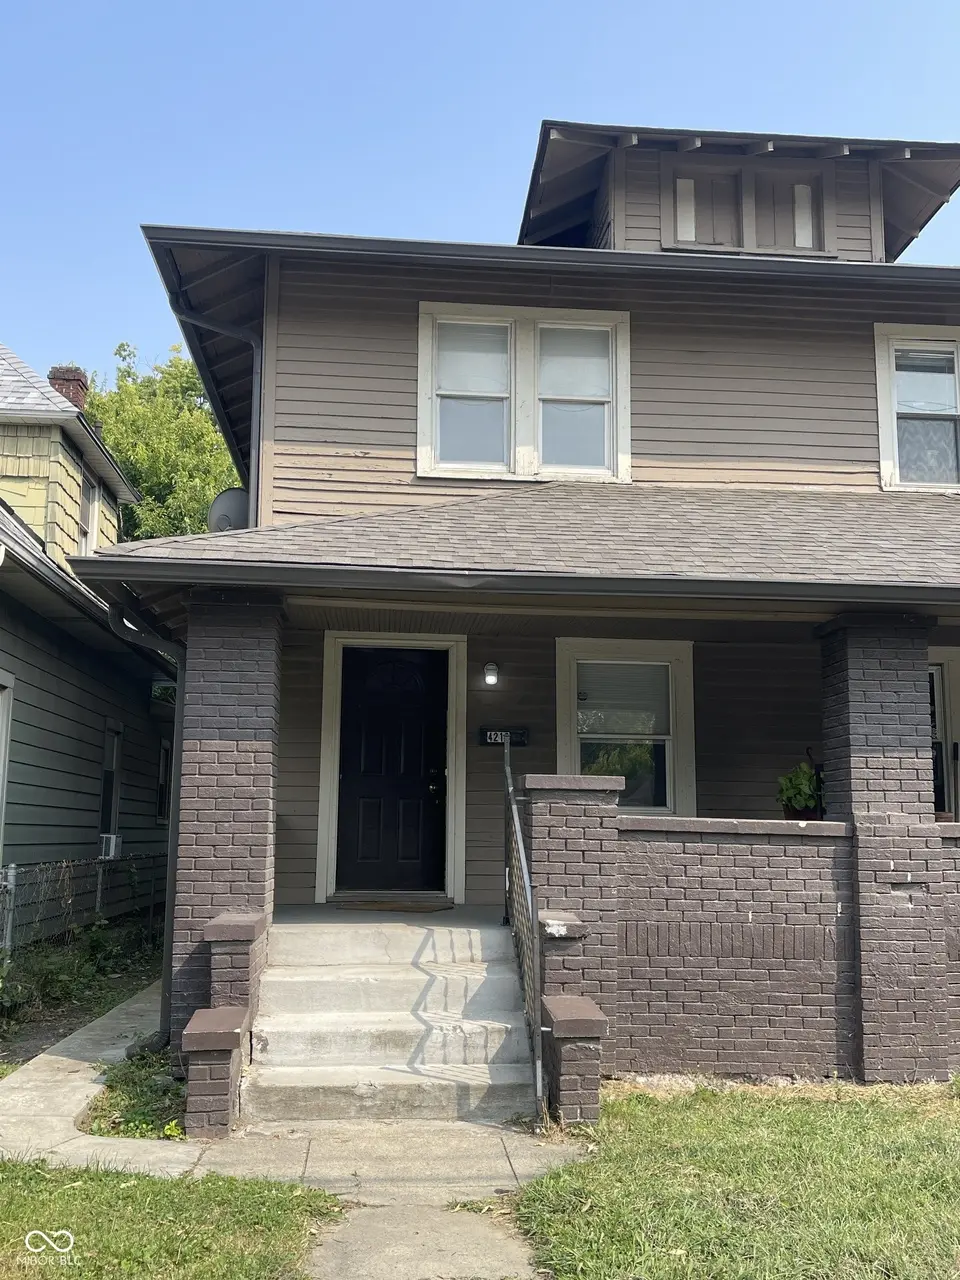
4212 E Washington St · Indianapolis city (balance), IN
Flood risk 1/10 · Minimal
- FEMA flood zone
- X (unshaded)
- Chance of flooding over 30 yrs
- 0.0%
- Est. flood insurance / yr
- $473 – $860
Fire risk 1/10 · Minimal
- Est. fire insurance / yr
- $717 – $1,331
Heat risk 3/10 · Minor
- Hot days now (above 102°F)
- 7 days/yr
- Hot days in 30 yrs
- 19 days/yr
Wind risk 2/10 · Minimal
- Chance of severe wind over 30 yrs
- 0.0%
Air-quality risk 4/10 · Minor
- Unhealthy air days now
- 5 days/yr
- Unhealthy air days in 30 yrs
- 7 days/yr
Risk factors via First Street. Map © Google.
Why this score? — see what drove the C- grade
The composite is a weighted blend of 9 inputs, each scored 0–100. Each bar is that input's sub-score; the figure is the points it added to the 100-point composite (weight × sub-score).
- Cash flow +21.4/30.0
- ARV discount +7.5/15.0
- DSCR +6.8/10.0
- 1% rule +6.1/10.0
- Rent growth +4.3/5.0
- Livability +2.5/5.0
- Condition / age +2.5/5.0
- Schools +1.4/10.0
- Appreciation +0.0/10.0
$209,900
🖨 Deal sheet (PDF) 📄 Offer letter ✓ Due diligence
Multi-family units
County records classify this as Multi-Family (2-4 Unit). Listing-text estimate: 2 units. confirmed
Listing remarks MLS
Check out this great opportunity to add a cash flowing duplex to an existing Real Estate portfolio or maybe this is the perfect opportunity to start that portfolio you have been talking about! 4212 is occupied tenant pays all utilities as well as $950 each month for rent. The 4214 side currently pays all utilities as well as $900 each month for rent. The property features two spacious units that are identical. Please do not disturb tenants if driving by. Tenants right apply. Room sizes are estimates
Key facts
- Near restaurants
- Roof replacement
- Near shops
Tags
Property features AI
Finance
- Other: Zoning: ZO01
- Financial info: Gross income listed as $0; Expenses listed as $0; Unit 1 rent reported as $995/month; Unit 2 rent not reported
Exterior
- Utilities: Solid waste service available
- Home design: Duplex (residential income property)
- Exterior features: Residential use; Road access: see remarks; Lot under 1/4 acre
Interior
- Kitchen: Each unit has a 12x10 kitchen
- Bedrooms: Two 3-bedroom units
- Interior features: Two levels; Basement
Neighborhood map
What this means for you Summary
Snapshot
- This is a 2 × 3-bed/1.5-bath units multifamily listed at $210k.
Deal economics
- At list price, monthly cash flow is $310 ($4k/yr) — positive. Per door: $155/mo.
- The deal already cash-flows at list — no discount required.
- Meets the 1% rule at list price ($2k rent vs $210k).
- Recommended offer: $207k (1.5% below list) — sets the bar for market timing.
- Cap rate 8.1% vs local median 4.4% in Indianapolis city (balance) — top-decile yield for the area; either an underpriced asset or a hidden risk that comps aren't pricing in. Stress-test before assuming the spread holds.
Location & tenants
- Location reads: area grade C — affects rentability + tenant quality, not the cash-flow math above.
- Indianapolis Public Schools (urban): math 14% / reading 20% proficiency, ranked #286 of 301 in IN (top 95%) — low school quality limits family demand, transient renter base, plan for 1-2y turnover; 77% free/reduced lunch — lower-income household profile, screen leases tightly.
- Zoned schools: Frederick Douglass School 19 (math 9% / reading 13%, grade F, #909 of 994 statewide, top 92%, 444 students, 81% FRL); H L Harshman Middle School (math 3% / reading 16%, grade F, #316 of 330 statewide, top 96%, 549 students, 84% FRL).
- Market conditions: Rents rising fast (+7.3%/yr); 483 active listings in the ZIP; 40 comparable units currently listed for rent nearby; rentals at typical pace (median 26d on market — plan ~3-4 weeks tenant-placement turnaround); 40% of comp listings sitting > 30 days — soft ceiling on asking rent; 1,906 units permitted in Marion County in 2024 (621 in 5+ unit buildings).
- At $2,326/mo this rent would consume 57% of the median local household income ($49k/yr) (locally 1906% of renters already pay >50% of income on rent) — very limited rent-growth headroom before tenants either downsize or default.
Forward outlook
- Local home prices are declining (-3.0%/yr); year-one equity from $1k of loan paydown is wiped out by about $6k of value loss. Plan a longer hold.
- Marion County population projected at +18% by 2050 — long-run rental-demand tailwind backs the buy-and-hold thesis.
- At projected returns (-3.0% appreciation + 7.3% rent growth), your $59k cash investment doubles in ~9 years — after that, you're playing with house money.
Negotiation context
- It's been on market 17 days — a 2% lower offer ($207k) is reasonable based on typical stale-listing flexibility.
- 10 sale attempts since 22y ago with the ask held roughly flat each time — persistent listings suggest the price (not the market) is what's stuck; bring a comps-based counter.
- Current owner paid $168k; 25% above their basis — modest negotiation headroom, anchor on the comps not their cost.
Risks & watch-outs
- Watch-outs: built in 1910 — expect roof / HVAC / electrical / plumbing capex.
Questions for the listing agent
- Can we see the unit-by-unit rent roll, current vacancy, and any below-market leases? What's the average tenancy length?
- What capital expenditures (roof, boiler, parking lot, exteriors) have been made in the last 5 years, and what's planned in the next 2?
- Built in 1910 — when were the roof, HVAC, electrical panel, plumbing, and water heater last replaced?
- Is there a deadline driving the sale (1031 exchange, divorce, estate, relocation)? That informs how much negotiation room exists.
- What's the average days-on-market for RENTAL listings here right now (not sales)? A rising rental-DOM trend means longer vacancies and softer asking-rent achievability than the comps imply.
- What's the recent tenant-quality profile in this submarket — average credit score on applications, eviction rate, late-payment / NSF rate, and stable-employment percentage? A property-management company in the area should have these aggregated.
- How much new apartment / multifamily construction is in the pipeline within 1–3 miles? Heavy new supply (>2% of stock underway) typically softens rents 12–24 months out; light construction supports rent growth.
Investment metrics
- 1% rule
- 1.11% ✓
- Cap rate
- 8.07%
- Cash-on-cash
- 6.33%
- DSCR
- 1.28
- GRM
- 7.5
CMA / ARV
- ARV (on-the-fly)
- $102,168
- Comps found
- 1
Show comp detail 1 sale within ~0.75 mi
| Address | Dist | Beds/Ba | Sqft | Sold | Price | $/sf | Match |
|---|---|---|---|---|---|---|---|
| 4205 English Ave | 0.68mi | 2/2.0 (-1) | 1,200 (+3%) | 1mo | $105,500 | $88 | 42 |
Match score weights: distance 35% · size 25% · config 20% · recency 20%. Top-matched comps best support the ARV.
Projected returns pro-forma
-3.0% appreciation · 7.31% rent growth · sell at horizon
- IRR
- -1.6%
- Equity multiple
- 0.94×
- Total profit
- $-3,664
- Equity at exit
- $31,297
- IRR
- 12.4%
- Equity multiple
- 2.19×
- Total profit
- $69,774
- Equity at exit
- $18,148
Cash invested: $58,772 (down + closing). Projections, not guarantees.
Landlord ↔ Tenant lean methodology
- Overall (STATE)
- 90 Strongly Landlord-Friendly
- State Indiana
- 90 Strongly Landlord-Friendly · R+11
- County
- — inherits STATE
- City
- — inherits STATE
ZIP-level market 46201
- Home prices YoY
- -33.9%
- Rents YoY
- 7.3%
- Active inventory
- 483
- Price-to-rent
- 15.0×
Monthly cashflow live
- Estimated rent
- $2,326 high interval (Pro) →
- Mortgage (P&I)
- −$1,101
- Tax from tax record
- −$339 /mo · $4,072/yr
- Insurance
- −$87
- HOA
- −$0
- Vacancy / Maint / Mgmt
- −$488
- Net cashflow
- $310
Break-even live
Sensitivity live
| Price | -10% $429 | -5% $369 | +0% $310 | +5% $251 | +10% $191 |
|---|---|---|---|---|---|
| Rent | -10% $126 | -5% $218 | +0% $310 | +5% $402 | +10% $494 |
| Rate | -1.0pp $416 | -0.5pp $363 | base $310 | +0.5pp $256 | +1.0pp $200 |
2-unit breakdown (identical units grouped — click to expand)
| Units | Beds | Baths | Est. rent |
|---|---|---|---|
| 2× units | 3 | 1.5 | $2,326 |
| #1 | 3 | 1.5 | $1,163 |
| #2 | 3 | 1.5 | $1,163 |
| Total (2 units) | $2,326 | ||
UW: 25.0% down · 7.5% · 30yr · 1.5% tax · 5.0% vac · 8.0% maint · 8.0% mgmt
Financing live
Cash to close
- Down payment
- $52,475
- Closing costs
- $6,297
- Reserves months
- —
- Total cash needed
- —
Loan-product check · same deal, 3 products live
Conventional
25% down · 7.5% · 30yr
- Down + closing
- —
- Monthly P&I
- —
- Monthly cashflow
- —
- DSCR
- —
- Eligible?
- —
Personal DTI + credit; lowest rate.
DSCR
20% down · 8.5% · 30yr
- Down + closing
- —
- Monthly P&I
- —
- Monthly cashflow
- —
- DSCR
- —
- Eligible?
- —
No personal income docs; deal must DSCR.
Hard money
10% down · 12.0% · 12mo
- Down + closing
- —
- Monthly P&I
- —
- Monthly cashflow
- —
- DSCR
- —
- Eligible?
- —
Short-term bridge; refi at stabilization.
Rent comps 40 comps
| Address | Beds | Baths | Sqft | Rent | $/sqft | DOM | Units | Dist |
|---|---|---|---|---|---|---|---|---|
| 4214 E Washington St Indianapolis, IN | 3.0 | 2.0 | 961 | $1,195 | $1.24 | 9d | 1 | 0.03mi |
| 4214 E Washington St Indianapolis, IN | 3.0 | 2.0 | 961 | $1,145 | $1.19 | 0d | 1 | 0.03mi |
| 4114 E Washington St Indianapolis, IN | 2.0 | 1.0 | 909 | $1,100 | $1.21 | 46d | 1 | 0.04mi |
| 119 N Grant Ave Indianapolis, IN | 3.0 | 1.0 | 1408 | $1,195 | $0.85 | 45d | 1 | 0.13mi |
| 25 N Drexel Ave Unit A Indianapolis, IN | 3.0 | 2.0 | 1250 | $1,325 | $1.06 | 45d | 1 | 0.26mi |
| 314 N Denny St Indianapolis, IN | 3.0 | 1.0 | 1184 | $975 | $0.82 | 25d | 1 | 0.28mi |
| 8 S Bradley Ave Indianapolis, IN | 2.0 | 1.0 | 1300 | $950 | $0.73 | 25d | 1 | 0.28mi |
| 33 N Sherman Dr Unit 33 Indianapolis, IN | 3.0 | 1.5 | 1288 | $1,500 | $1.16 | 9d | 1 | 0.32mi |
| 412 N Bradley Ave Unit 3 Indianapolis, IN | 2.0 | 1.0 | 700 | $950 | $1.36 | 25d | 1 | 0.38mi |
| 442 N Denny St Indianapolis, IN | 3.0 | 1.0 | 1140 | $1,045 | $0.92 | 25d | 1 | 0.38mi |
| 447 N Sherman Dr Indianapolis, IN | 3.0 | 1.5 | 1312 | $1,195 | $0.91 | 45d | 1 | 0.44mi |
| 4831 E Washington St Unit 4 Indianapolis, IN | 2.0 | 2.0 | 1000 | $995 | $0.99 | 25d | 1 | 0.44mi |
| 622 N Linwood Ave Indianapolis, IN | 3.0 | 2.0 | 985 | $1,299 | $1.32 | 45d | 1 | 0.45mi |
| 3622 E New York St Indianapolis, IN | 2.0 | 1.0 | 805 | $995 | $1.24 | 45d | 1 | 0.47mi |
| 83 N Ewing St Unit 83 Indianapolis, IN | 3.0 | 1.0 | 1016 | $1,199 | $1.18 | 45d | 1 | 0.48mi |
| 83 N Ewing St Unit 83 Indianapolis, IN | 3.0 | 1.0 | 1016 | $1,199 | $1.18 | 0d | 1 | 0.48mi |
| 603 N Sherman Dr Indianapolis, IN | 3.0 | 1.0 | 1250 | $1,300 | $1.04 | 45d | 1 | 0.50mi |
| 706 N Bosart Ave Indianapolis, IN | 2.0 | 1.0 | 1000 | $1,070 | $1.07 | 25d | 1 | 0.53mi |
| 415 N Dequincy St Indianapolis, IN | 3.0 | 2.0 | 1250 | $1,900 | $1.52 | 16d | 1 | 0.55mi |
| 306 N Riley Ave Indianapolis, IN | 3.0 | 1.0 | 1320 | $1,095 | $0.83 | 19d | 1 | 0.55mi |
| 729 N Bosart Ave Indianapolis, IN | 2.0 | 1.0 | 888 | $1,195 | $1.35 | 25d | 1 | 0.58mi |
| 4417 Linwood Ct Indianapolis, IN | 2.0 | 1.0 | 780 | $929 | $1.19 | 5d | 15 | 0.59mi |
| 822 N Bradley Ave Unit 822 Indianapolis, IN | 3.0 | 1.0 | 1100 | $1,200 | $1.09 | 0d | 1 | 0.64mi |
| 822 N Bradley Ave Unit 822 Indianapolis, IN | 3.0 | 1.0 | 1100 | $1,200 | $1.09 | 45d | 1 | 0.64mi |
| 37 S Tuxedo St Indianapolis, IN | 3.0 | 1.0 | 950 | $1,150 | $1.21 | 45d | 1 | 0.67mi |
| 861 N Drexel Ave Indianapolis, IN | 3.0 | 1.0 | 1000 | $1,200 | $1.20 | 9d | 1 | 0.67mi |
| 861 N Drexel Ave Unit 863 Indianapolis, IN | 3.0 | 1.0 | 1000 | $1,200 | $1.20 | 45d | 1 | 0.67mi |
| 628 N Riley Ave Indianapolis, IN | 2.0 | 1.5 | 948 | $1,295 | $1.37 | 25d | 1 | 0.68mi |
| 4919 Orion Ave Indianapolis, IN | 2.0 | 1.0 | 766 | $875 | $1.14 | 45d | 1 | 0.70mi |
| 4931 Orion Ave Indianapolis, IN | 2.0 | 1.0 | 1200 | $1,450 | $1.21 | 25d | 1 | 0.72mi |
| 4318 Spann Ave Indianapolis, IN | 3.0 | 1.0 | 1411 | $1,200 | $0.85 | 45d | 1 | 0.73mi |
| 953 N Linwood Ave Indianapolis, IN | 2.0 | 1.0 | 960 | $1,325 | $1.38 | 45d | 1 | 0.75mi |
| 508 N Emerson Ave Unit 506 Indianapolis, IN | 2.0 | 1.0 | 950 | $950 | $1.00 | 16d | 1 | 0.76mi |
| 508 Emerson Ave Indianapolis, IN | 3.0 | 1.5 | 1094 | $1,150 | $1.05 | 15d | 1 | 0.76mi |
| 606 N Emerson Ave Indianapolis, IN | 2.0 | 1.5 | 1372 | $2,450 | $1.79 | 25d | 1 | 0.78mi |
| 28 S Dearborn St Unit A Indianapolis, IN | 3.0 | 1.0 | 1100 | $1,400 | $1.27 | 12d | 1 | 0.80mi |
| 28 S Dearborn St Unit B Indianapolis, IN | 2.0 | 1.5 | 1166 | $1,150 | $0.99 | 25d | 1 | 0.80mi |
| 5105 E North St Indianapolis, IN | 2.0 | 2.0 | 1180 | $2,250 | $1.91 | 45d | 1 | 0.80mi |
| 528 S Bosart Ave Indianapolis, IN | 3.0 | 1.0 | 720 | $1,305 | $1.81 | 45d | 1 | 0.81mi |
| 4 N Butler Ave Unit 11 Indianapolis, IN | 2.0 | 1.0 | 850 | $750 | $0.88 | 6d | 1 | 0.83mi |
Listing history 13 events
-
2026-06-21days on market $209,900 Active 17 DOM
-
2026-06-18price $209,900 Active 14 DOM
-
2026-06-18days on market $214,900 Active 14 DOM
-
2026-06-17remarks 699-char remark
-
2026-06-17days on market $214,900 Active 13 DOM
-
2026-06-16days on market $214,900 Active 12 DOM
-
2026-06-15days on market $214,900 Active 11 DOM
-
2026-06-13days on market $214,900 Active 9 DOM
-
2026-06-13days on market $214,900 Active 8 DOM
-
2026-06-09days on market $214,900 Active 5 DOM
-
2026-06-08days on market $214,900 Active 4 DOM
-
2026-06-07remarks 602-char remark
-
2026-06-07$214,900 Active 3 DOM
ⓘ Source: listings_history table (triggers on properties + properties_extension) + one-shot
backfill from property_details.listing_events for pre-trigger history.
Tax reassessment forecast IN · Partial reset (capped growth)
- Current annual tax
- $4,072 · $339/mo
- Projected year-2 tax
- $4,072 · $339/mo
- Expected delta
- $0/yr ($0/mo · 0.0%)
ⓘ Screening estimate from a state-policy table — verify with the county assessor before closing.
Climate risk First Street
- Flood 1/10 Low FEMA zone X (unshaded) · 0% chance over 30 yrs
- Wildfire 1/10 Low
- Heat 3/10 Moderate 7 d/yr ≥102°F today · 19 d/yr by 30 yrs out
- Wind 2/10 Low 0% chance of damaging wind over 30 yrs
- Air quality 4/10 Moderate 5 unhealthy d/yr today · 7 by 30 yrs out
Nearby sold comps map
Loading sold comps map…
Walkable amenities ~0.75 mi
Loading nearby amenities…
Taxation est. · year 1
- Rental income
- $27,912
- − Mortgage interest
- −$11,758
- − Property taxes
- −$4,072
- − Insurance
- −$1,050
- − Repairs & maintenance
- −$2,233
- − Management
- −$2,233
- − Depreciation
- −$6,106
- Taxable income
- $460
- Est. tax owed @ 24.0%
- −$110
- After-tax cash flow
- $3,609/yr
For passive investors: Depreciation is non-cash, so a rental often shows a tax loss while cash-flowing — sheltering income. Rental losses are passive: they offset passive income freely, and up to $25,000/yr can offset ordinary (W-2) income if you actively participate and your MAGI is under $100k (phasing out to $0 by $150k); unused losses carry forward. On sale, claimed depreciation is recaptured at up to 25%, and gains may owe capital-gains tax (a 1031 exchange can defer both). Figures are a year-1 estimate at your 24.0% rate — not tax advice; consult a CPA.
Schools (NCES district)
- District
- Indianapolis Public Schools
- NCES district ID
- 1804770
- Math proficiency
- 14% ▼ -7.00%
- Reading proficiency
- 20% ▼ -3.00%
- Median HH income
- $32,034
- Composite
- 13.69/100
- National rank
- #9499
- State rank
- #286 of 301 in IN
Livability — Indianapolis city (balance)
No livability data for this city. (Only ~50 U.S. cities are tracked.)
Census & demographics
- Census place
- Indianapolis city (balance), IN
- County
- Marion County · 998,460 people
- City population
- 881,119
- Metro
- Indianapolis-Carmel-Anderson, IN
- Population (ZIP)
- 30,335
- Household income
- $49,195
- Rent vs Own
- Severe rent burden
- 1906.0
Population outlook (Marion County) Hauer SSP2
- Today (2025)
- 1,025,572 people
- By 2030
- 1,065,727 · +3.9%
- By 2040
- 1,141,577 · +11.3%
- By 2050
- 1,208,920 · +17.9%
- By 2075
- 1,367,288 · +33.3%
- By 2100
- 1,438,201 · +40.2%
Race, ethnicity, and origin ACS 2023
- Neighborhood character
- Diverse neighborhood (Simpson 0.63)
- Race & ethnicity
- White 53% Hispanic / Latino 23% Black 18% Two or more races 9%
- Hispanic origin (detail)
- Mexican 14% Puerto Rican 2%
- Common ancestry
- Slovak 2% Lithuanian 2% Italian 1%
- Foreign-born
- 9% · Canada
- Languages at home
- 81% English-only · Spanish 17%
Political lean MEDSL · Marion
- 2024 margin
- Strong D (+27.7) · D 63.0% · R 35.3% · Other 1.7%
- 2008→2024 swing
- -0.7pp no change · 2008: 28.4pp · 2024: 27.7pp
- All cycles
- 2024: D+27.7 2020: D+29.1 2016: D+22.8 2012: D+22.2 2008: D+28.4
Not yet ingested
- Civics
- —
Market trends
- HPI YoY
- ▼ -192.51%
- Current HPI
- 375.0969
- Rent YoY
- ▲ 7.31%
- Metro
- Indianapolis-Carmel-Anderson, IN
- State GDP YoY
- ▲ 2.90%
- F500 in state
- 18
Industry mix (Fortune 500 HQ in IN)
| Industry | F500 HQs | Revenue |
|---|---|---|
| Industrial Machinery | 2 | $37B |
|
||
| Healthcare | 1 | $177B |
|
||
| Pharmaceuticals | 1 | $45B |
|
||
| Metals / Steel | 1 | $18B |
|
||
| Agriculture | 1 | $17B |
|
||
| Packaging | 1 | $12B |
|
||
Price history
+207.4% since first listed24 events — show timeline
- 2026-06-04 Listed $214,900 MIBOR as Distributed by MLS Grid
- 2025-12-11 Rental Removed $995 ZUMPER1
- 2025-12-10 Rental Removed $995 MIBOR
- 2025-12-02 Listed for Rent $995 ZUMPER1
- 2025-11-24 Rental Removed $995 ZUMPER1
- 2025-11-22 Price Changed $995 MIBOR
- 2025-11-22 Price Changed $995 ZUMPER1
- 2025-11-01 Listed for Rent $1,075 ZUMPER1
- 2025-10-12 Price Changed $1,075 MIBOR
- 2025-09-13 Price Changed $1,095 MIBOR
- 2025-09-09 Listed for Rent $1,175 MIBOR
- 2023-10-24 Sold (MLS) $168,000 MIBOR as Distributed by MLS Grid
- 2023-09-25 Pending — MIBOR as Distributed by MLS Grid
- 2023-08-23 Relisted — MIBOR as Distributed by MLS Grid
- 2023-08-03 Pending — MIBOR as Distributed by MLS Grid
- 2023-07-10 Listed $175,000 MIBOR as Distributed by MLS Grid
- 2023-04-21 Listing Removed — MIBOR as Distributed by MLS Grid
- 2023-01-20 Listed $185,000 MIBOR as Distributed by MLS Grid
- 2017-10-30 Listing Removed — MIBOR as Distributed by MLS Grid
- 2017-10-26 Listed $49,999 MIBOR as Distributed by MLS Grid
- 2009-08-14 Listing Removed — MIBOR as Distributed by MLS Grid
- 2009-02-13 Listed $22,900 MIBOR as Distributed by MLS Grid
- 2005-10-27 Sold (MLS) $62,000 MIBOR as Distributed by MLS Grid
- 2004-08-17 Listed $69,900 MIBOR as Distributed by MLS Grid
Property tax history
+13.9%/yrLatest (2025): $4,072 · -4.6% YoY. Source: county tax records.
Cash-flow waterfall
monthlySold comps — $/sqft
last 12 mo · ≤1 miLoading sold comps…