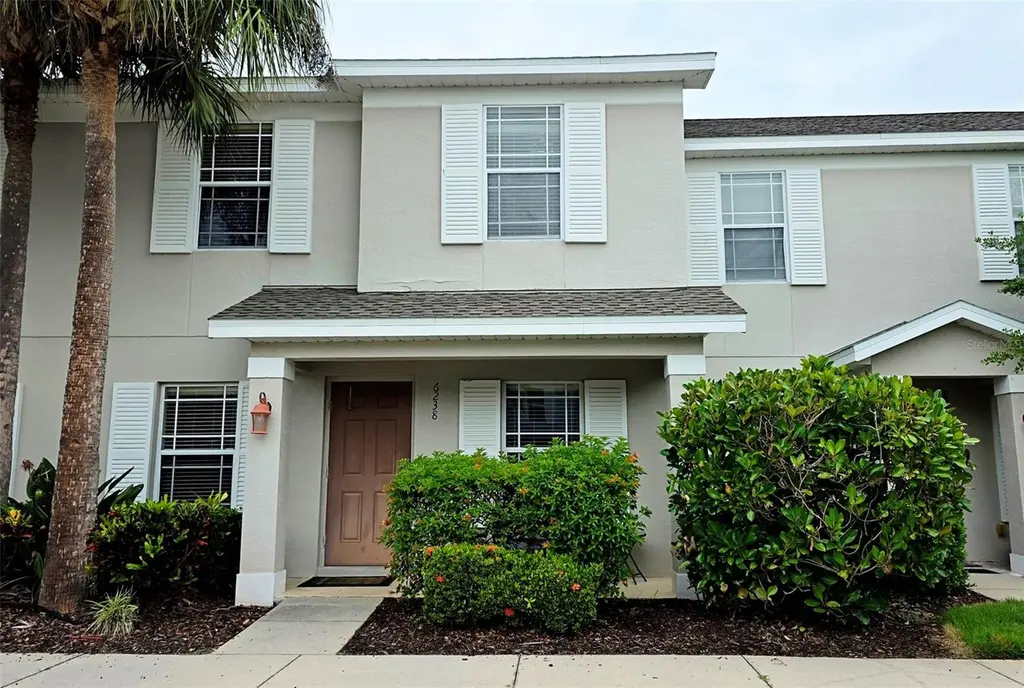
6238 Flagfish Ct · Lakewood Ranch, FL
Flood risk 1/10 · Minimal
- FEMA flood zone
- X (unshaded)
- Chance of flooding over 30 yrs
- 0.0%
- Est. flood insurance / yr
- $507 – $1,088
Fire risk 4/10 · Minor
- Est. fire insurance / yr
- $947 – $1,759
Heat risk 10/10 · Severe
- Hot days now (above 109°F)
- 7 days/yr
- Hot days in 30 yrs
- 29 days/yr
Wind risk 10/10 · Severe
- Chance of severe wind over 30 yrs
- 99.0%
Air-quality risk 3/10 · Minor
- Unhealthy air days now
- 2 days/yr
- Unhealthy air days in 30 yrs
- 2 days/yr
Risk factors via First Street. Map © Google.
Why this score? — see what drove the D grade
The composite is a weighted blend of 9 inputs, each scored 0–100. Each bar is that input's sub-score; the figure is the points it added to the 100-point composite (weight × sub-score).
- Cash flow +9.2/30.0
- ARV discount +7.5/15.0
- 1% rule +5.5/10.0
- Appreciation +4.4/10.0
- Schools +4.4/10.0
- DSCR +2.6/10.0
- Livability +2.5/5.0
- Condition / age +2.5/5.0
- Rent growth +2.4/5.0
$249,000
🖨 Deal sheet (PDF) 📄 Offer letter ✓ Due diligence
Listing remarks MLS
HURRY- this perfect townhouse won't last long! Nestled in the heart of the #1 Master Planned Community in Southwest Florida- Greenbrook Walk is the perfect location, next to top rated LWR schools, a public park and within minutes to new shopping centers full of stores and restuarants. This two story townhouse has been nicely updated! BRAND NEW AC and ALL NEW DUCT WORK! NEW LUXURY VINYL PLANK FLOORING throughout entire home- NO CARPET! NEW Stainless Steel Appliances and brand new garbage disposal! Kitchen cabinets & counters have been resurfaced. Versatile floor plan- with two living areas downstairs, room for a dining room and a kitchen in the center. Half bath downstairs. Laundry conveniently located upstairs! Upstairs, there are two nice sized bedrooms with a shared bathroom with tub/shower combo. Large master bedroom with lots of natural light, large walk in closet and attached bathroom! There is a screened lanai with storage room downstairs and greenspace behind home. Two designated parking spaces right outside your front door. This community has a pool and park for your enjoyment. Monthly HOA fees cover everything but the electric! So move in, save money and leave the worries behind! This townhouse is maintenance free- no exterior maintenance or ground keep up required! Back on market due to buyer unable to qualify for loan.
Key facts
- End unit location
- Heated pool and spa
- Screened in lanai
Tags
Property features AI
Finance
- Other: CDD present
- Financial info: Total monthly fees: $458.42; Total annual fees: $5,501; Lease restrictions apply
- HOA & community: HOA required; Monthly condo fee: $454; Annual association fee: $53; Association amenities include pool, cable TV, internet, maintenance (grounds & structure), management, pest control, sewer, trash, water, and escrow reserves; Buyer/association approval required; Deed restrictions and community mailbox; Pets allowed with limits; Association recreation owned
Exterior
- Parking: Assigned parking
- Utilities: Public water; Public sewer; Electricity connected; Cable and internet available; Sewer connected; Water connected; Underground utilities
- Home design: Attached condominium; Two-story building; Faces east; Entry on first floor (unit on floor 1)
- Construction: Block and stucco construction; Shingle roof; Slab foundation; Building completed
- Exterior features: Sidewalks; Paved roads
Interior
- Kitchen: Dishwasher; Microwave; Range; Refrigerator; Electric water heater
- Bedrooms: 3 bedrooms (one on floor 1)
- Flooring: Tile; Vinyl
- Bathrooms: 2 full bathrooms; 1 half bathroom
- Heating & cooling: Central heating (electric); Central air conditioning
- Interior features: Ceiling fans; Living room/dining room combo; Walk-in closets; Inside utility room
- Laundry & utility: Inside laundry; Laundry closet; Upper level laundry location
Neighborhood map
What this means for you Summary
Snapshot
- This is a 3-bed/2.5-bath condo listed at $249k.
Deal economics
- At list price, monthly cash flow is $-185 ($-2k/yr) — negative.
- To cash-flow at today's rent, offer at most $216k (13.1% below list).
- Meets the 1% rule at list price ($3k rent vs $249k).
- Recommended offer: $216k (13.1% below list) — sets the bar for cash-flow.
- Cap rate 5.4% vs local median 3.3% in Lakewood Ranch — top-decile yield for the area; either an underpriced asset or a hidden risk that comps aren't pricing in. Stress-test before assuming the spread holds.
Location & tenants
- Location reads: area grade D — affects rentability + tenant quality, not the cash-flow math above.
- Manatee (suburban): math 54% / reading 50% proficiency, ranked #26 of 73 in FL (top 36%) — acceptable for families but not a draw, mixed tenant base, ~2y average lease.
- Zoned schools: Gilbert W Mcneal Elementary School (math 80% / reading 79%, grade A, #116 of 2,144 statewide, top 6%, 678 students, 20% FRL); R. Dan Nolan Middle School (math 79% / reading 72%, grade A, #38 of 571 statewide, top 7%, 760 students, 28% FRL); Lakewood Ranch High School (math 47% / reading 63%, grade C, #135 of 667 statewide, top 20%, 2,435 students, 22% FRL) — zoned schools average 23% FRL vs 51% district-wide (27 pts lower); this property's tenant base skews higher-income than the district average.
- Zoned-school proficiency averages 70% at this address vs 52% district-wide (+18 pts) — the actual schools serving this property are materially stronger than the Manatee average implies; a family-tenant draw the district grade alone would hide.
- Market conditions: Rents soft (-0.5%/yr); 507 active listings in the ZIP; 40 comparable units currently listed for rent nearby; rentals at typical pace (median 26d on market — plan ~3-4 weeks tenant-placement turnaround); high-income renter base; 7,472 units permitted in Manatee County in 2024 (1,782 in 5+ unit buildings).
Forward outlook
- Local home prices are declining (-1.2%/yr); year-one equity from $2k of loan paydown is wiped out by about $3k of value loss. Plan a longer hold.
- Manatee County population projected at +43% by 2050 — long-run rental-demand tailwind backs the buy-and-hold thesis.
Negotiation context
- It's been on market 15 days — a 2% lower offer ($245k) is reasonable based on typical stale-listing flexibility.
- 5 sale attempts since 19y ago with the ask held roughly flat each time — persistent listings suggest the price (not the market) is what's stuck; bring a comps-based counter.
Risks & watch-outs
- Climate carrying-cost: severe wind risk, 99% chance of damaging wind over 30y; extreme-heat days projected 7→29/yr by 2055 (HVAC capex compounding) — expect insurance premiums to compound above CPI over the hold.
Questions for the listing agent
- What do current leases actually rent for vs. the listed asking? Can we see a recent rent roll and the last 12 months of T-12 income?
- What does the HOA fee cover, when was the last increase, and are there any pending special assessments or reserve-fund shortfalls?
- Any open or pending special assessments — roof, HVAC, plumbing, elevator, façade? What's the per-unit balance and payoff schedule, and is the seller paying it off at close or rolling it to the buyer?
- Is there a deadline driving the sale (1031 exchange, divorce, estate, relocation)? That informs how much negotiation room exists.
- The area grade is low — what's the realistic commute time and amenity access for the typical tenant pool here? Any planned neighborhood developments (good or bad) we should know about?
- What's the average days-on-market for RENTAL listings here right now (not sales)? A rising rental-DOM trend means longer vacancies and softer asking-rent achievability than the comps imply.
- What's the recent tenant-quality profile in this submarket — average credit score on applications, eviction rate, late-payment / NSF rate, and stable-employment percentage? A property-management company in the area should have these aggregated.
- How much new apartment / multifamily construction is in the pipeline within 1–3 miles? Heavy new supply (>2% of stock underway) typically softens rents 12–24 months out; light construction supports rent growth.
Investment metrics
- 1% rule
- 1.05% ✓
- Cap rate
- 5.40%
- Cash-on-cash
- -3.18%
- DSCR
- 0.86
- GRM
- 7.9
CMA / ARV
No comps found within radius.
Projected returns pro-forma
-1.2% appreciation · 0.0% rent growth · sell at horizon
- IRR
- -14.0%
- Equity multiple
- 0.43×
- Total profit
- $-40,053
- Equity at exit
- $57,739
- IRR
- -11.2%
- Equity multiple
- 0.14×
- Total profit
- $-60,238
- Equity at exit
- $58,636
Cash invested: $69,720 (down + closing). Projections, not guarantees.
Landlord ↔ Tenant lean methodology
- Overall (STATE)
- 87 Strongly Landlord-Friendly
- State Florida
- 87 Strongly Landlord-Friendly · R+3
- County
- — inherits STATE
- City
- — inherits STATE
ZIP-level market 34202
- Home prices YoY
- -0.5%
- Rents YoY
- -0.5%
- Active inventory
- 507
- Price-to-rent
- 7.9×
Monthly cashflow live
- Estimated rent
- $2,626 high interval (Pro) →
- Mortgage (P&I)
- −$1,306
- Tax from tax record
- −$391 /mo · $4,695/yr
- Insurance
- −$104
- HOA
- −$458
- Vacancy / Maint / Mgmt
- −$551
- Net cashflow
- $-185
Break-even live
Sensitivity live
| Price | -10% $-44 | -5% $-114 | +0% $-185 | +5% $-255 | +10% $-326 |
|---|---|---|---|---|---|
| Rent | -10% $-392 | -5% $-288 | +0% $-185 | +5% $-81 | +10% $23 |
| Rate | -1.0pp $-59 | -0.5pp $-121 | base $-185 | +0.5pp $-249 | +1.0pp $-315 |
UW: 25.0% down · 7.5% · 30yr · 1.5% tax · 5.0% vac · 8.0% maint · 8.0% mgmt
Financing live
Cash to close
- Down payment
- $62,250
- Closing costs
- $7,470
- Reserves months
- —
- Total cash needed
- —
Loan-product check · same deal, 3 products live
Conventional
25% down · 7.5% · 30yr
- Down + closing
- —
- Monthly P&I
- —
- Monthly cashflow
- —
- DSCR
- —
- Eligible?
- —
Personal DTI + credit; lowest rate.
DSCR
20% down · 8.5% · 30yr
- Down + closing
- —
- Monthly P&I
- —
- Monthly cashflow
- —
- DSCR
- —
- Eligible?
- —
No personal income docs; deal must DSCR.
Hard money
10% down · 12.0% · 12mo
- Down + closing
- —
- Monthly P&I
- —
- Monthly cashflow
- —
- DSCR
- —
- Eligible?
- —
Short-term bridge; refi at stabilization.
Rent comps 40 comps
| Address | Beds | Baths | Sqft | Rent | $/sqft | DOM | Units | Dist |
|---|---|---|---|---|---|---|---|---|
| 6209 Flagfish Ct Lakewood Ranch, FL | 3.0 | 3.0 | 1276 | $1,845 | $1.45 | 17d | 1 | 0.04mi |
| 14909 Skip Jack Loop #102 Lakewood Ranch, FL | 2.0 | 2.5 | 1160 | $2,200 | $1.90 | 23d | 1 | 0.14mi |
| 6209 Flagfish Ct #102 Lakewood Ranch, FL | 3.0 | 2.5 | 1276 | $1,895 | $1.49 | 25d | 1 | 0.15mi |
| 15019 Skip Jack Loop Lakewood Ranch, FL | 4.0 | 2.5 | 2012 | $2,600 | $1.29 | 25d | 1 | 0.21mi |
| 15019 Skip Jack Loop Lakewood Ranch, FL | 4.0 | 2.5 | 2012 | $2,600 | $1.29 | 23d | 1 | 0.21mi |
| 14956 Amberjack Ter #103 Lakewood Ranch, FL | 3.0 | 2.5 | 1540 | $1,975 | $1.28 | 25d | 1 | 0.21mi |
| 15121 Searobbin Dr Lakewood Ranch, FL | 4.0 | 2.5 | 1868 | $2,850 | $1.53 | 25d | 1 | 0.23mi |
| 6258 Blue Runner Ct Lakewood Ranch, FL | 3.0 | 2.0 | 1275 | $2,000 | $1.57 | 17d | 1 | 0.27mi |
| 6246 Blue Runner Ct Lakewood Ranch, FL | 3.0 | 2.0 | 1556 | $2,300 | $1.48 | 17d | 1 | 0.28mi |
| 14505 Westbrook Cir Bradenton, FL | 1.0–2.0 | 1.0–2.0 | 1016 | $1,906 | $1.88 | 5d | 10 | 0.41mi |
| 14367 59th Cir E Bradenton, FL | 4.0 | 2.0 | 2006 | $2,850 | $1.42 | 25d | 1 | 0.56mi |
| 5818 143rd Ct E Bradenton, FL | 4.0 | 2.0 | 2006 | $2,795 | $1.39 | 13d | 1 | 0.63mi |
| 5819 Oak Bridge Ct Bradenton, FL | 4.0 | 2.0 | 2034 | $2,850 | $1.40 | 16d | 1 | 0.66mi |
| 13700 Luxe Ave Bradenton, FL | 1.0–3.0 | 1.0–2.0 | 1068 | $2,205 | $2.06 | 3d | 25 | 0.74mi |
| 15228 Lyla Ter Bradenton, FL | 3.0 | 2.5 | 1925 | $3,000 | $1.56 | 25d | 1 | 0.90mi |
| 15126 Sunny Day Dr Bradenton, FL | 3.0 | 3.0 | 1879 | $2,700 | $1.44 | 25d | 1 | 0.96mi |
| 15035 Sunny Day Dr Bradenton, FL | 3.0 | 2.5 | 1880 | $2,950 | $1.57 | 25d | 1 | 0.98mi |
| 5510 Tidal Breeze Cv Unit 5510 Bradenton, FL | 2.0 | 2.0 | 1414 | $3,495 | $2.47 | 25d | 1 | 1.01mi |
| 5537 Tidal Breeze Cv Bradenton, FL | 3.0 | 2.0 | 1564 | $2,700 | $1.73 | 25d | 1 | 1.02mi |
| 14775 Lyla Ter Bradenton, FL | 3.0 | 2.5 | 1879 | $2,600 | $1.38 | 21d | 1 | 1.03mi |
| 14753 Lyla Ter Bradenton, FL | 3.0 | 2.5 | 1879 | $2,600 | $1.38 | 12d | 1 | 1.04mi |
| 14776 Lyla Ter Bradenton, FL | 3.0 | 2.5 | 1879 | $4,500 | $2.39 | 25d | 1 | 1.05mi |
| 14736 Lyla Ter Bradenton, FL | 3.0 | 2.5 | 1700 | $3,000 | $1.76 | 17d | 1 | 1.07mi |
| 6211 Baywood Ct Bradenton, FL | 4.0 | 3.0 | 2203 | $3,200 | $1.45 | 5d | 1 | 1.15mi |
| 13737 Messina Loop Bradenton, FL | 2.0 | 2.0 | 1528 | $4,750 | $3.11 | 25d | 2 | 1.15mi |
| 13732 Messina Loop #201 Bradenton, FL | 2.0 | 2.0 | 1528 | $2,775 | $1.82 | 17d | 1 | 1.16mi |
| 15018 Oxford Grey Dr Bradenton, FL | 4.0 | 3.0 | 2032 | $5,500 | $2.71 | 25d | 1 | 1.17mi |
| 13823 Messina Loop Bradenton, FL | 2.0 | 2.0 | 1528 | $2,950 | $1.93 | 25d | 2 | 1.19mi |
| 15161 Serene Shores Loop Bradenton, FL | 3.0 | 3.0 | 1840 | $3,800 | $2.07 | 25d | 1 | 1.19mi |
| 15721 Sunny Day Dr Bradenton, FL | 2.0 | 2.0 | 1580 | $6,500 | $4.11 | 25d | 1 | 1.20mi |
| 13725 Messina Loop #201 Bradenton, FL | 2.0 | 2.0 | 1528 | $2,900 | $1.90 | 25d | 1 | 1.20mi |
| 13710 Messina Loop #203 Bradenton, FL | 2.0 | 2.0 | 1528 | $3,200 | $2.09 | 25d | 1 | 1.20mi |
| 13711 Messina Loop #104 Bradenton, FL | 2.0 | 2.0 | 1528 | $2,495 | $1.63 | 25d | 1 | 1.22mi |
| 13711 Messina Loop #203 Bradenton, FL | 2.0 | 2.0 | 1528 | $3,200 | $2.09 | 17d | 1 | 1.22mi |
| 13703 Messina Loop #102 Bradenton, FL | 2.0 | 2.0 | 1528 | $2,750 | $1.80 | 25d | 1 | 1.25mi |
| 13720 Messina Loop Bradenton, FL | 2.0 | 2.0 | 1528 | $4,750 | $3.11 | 25d | 2 | 1.25mi |
| 5316 Crystal Harbor Cv Bradenton, FL | 3.0 | 2.0 | 1564 | $2,700 | $1.73 | 23d | 1 | 1.25mi |
| 5316 Crystal Harbor Cv Bradenton, FL | 2.0 | 2.0 | 1564 | $2,700 | $1.73 | 25d | 1 | 1.25mi |
| 13604 Messina Loop #103 Bradenton, FL | 2.0 | 2.0 | 1528 | $6,000 | $3.93 | 5d | 1 | 1.27mi |
| 5307 Crystal Harbor Cv Bradenton, FL | 2.0 | 2.0 | 1557 | $3,000 | $1.93 | 25d | 1 | 1.30mi |
HOA detail condo
- Monthly dues
- $458 · $5,496/yr
- Likely covers
- trashelectricexterior maint.pool
- Assessments
- None detected in remarks — confirm with the listing agent.
Listing history 11 events
-
2026-06-17status $249,000 Pending 15 DOM
-
2026-06-17days on market $249,000 Active 15 DOM
-
2026-06-16days on market $249,000 Active 14 DOM
-
2026-06-15days on market $249,000 Active 13 DOM
-
2026-06-13days on market $249,000 Active 11 DOM
-
2026-06-13days on market $249,000 Active 10 DOM
-
2026-06-10days on market $249,000 Active 8 DOM
-
2026-06-09days on market $249,000 Active 7 DOM
-
2026-06-08days on market $249,000 Active 6 DOM
-
2026-06-07remarks 699-char remark
-
2026-06-07$249,000 Active 5 DOM
ⓘ Source: listings_history table (triggers on properties + properties_extension) + one-shot
backfill from property_details.listing_events for pre-trigger history.
Tax reassessment forecast FL · Resets to sale price
- Current annual tax
- $4,695 · $391/mo
- Projected year-2 tax
- $4,695 · $391/mo
- Expected delta
- $0/yr ($0/mo · 0.0%)
ⓘ Screening estimate from a state-policy table — verify with the county assessor before closing.
Climate risk First Street
- Flood 1/10 Low FEMA zone X (unshaded) · 0% chance over 30 yrs
- Wildfire 4/10 Moderate
- Heat 10/10 Extreme 7 d/yr ≥109°F today · 29 d/yr by 30 yrs out
- Wind 10/10 Extreme 99% chance of damaging wind over 30 yrs
- Air quality 3/10 Moderate 2 unhealthy d/yr today · 2 by 30 yrs out
Nearby sold comps map
Loading sold comps map…
Walkable amenities ~0.75 mi
Loading nearby amenities…
Taxation est. · year 1
- Rental income
- $31,507
- − Mortgage interest
- −$13,948
- − Property taxes
- −$4,695
- − Insurance
- −$1,245
- − Repairs & maintenance
- −$2,521
- − Management
- −$2,521
- − HOA
- −$5,496
- − Depreciation
- −$7,244
- Taxable loss
- −$6,162
- Est. tax savings @ 24.0%
- +$1,479
- After-tax cash flow
- $-736/yr
For passive investors: Depreciation is non-cash, so a rental often shows a tax loss while cash-flowing — sheltering income. Rental losses are passive: they offset passive income freely, and up to $25,000/yr can offset ordinary (W-2) income if you actively participate and your MAGI is under $100k (phasing out to $0 by $150k); unused losses carry forward. On sale, claimed depreciation is recaptured at up to 25%, and gains may owe capital-gains tax (a 1031 exchange can defer both). Figures are a year-1 estimate at your 24.0% rate — not tax advice; consult a CPA.
Schools (NCES district)
- District
- Manatee
- NCES district ID
- 1201230
- Math proficiency
- 54% ▼ -6.00%
- Reading proficiency
- 50% ▼ -2.00%
- Median HH income
- $49,607
- Composite
- 44.43/100
- National rank
- #2806
- State rank
- #26 of 73 in FL
Livability — Lakewood Ranch
No livability data for this city. (Only ~50 U.S. cities are tracked.)
Census & demographics
- Census place
- Lakewood Ranch, FL
- County
- Manatee County · 416,364 people
- City population
- 52,177
- Metro
- North Port-Sarasota-Bradenton, FL
- Population (ZIP)
- 27,197
- Household income
- $121,659
- Rent vs Own
- Severe rent burden
- 574.0
Population outlook (Manatee County) Hauer SSP2
- Today (2025)
- 447,342 people
- By 2030
- 488,911 · +9.3%
- By 2040
- 567,934 · +27.0%
- By 2050
- 637,995 · +42.6%
- By 2075
- 781,970 · +74.8%
- By 2100
- 848,272 · +89.6%
Race, ethnicity, and origin ACS 2023
- Neighborhood character
- Predominantly White (80%)
- Race & ethnicity
- White 80% Two or more races 10% Hispanic / Latino 9% Asian 3% Black 2%
- Hispanic origin (detail)
- Puerto Rican 4% Cuban 2%
- Common ancestry
- Romanian 4% Italian 4% Slovak 3%
- Foreign-born
- 12% · Canada, Vietnam, China
- Languages at home
- 88% English-only · Spanish 5% Arabic 1% Other Asian/Pacific 1%
Political lean MEDSL · Manatee
- 2024 margin
- Strong R (+23.5) · D 37.9% · R 61.4%
- 2008→2024 swing
- -16.5pp toward R · 2008: -7.0pp · 2024: -23.5pp
- All cycles
- 2024: R+23.5 2020: R+16.1 2016: R+17.1 2012: R+12.5 2008: R+7.0
Not yet ingested
- Civics
- —
Market trends
- HPI YoY
- ▼ -1.20%
- Current HPI
- 240.7087
- Rent YoY
- ▼ -0.54%
- Metro
- North Port-Sarasota-Bradenton, FL
- State GDP YoY
- ▲ 3.28%
- F500 in state
- 36
Industry mix (Fortune 500 HQ in FL)
| Industry | F500 HQs | Revenue |
|---|---|---|
| Industrial Technology | 2 | $29B |
|
||
| Insurance | 2 | $17B |
|
||
| Retail | 1 | $60B |
|
||
| Technology Distribution | 1 | $58B |
|
||
| Homebuilding | 1 | $35B |
|
||
| Technology Manufacturing | 1 | $35B |
|
||
Price history
+18.6% since first listed15 events — show timeline
- 2026-06-02 Listed $249,000 Stellar MLS as Distributed by MLS Grid
- 2021-07-26 Sold (Public Records) $235,000 Public Records
- 2021-07-16 Sold (MLS) $235,000 Stellar MLS as Distributed by MLS Grid
- 2021-06-19 Pending — Stellar MLS as Distributed by MLS Grid
- 2021-06-15 Relisted — Stellar MLS as Distributed by MLS Grid
- 2021-06-04 Pending — Stellar MLS as Distributed by MLS Grid
- 2021-05-28 Price Changed $240,000 Stellar MLS as Distributed by MLS Grid
- 2021-05-20 Price Changed $250,000 Stellar MLS as Distributed by MLS Grid
- 2021-05-19 Listed $265,000 Stellar MLS as Distributed by MLS Grid
- 2020-08-28 Sold (Public Records) $160,000 Public Records
- 2020-08-28 Sold (MLS) $160,000 Stellar MLS as Distributed by MLS Grid
- 2020-07-24 Pending — Stellar MLS as Distributed by MLS Grid
- 2020-07-20 Listed $165,000 Stellar MLS as Distributed by MLS Grid
- 2015-11-03 Sold (Public Records) $147,000 Public Records
- 2007-01-11 Listed $209,900 Stellar MLS as Distributed by MLS Grid
Property tax history
+7.4%/yrLatest (2025): $4,695 · -3.9% YoY. Source: county tax records.
Cash-flow waterfall
monthlySold comps — $/sqft
last 12 mo · ≤1 miLoading sold comps…