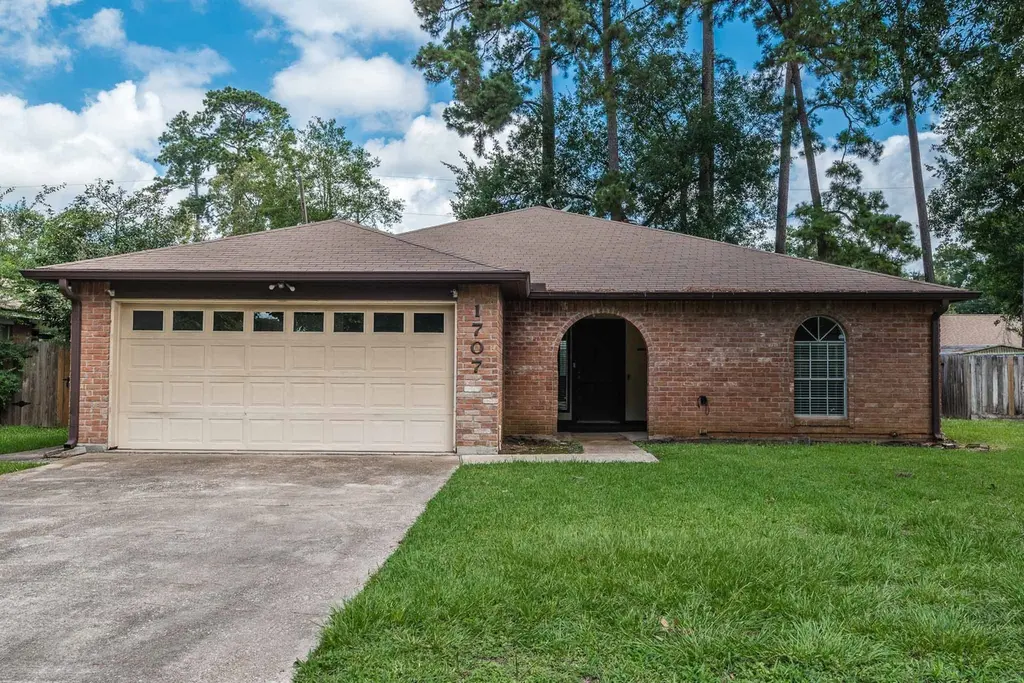
1707 Lindy Ln · Conroe, TX
Flood risk 1/10 · Minimal
- FEMA flood zone
- X (unshaded)
- Chance of flooding over 30 yrs
- 0.0%
- Est. flood insurance / yr
- $507 – $1,088
Fire risk 3/10 · Minor
- Est. fire insurance / yr
- $1,222 – $2,270
Heat risk 9/10 · Severe
- Hot days now (above 111°F)
- 7 days/yr
- Hot days in 30 yrs
- 25 days/yr
Wind risk 8/10 · Major
- Chance of severe wind over 30 yrs
- 99.0%
Air-quality risk 2/10 · Minimal
- Unhealthy air days now
- 2 days/yr
- Unhealthy air days in 30 yrs
- 2 days/yr
Risk factors via First Street. Map © Google.
Why this score? — see what drove the D grade
The composite is a weighted blend of 9 inputs, each scored 0–100. Each bar is that input's sub-score; the figure is the points it added to the 100-point composite (weight × sub-score).
- ARV discount +12.0/15.0
- Cash flow +11.7/30.0
- Schools +5.1/10.0
- Livability +3.7/5.0
- 1% rule +3.5/10.0
- DSCR +3.5/10.0
- Rent growth +2.9/5.0
- Condition / age +2.5/5.0
- Appreciation +0.0/10.0
$207,800
🖨 Deal sheet 📄 Offer letter ✓ Due diligence
Listing remarks MLS
Estate Sale. House original and ready for move-in. Large rooms and full sized master bath. Encloded Covered Patio builtin to roof line and potential living area.
Key facts
- Bonus room
- Updated kitchen
- Granite countertops
Tags
Property features AI
Exterior
- Parking: Attached 2-car garage with garage door opener
- Utilities: Public water; Public sewer
- Home design: Residential property; Single-story entry level
- Construction: Built in 1982; Brick and wood siding exterior; Composition roof; Slab foundation
- Exterior features: Fenced backyard; Subdivision lot setting; Back yard fence
Interior
- Kitchen: Dishwasher; Electric oven; Electric range; Garbage disposal
- Bedrooms: Primary bathroom; Three additional bedrooms on the first floor (approx. 13x10, 13x11, 17x17)
- Flooring: Carpet; Tile
- Bathrooms: Two full bathrooms
- Heating & cooling: Central heating (electric); Central air (electric)
- Interior features: Breakfast bar; Granite counters; Tub/shower; Ceiling fans; Wood-burning fireplace (1)
- Laundry & utility: Washer hookup; Electric dryer hookup; Utility room
Neighborhood map
What this means for you Summary
Snapshot
- This is a 3-bed/2.0-bath single-family listed at $208k.
Deal economics
- At list price, monthly cash flow is $-59 ($-709/yr) — negative.
- To cash-flow at today's rent, offer at most $197k (5.0% below list).
- To meet the 1% rule (rent ≥ 1% of price), the offer needs to be $178k (14.5% below list).
- Recommended offer: $178k (14.5% below list) — sets the bar for 1% rule.
- Cap rate 6.0% vs local median 3.1% in Conroe — top-decile yield for the area; either an underpriced asset or a hidden risk that comps aren't pricing in. Stress-test before assuming the spread holds.
Location & tenants
- Location reads 74/100 on livability (#169 in TX, #4,447 nationally) — a middle-class / working-renter tenant base. Strengths: cost of living A+, housing A+, amenities B; Watch: commute F, health & safety F.
- Conroe ISD (other): math 57% / reading 57% proficiency, ranked #69 of 826 in TX (top 8%) — acceptable for families but not a draw, mixed tenant base, ~2y average lease.
- Zoned schools: Conroe H S (math 32% / reading 51%, grade F, #767 of 1,632 statewide, top 47%, 4,915 students, 61% FRL) — zoned schools average 61% FRL vs 34% district-wide (27 pts higher); higher-poverty schools than district average — tighter screening recommended.
- Zoned-school proficiency averages 42% at this address vs 57% district-wide (-16 pts) — the specific schools serving this property underperform the Conroe ISD average; the district grade overstates school quality for this exact location.
- Market conditions: Rents rising (+1.4%/yr); 486 active listings in the ZIP; 14 comparable units currently listed for rent nearby; rentals at typical pace (median 15d on market — plan ~3-4 weeks tenant-placement turnaround); 13,259 units permitted in Montgomery County in 2024 (1,402 in 5+ unit buildings).
- This rent runs 32% of the median local income ($66k/yr) — at the standard rent-burdened threshold; future hikes will face affordability resistance.
Forward outlook
- Local home prices are declining (-3.0%/yr); year-one equity from $1k of loan paydown is wiped out by about $6k of value loss. Plan a longer hold.
- Montgomery County population projected at +65% by 2050 — long-run rental-demand tailwind backs the buy-and-hold thesis.
Negotiation context
- Only 8 days on market — expect competitive offers; lowballing is unlikely to land.
- 2 sale attempts since 14y ago with the ask held roughly flat each time — persistent listings suggest the price (not the market) is what's stuck; bring a comps-based counter.
Risks & watch-outs
- Climate carrying-cost: severe wind risk, 99% chance of damaging wind over 30y; extreme-heat days projected 7→25/yr by 2055 (HVAC capex compounding) — expect insurance premiums to compound above CPI over the hold.
Questions for the listing agent
- What do current leases actually rent for vs. the listed asking? Can we see a recent rent roll and the last 12 months of T-12 income?
- Is there a deadline driving the sale (1031 exchange, divorce, estate, relocation)? That informs how much negotiation room exists.
- Schools are D-rated, which usually means shorter tenancies and higher turnover. Who's the typical renter profile here, and what's been the actual vacancy rate?
- The area grade is low — what's the realistic commute time and amenity access for the typical tenant pool here? Any planned neighborhood developments (good or bad) we should know about?
- What's the average days-on-market for RENTAL listings here right now (not sales)? A rising rental-DOM trend means longer vacancies and softer asking-rent achievability than the comps imply.
- What's the recent tenant-quality profile in this submarket — average credit score on applications, eviction rate, late-payment / NSF rate, and stable-employment percentage? A property-management company in the area should have these aggregated.
- How much new for-sale + rental construction is in the pipeline within 1–3 miles? Heavy new supply typically softens prices + rents 12–24 months out; constrained supply supports both.
Investment metrics
- 1% rule
- 0.85% ✗
- Cap rate
- 5.95%
- Cash-on-cash
- -1.22%
- DSCR
- 0.95
- GRM
- 9.7
CMA / ARV
- ARV (on-the-fly)
- $230,728
- Comps found
- 12
Show comp detail 12 sales within ~0.75 mi
| Address | Dist | Beds/Ba | Sqft | Sold | Price | $/sf | Match |
|---|---|---|---|---|---|---|---|
| 1712 Lindy Ln | 0.05mi | 3/2.0 | 1,452 (-5%) | 4mo | $185,000 | $127 | 86 |
| 1701 Rebecca Ln | 0.06mi | 3/2.0 | 1,401 (-8%) | 1mo | $199,000 | $142 | 82 |
| 1621 Cantrell Blvd | 0.17mi | 4/2.0 (+1) | 1,658 (+8%) | 3mo | $249,900 | $151 | 70 |
| 123 West Canopy Crossing Cir | 0.50mi | 3/2.0 | 1,459 (-4%) | 2mo | $229,990 | $158 | 68 |
| 1722 Rebecca Ln | 0.14mi | 3/2.0 | 1,303 (-15%) | 3mo | $175,000 | $134 | 67 |
| 1614 Juniper Knoll Way | 0.64mi | 3/2.0 | 1,556 (+2%) | 0mo | $225,000 | $145 | 67 |
| 115 West Canopy Crossing Cir | 0.51mi | 4/2.0 (+1) | 1,590 (+4%) | 2mo | $239,990 | $151 | 63 |
| 1707 Hickory Burl Ln | 0.67mi | 3/2.0 | 1,468 (-4%) | 1mo | $195,000 | $133 | 61 |
| 1324 Clear Cedar Ct | 0.46mi | 3/2.0 | 1,373 (-10%) | 3mo | $312,990 | $228 | 59 |
| 1878 Brushy Cedar Dr | 0.63mi | 4/2.0 (+1) | 1,484 (-3%) | 2mo | $229,990 | $155 | 59 |
| 1409 Natural Pine Trl | 0.36mi | 4/2.0 (+1) | 1,320 (-14%) | 3mo | $205,000 | $155 | 53 |
| 1620 Hickory Burl Ln | 0.70mi | 3/2.0 | 1,658 (+8%) | 0mo | $259,900 | $157 | 53 |
Match score weights: distance 35% · size 25% · config 20% · recency 20%. Top-matched comps best support the ARV.
Projected returns pro-forma
-3.0% appreciation · 1.43% rent growth · sell at horizon
- IRR
- -20.1%
- Equity multiple
- 0.31×
- Total profit
- $-40,156
- Equity at exit
- $30,984
- IRR
- -16.9%
- Equity multiple
- 0.13×
- Total profit
- $-50,625
- Equity at exit
- $17,967
Cash invested: $58,184 (down + closing). Projections, not guarantees.
Landlord ↔ Tenant lean methodology
- Overall (STATE)
- 87 Strongly Landlord-Friendly
- State Texas
- 87 Strongly Landlord-Friendly · R+5
- County
- — inherits STATE
- City
- — inherits STATE
ZIP-level market 77301
- Home prices YoY
- -8.4%
- Rents YoY
- 1.4%
- Active inventory
- 486
- Price-to-rent
- 9.7×
Monthly cashflow live
- Estimated rent
- $1,776 high interval (Pro) →
- Mortgage (P&I)
- −$1,090
- Tax from tax record
- −$286 /mo · $3,433/yr
- Insurance
- −$87
- HOA
- −$0
- Vacancy / Maint / Mgmt
- −$373
- Net cashflow
- $-59
Break-even live
UW: 25.0% down · 7.5% · 30yr · 1.5% tax · 5.0% vac · 8.0% maint · 8.0% mgmt
Financing live
Cash to close
- Down payment
- $51,950
- Closing costs
- $6,234
- Reserves months
- —
- Total cash needed
- —
Loan-product check · same deal, 3 products live
Conventional
25% down · 7.5% · 30yr
- Down + closing
- —
- Monthly P&I
- —
- Monthly cashflow
- —
- DSCR
- —
- Eligible?
- —
Personal DTI + credit; lowest rate.
DSCR
20% down · 8.5% · 30yr
- Down + closing
- —
- Monthly P&I
- —
- Monthly cashflow
- —
- DSCR
- —
- Eligible?
- —
No personal income docs; deal must DSCR.
Hard money
10% down · 12.0% · 12mo
- Down + closing
- —
- Monthly P&I
- —
- Monthly cashflow
- —
- DSCR
- —
- Eligible?
- —
Short-term bridge; refi at stabilization.
Rent comps 14 comps
| Address | Beds | Baths | Sqft | Rent | $/sqft | DOM | Units | Dist |
|---|---|---|---|---|---|---|---|---|
| 1723 Hazelwood St Conroe, TX | 2.0 | 2.0 | 1200 | $1,500 | $1.25 | 43d | 1 | 0.19mi |
| 1442 Natural Pine Trl Conroe, TX | 4.0 | 2.5 | 1848 | $1,656 | $0.90 | 13d | 1 | 0.54mi |
| 1702 Campos Ct Conroe, TX | 4.0 | 2.5 | 2220 | $2,050 | $0.92 | 43d | 1 | 0.69mi |
| 727 Long Cedar Dr Conroe, TX | 3.0 | 2.0 | 1340 | $1,650 | $1.23 | 12d | 1 | 0.72mi |
| 719 Long Cedar Dr Conroe, TX | 4.0 | 2.0 | 1459 | $1,595 | $1.09 | 43d | 1 | 0.72mi |
| 1307 Vincente Ct Conroe, TX | 4.0 | 3.0 | 1860 | $2,300 | $1.24 | 43d | 1 | 0.91mi |
| 3006 Twisted Myrtle Dr Conroe, TX | 3.0 | 2.0 | 1311 | $1,759 | $1.34 | 15d | 1 | 1.11mi |
| 800 N FM 3083 Rd W Conroe, TX | 1.0–2.0 | 1.0–2.0 | 913 | $1,600 | $1.75 | 1d | 16 | 1.22mi |
| 2617 Castille Valley Pl Conroe, TX | 4.0 | 2.0 | 1683 | $1,800 | $1.07 | 2d | 1 | 1.24mi |
| 1530 San Sebastien Dr Conroe, TX | 4.0 | 3.0 | 1845 | $1,900 | $1.03 | 21d | 1 | 1.29mi |
| 1558 San Sebastien Dr Conroe, TX | 4.0 | 2.0 | 1683 | $1,750 | $1.04 | 2d | 1 | 1.34mi |
| 511 N 3rd St Conroe, TX | 3.0 | 1.0 | 1100 | $1,695 | $1.54 | 3d | 1 | 1.39mi |
| 817 Lovebug Ln Conroe, TX | 3.0 | 2.0 | 1276 | $1,595 | $1.25 | 12d | 1 | 1.41mi |
| 805 Belvedere Dr Conroe, TX | 4.0 | 2.0 | 1577 | $1,624 | $1.03 | 20d | 1 | 1.48mi |
Listing history 6 events
-
2026-06-18days on market $207,800 Active 8 DOM
-
2026-06-17days on market $207,800 Active 7 DOM
-
2026-06-16days on market $207,800 Active 6 DOM
-
2026-06-15days on market $207,800 Active 5 DOM
-
2026-06-13remarks 667-char remark
-
2026-06-13$207,800 Active 3 DOM
ⓘ Source: listings_history table (triggers on properties + properties_extension) + one-shot
backfill from property_details.listing_events for pre-trigger history.
Tax reassessment forecast TX · Resets to sale price
- Current annual tax
- $3,433 · $286/mo
- Projected year-2 tax
- $3,803 · $317/mo
- Expected delta
- +$370/yr (+$31/mo · 10.8%)
ⓘ Screening estimate from a state-policy table — verify with the county assessor before closing.
Climate risk First Street
- Flood 1/10 Low FEMA zone X (unshaded) · 0% chance over 30 yrs
- Wildfire 3/10 Moderate
- Heat 9/10 Extreme 7 d/yr ≥111°F today · 25 d/yr by 30 yrs out
- Wind 8/10 Severe 99% chance of damaging wind over 30 yrs
- Air quality 2/10 Low 2 unhealthy d/yr today · 2 by 30 yrs out
Nearby sold comps map
Loading sold comps map…
Walkable amenities ~0.75 mi
Loading nearby amenities…
Taxation est. · year 1
- Rental income
- $21,316
- − Mortgage interest
- −$11,640
- − Property taxes
- −$3,433
- − Insurance
- −$1,039
- − Repairs & maintenance
- −$1,705
- − Management
- −$1,705
- − Depreciation
- −$6,045
- Taxable loss
- −$4,252
- Est. tax savings @ 24.0%
- +$1,020
- After-tax cash flow
- $311/yr
For passive investors: Depreciation is non-cash, so a rental often shows a tax loss while cash-flowing — sheltering income. Rental losses are passive: they offset passive income freely, and up to $25,000/yr can offset ordinary (W-2) income if you actively participate and your MAGI is under $100k (phasing out to $0 by $150k); unused losses carry forward. On sale, claimed depreciation is recaptured at up to 25%, and gains may owe capital-gains tax (a 1031 exchange can defer both). Figures are a year-1 estimate at your 24.0% rate — not tax advice; consult a CPA.
Schools (NCES district)
- District
- Conroe ISD
- NCES district ID
- 4815000
- Math proficiency
- 57% ▼ -6.00%
- Reading proficiency
- 57% ▼ -1.00%
- Median HH income
- $71,541
- Composite
- 50.65/100
- National rank
- #1833
- State rank
- #69 of 826 in TX
Livability — Conroe
- Score
- 74/100
- State rank
- #169
- US rank
- #4447
Category grades
Schools grade is shown separately in the Schools card above.
Census & demographics
- Census place
- Conroe, TX
- County
- Montgomery County · 663,713 people
- City population
- 205,417
- Metro
- Houston-The Woodlands-Sugar Land, TX
- Population (ZIP)
- 37,769
- Household income
- $66,475
- Rent vs Own
- Severe rent burden
- 1256.0
Population outlook (Montgomery County) Hauer SSP2
- Today (2025)
- 713,896 people
- By 2030
- 805,263 · +12.8%
- By 2040
- 992,708 · +39.1%
- By 2050
- 1,179,590 · +65.2%
- By 2075
- 1,628,084 · +128.1%
- By 2100
- 1,937,880 · +171.5%
Race, ethnicity, and origin ACS 2023
- Neighborhood character
- Diverse neighborhood (Simpson 0.62)
- Race & ethnicity
- Hispanic / Latino 52% White 31% Two or more races 19% Black 13% Asian 2% Native American 2%
- Hispanic origin (detail)
- Mexican 37%
- Common ancestry
- Lithuanian 2% Slovak 1% Romanian 1%
- Foreign-born
- 27% · Canada, Jamaica
- Languages at home
- 51% English-only · Spanish 45% Other Asian/Pacific 2%
Political lean MEDSL · Montgomery
- 2024 margin
- Solid R (+45.5) · D 26.8% · R 72.3%
- 2008→2024 swing
- +7.2pp toward D · 2008: -52.7pp · 2024: -45.5pp
- All cycles
- 2024: R+45.5 2020: R+43.8 2016: R+51.4 2012: R+60.7 2008: R+52.7
Not yet ingested
- Civics
- —
Market trends
- HPI YoY
- ▼ -25.51%
- Current HPI
- 278.6662
- Rent YoY
- ▲ 1.43%
- Metro
- Houston-The Woodlands-Sugar Land, TX
- State GDP YoY
- ▲ 3.95%
- F500 in state
- 110
Industry mix (Fortune 500 HQ in TX)
| Industry | F500 HQs | Revenue |
|---|---|---|
| Energy | 16 | $1,198B |
|
||
| Technology | 5 | $198B |
|
||
| Engineering / Construction | 4 | $72B |
|
||
| Energy Services | 3 | $60B |
|
||
| Utilities | 3 | $41B |
|
||
| Healthcare | 2 | $330B |
|
||
Price history
+136.4% since first listed5 events — show timeline
- 2026-06-10 Listed $207,800 HARMLS
- 2012-10-05 Sold (Public Records) — Public Records
- 2012-10-05 Sold (MLS) — HARMLS
- 2012-08-22 Listing Removed — HARMLS
- 2012-07-29 Listed $87,900 HARMLS
Property tax history
+2.1%/yrLatest (2025): $3,433 · -11.5% YoY. Source: county tax records.
Cash-flow waterfall
monthlySold comps — $/sqft
last 12 mo · ≤1 miLoading sold comps…