445 N Capitol Ave #430 · San Jose, CA
Flood risk 1/10 · Minimal
- FEMA flood zone
- X (unshaded)
- Chance of flooding over 30 yrs
- 0.0%
- Est. flood insurance / yr
- $507 – $1,088
Fire risk 1/10 · Minimal
- Est. fire insurance / yr
- $659 – $1,223
Heat risk 5/10 · Moderate
- Hot days now (above 94°F)
- 8 days/yr
- Hot days in 30 yrs
- 15 days/yr
Wind risk 1/10 · Minimal
- Chance of severe wind over 30 yrs
- —
Air-quality risk 10/10 · Severe
- Unhealthy air days now
- 22 days/yr
- Unhealthy air days in 30 yrs
- 23 days/yr
Risk factors via First Street. Map © Google.
Why this score? — see what drove the C- grade
The composite is a weighted blend of 9 inputs, each scored 0–100. Each bar is that input's sub-score; the figure is the points it added to the 100-point composite (weight × sub-score).
- Cash flow +22.1/30.0
- DSCR +7.1/10.0
- 1% rule +5.8/10.0
- Schools +5.5/10.0
- Condition / age +4.0/5.0
- Livability +3.9/5.0
- Rent growth +3.6/5.0
- ARV discount +0.0/15.0
- Appreciation +0.0/10.0
$399,900
🖨 Deal sheet 📄 Offer letter ✓ Due diligence
Listing remarks MLS
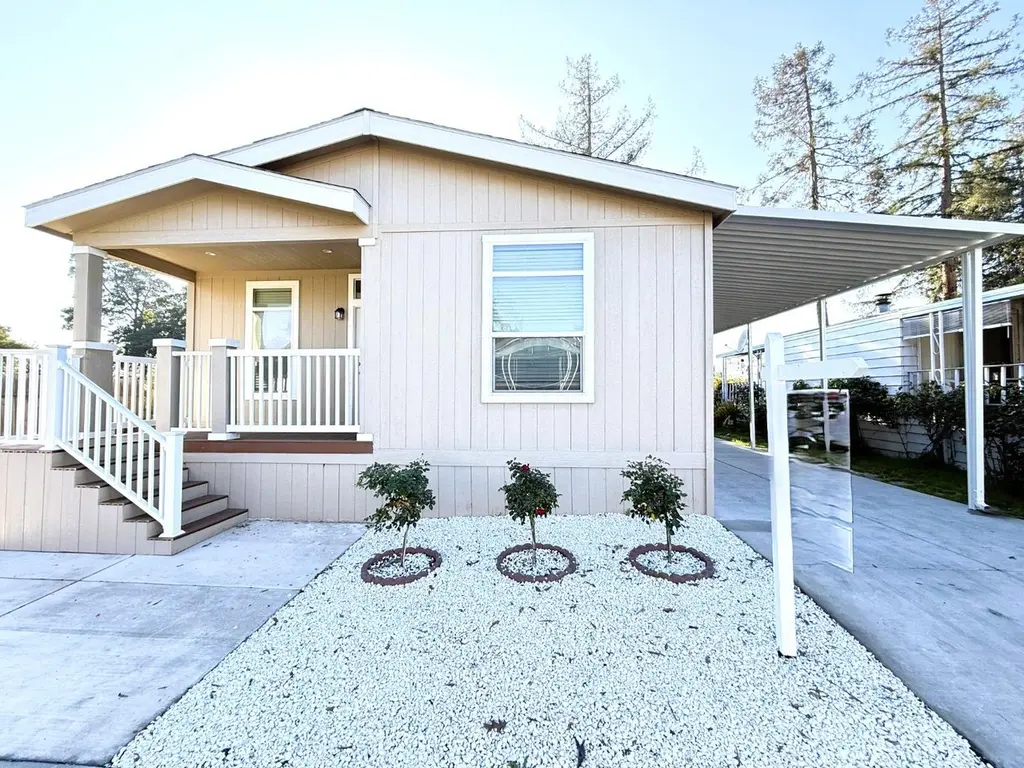
Explore this stunning 2025 home located in the Community of La Buona Vita. A corner lot home, approximately 1,508 square feet, it features 3 bedrooms and 2 bathrooms. Upon entering, youll find a ceiling fan with lights and elegant laminate flooring. The kitchen boasts an island, stove, oven, refrigerator, cabinets, garbage disposal, correon countertops and ceiling lights, making it a perfect space for cooking and entertaining. The spacious master bedroom is carpeted, walk in closet, complete with ceiling lights and a fan. The guest bedrooms are also carpeted. The master bathroom features double sinks, laminate flooring, a glass sliding door, and additional cabinets. The guest bathroom is equipped with ceiling lights, cabinets, a tub and a shower. Double Pane Windows and central heat included. The backyard is generously sized, ideal for a BBQ area, and includes one shed. Don't miss out-Stop by today!
Key facts
- Corner lot home
- Kitchen island
- Correon countertops
Tags
Neighborhood map
What this means for you Summary
Snapshot
- This is a 3-bed/2.0-bath manufactured listed at $400k. Condition is rated good.
Deal economics
- At list price, monthly cash flow is $641 ($8k/yr) — positive.
- The deal already cash-flows at list — no discount required.
- Meets the 1% rule at list price ($4k rent vs $400k).
- Recommended offer: $352k (12.0% below list) — sets the bar for market timing.
- Cap rate 8.2% vs local median 1.6% in San Jose — top-decile yield for the area; either an underpriced asset or a hidden risk that comps aren't pricing in. Stress-test before assuming the spread holds.
Location & tenants
- Location reads 78/100 on livability (#68 in CA, #2,559 nationally) — a middle-class / working-renter tenant base. Strengths: amenities A+, commute A+, employment A+; Watch: crime F, cost of living F.
- East Side Union High (urban): math 53% / reading 70% proficiency, ranked #69 of 517 in CA (top 13%) — acceptable for families but not a draw, mixed tenant base, ~2y average lease.
- Market conditions: Rents rising fast (+4.4%/yr); 51 active listings in the ZIP; 15 comparable units currently listed for rent nearby; rentals leasing fast (median 2d on market — plan ~1-2 weeks tenant-placement turnaround); high-income renter base; 3,838 units permitted in Santa Clara County in 2024 (1,886 in 5+ unit buildings).
- This rent runs 36% of the median local income ($142k/yr) — at the standard rent-burdened threshold; future hikes will face affordability resistance.
Forward outlook
- Local home prices are declining (-3.0%/yr); year-one equity from $3k of loan paydown is wiped out by about $12k of value loss. Plan a longer hold.
- Santa Clara County population projected at +24% by 2050 — long-run rental-demand tailwind backs the buy-and-hold thesis.
Negotiation context
- It's been on market 183 days — a 12% lower offer ($352k) is reasonable based on typical stale-listing flexibility.
- 2 sale attempts with the ask held roughly flat each time — persistent listings suggest the price (not the market) is what's stuck; bring a comps-based counter.
Risks & watch-outs
- Climate carrying-cost: extreme-heat days projected 8→15/yr by 2055 (HVAC capex compounding) — expect insurance premiums to compound above CPI over the hold.
Questions for the listing agent
- It's been on market 183 days. Have you received any prior offers? Is the seller open to a 12% concession, seller financing, or rate buy-down credit?
- Why hasn't it sold? Are there any deal-killer items the seller is aware of (foundation, flood, title, zoning, code violations)?
- Is there a deadline driving the sale (1031 exchange, divorce, estate, relocation)? That informs how much negotiation room exists.
- Crime grade is F in this area — have there been break-ins, vandalism, or insurance claims at this property in the last 3 years? What carrier currently insures it and at what premium?
- What's the average days-on-market for RENTAL listings here right now (not sales)? A rising rental-DOM trend means longer vacancies and softer asking-rent achievability than the comps imply.
- What's the recent tenant-quality profile in this submarket — average credit score on applications, eviction rate, late-payment / NSF rate, and stable-employment percentage? A property-management company in the area should have these aggregated.
- How much new for-sale + rental construction is in the pipeline within 1–3 miles? Heavy new supply typically softens prices + rents 12–24 months out; constrained supply supports both.
Investment metrics
- 1% rule
- 1.08% ✓
- Cap rate
- 8.21%
- Cash-on-cash
- 6.86%
- DSCR
- 1.31
- GRM
- 7.7
CMA / ARV
- ARV (median comp)
- $280,785
- List price
- $399,900
- Delta
- 42.42%
- Verdict
- OVERPRICED
- Comps
- 3 within 1.0 mi
Show comp detail 5 sales within ~0.75 mi
| Address | Dist | Beds/Ba | Sqft | Sold | Price | $/sf | Match |
|---|---|---|---|---|---|---|---|
| 409 GIANNOTTA Way Unit , | 0.06mi | 3/2.0 | 1,440 (-4%) | 6mo | $415,000 | $288 | 85 |
| 440 Giannotta Way #440 | 0.06mi | 3/2.0 | 1,440 (-4%) | 13mo | $300,000 | $208 | 79 |
| 401 Giannotta Way Unit . | 0.04mi | 2/2.0 (-1) | 1,440 (-4%) | 10mo | $275,000 | $191 | 78 |
| 445 Giannotta #445 | 0.04mi | 3/2.0 | 1,344 (-11%) | 9mo | $285,000 | $212 | 73 |
| 442 Giannotta Way #442 | 0.05mi | 2/2.0 (-1) | 1,344 (-11%) | 18mo | $240,000 | $179 | 59 |
Match score weights: distance 35% · size 25% · config 20% · recency 20%. Top-matched comps best support the ARV.
Projected returns pro-forma
-3.0% appreciation · 4.4% rent growth · sell at horizon
- IRR
- -4.2%
- Equity multiple
- 0.84×
- Total profit
- $-17,787
- Equity at exit
- $59,626
- IRR
- 7.1%
- Equity multiple
- 1.57×
- Total profit
- $63,291
- Equity at exit
- $34,576
Cash invested: $111,972 (down + closing). Projections, not guarantees.
Landlord ↔ Tenant lean methodology
- Overall (CITY)
- 0 Strongly Tenant-Friendly
- State California
- 18 Strongly Tenant-Friendly · D+13
- County
- — inherits STATE
- City San Jose
- 0 Strongly Tenant-Friendly · D+24
ZIP-level market 95133
- Rents YoY
- 4.4%
- Active inventory
- 51
- Price-to-rent
- 7.7×
Monthly cashflow live
- Estimated rent
- $4,309 high interval (Pro) →
- Mortgage (P&I)
- −$2,097
- Tax est. 1.5%
- −$500 /mo · $5,998/yr
- Insurance
- −$167
- HOA
- −$0
- Vacancy / Maint / Mgmt
- −$905
- Net cashflow
- $641
Break-even live
UW: 25.0% down · 7.5% · 30yr · 1.5% tax · 5.0% vac · 8.0% maint · 8.0% mgmt
Financing live
Cash to close
- Down payment
- $99,975
- Closing costs
- $11,997
- Reserves months
- —
- Total cash needed
- —
Loan-product check · same deal, 3 products live
Conventional
25% down · 7.5% · 30yr
- Down + closing
- —
- Monthly P&I
- —
- Monthly cashflow
- —
- DSCR
- —
- Eligible?
- —
Personal DTI + credit; lowest rate.
DSCR
20% down · 8.5% · 30yr
- Down + closing
- —
- Monthly P&I
- —
- Monthly cashflow
- —
- DSCR
- —
- Eligible?
- —
No personal income docs; deal must DSCR.
Hard money
10% down · 12.0% · 12mo
- Down + closing
- —
- Monthly P&I
- —
- Monthly cashflow
- —
- DSCR
- —
- Eligible?
- —
Short-term bridge; refi at stabilization.
Rent comps 15 comps
| Address | Beds | Baths | Sqft | Rent | $/sqft | DOM | Units | Dist |
|---|---|---|---|---|---|---|---|---|
| 586 Jayne Ct San Jose, CA | 4.0 | 2.5 | 1720 | $4,500 | $2.62 | 1d | 1 | 0.09mi |
| 586 Jayne Ct San Jose, CA | 4.0 | 2.5 | 1720 | $4,651 | $2.70 | 10d | 1 | 0.09mi |
| 2583 Gimelli Way #74 San Jose, CA | 3.0 | 2.0 | 1103 | $3,500 | $3.17 | 16d | 1 | 0.18mi |
| 2726 Mabury Sq San Jose, CA | 3.0 | 2.0 | 1290 | $3,880 | $3.01 | 2d | 1 | 0.55mi |
| 327 Hans Way San Jose, CA | 3.0 | 2.5 | 1404 | $3,800 | $2.71 | 2d | 1 | 0.56mi |
| 828 N Jackson Ave San Jose, CA | 4.0 | 3.0 | 1596 | $4,500 | $2.82 | 2d | 1 | 0.75mi |
| 292 Grecia Ct San Jose, CA | 3.0 | 1.5 | 1180 | $3,200 | $2.71 | 1d | 1 | 0.87mi |
| 49 Muirfield Ct San Jose, CA | 2.0 | 1.5 | 1054 | $2,998 | $2.84 | 1d | 1 | 1.03mi |
| 2073 Kiwi Walkway #1673 San Jose, CA | 2.0 | 2.5 | 1300 | $3,470 | $2.67 | 1d | 1 | 1.10mi |
| 2070 Vincenzo Walkway San Jose, CA | 4.0 | 4.0 | 1722 | $4,924 | $2.86 | 10d | 1 | 1.12mi |
| 1105 Pepper Rd San Jose, CA | 3.0 | 3.0 | 1489 | $4,400 | $2.96 | 1d | 1 | 1.13mi |
| 3410 Pepper Tree Ln San Jose, CA | 3.0 | 1.5 | 1088 | $12,800 | $11.76 | 1d | 1 | 1.21mi |
| 2601 Nuestra Castillo Ct San Jose, CA | 2.0–3.0 | 1.0–2.0 | 1154 | $3,960 | $3.43 | 1d | 1 | 1.30mi |
| 1621 Pala Ranch Cir San Jose, CA | 4.0 | 2.5 | 2210 | $4,800 | $2.17 | 1d | 1 | 1.42mi |
| 152 N 34th St San Jose, CA | 3.0 | 2.0 | 1500 | $3,800 | $2.53 | 43d | 1 | 1.43mi |
Listing history 16 events
-
2026-06-18days on market $399,900 Active 183 DOM
-
2026-06-17days on market $399,900 Active 182 DOM
-
2026-06-16days on market $399,900 Active 181 DOM
-
2026-06-15days on market $399,900 Active 180 DOM
-
2026-06-13days on market $399,900 Active 178 DOM
-
2026-06-13days on market $399,900 Active 177 DOM
-
2026-06-09days on market $399,900 Active 174 DOM
-
2026-06-08days on market $399,900 Active 173 DOM
-
2026-06-07days on market $399,900 Active 172 DOM
-
2026-06-05days on market $399,900 Active 169 DOM
-
2026-06-03days on market $399,900 Active 168 DOM
-
2026-06-02days on market $399,900 Active 167 DOM
-
2026-06-01days on market $399,900 Active 166 DOM
-
2026-05-31days on market $399,900 Active 165 DOM
-
2025-12-17$409,900 Active 912-char remark
Show marketing remark (912 chars)
Explore this stunning 2025 home located in the Community of La Buona Vita. A corner lot home, approximately 1,508 square feet, it features 3 bedrooms and 2 bathrooms. Upon entering, youll find a ceiling fan with lights and elegant laminate flooring. The kitchen boasts an island, stove, oven, refrigerator, cabinets, garbage disposal, correon countertops and ceiling lights, making it a perfect space for cooking and entertaining. The spacious master bedroom is carpeted, walk in closet, complete with ceiling lights and a fan. The guest bedrooms are also carpeted. The master bathroom features double sinks, laminate flooring, a glass sliding door, and additional cabinets. The guest bathroom is equipped with ceiling lights, cabinets, a tub and a shower. Double Pane Windows and central heat included. The backyard is generously sized, ideal for a BBQ area, and includes one shed. Don't miss out-Stop by today!
ⓘ Source: listings_history table (triggers on properties + properties_extension) + one-shot
backfill from property_details.listing_events for pre-trigger history.
Climate risk First Street
- Flood 1/10 Low FEMA zone X (unshaded) · 0% chance over 30 yrs
- Wildfire 1/10 Low
- Heat 5/10 Major 8 d/yr ≥94°F today · 15 d/yr by 30 yrs out
- Wind 1/10 Low
- Air quality 10/10 Extreme 22 unhealthy d/yr today · 23 by 30 yrs out
Nearby sold comps map
Loading sold comps map…
Walkable amenities ~0.75 mi
Loading nearby amenities…
Taxation est. · year 1
- Rental income
- $51,708
- − Mortgage interest
- −$22,401
- − Property taxes
- −$5,998
- − Insurance
- −$2,000
- − Repairs & maintenance
- −$4,137
- − Management
- −$4,137
- − Depreciation
- −$11,633
- Taxable income
- $1,403
- Est. tax owed @ 24.0%
- −$337
- After-tax cash flow
- $7,349/yr
For passive investors: Depreciation is non-cash, so a rental often shows a tax loss while cash-flowing — sheltering income. Rental losses are passive: they offset passive income freely, and up to $25,000/yr can offset ordinary (W-2) income if you actively participate and your MAGI is under $100k (phasing out to $0 by $150k); unused losses carry forward. On sale, claimed depreciation is recaptured at up to 25%, and gains may owe capital-gains tax (a 1031 exchange can defer both). Figures are a year-1 estimate at your 24.0% rate — not tax advice; consult a CPA.
Condition & rehab AI · 12 photos
This home is in excellent condition with modern finishes and a well-maintained exterior. It is ready for immediate occupancy and would benefit from minor updates to enhance curb appeal and modernize the interior.
Value-add opportunities
- Both Painting exterior siding — Enhances curb appeal and value
- Both Landscaping improvements — Enhances curb appeal and value
- Both Replace ceiling fans with modern fixtures — Modernizes the space and adds value
Renovation cost estimate screening
Value-add ROI direction
- Both Painting exterior siding — Enhances curb appeal and value ↑
- Both Landscaping improvements — Enhances curb appeal and value ↑
- Both Replace ceiling fans with modern fixtures — Modernizes the space and adds value ↑
ⓘ Cost ranges are severity-bucket heuristics (US national rule-of-thumb). Get contractor quotes + a written scope before underwriting a rehab budget.
Schools (NCES district)
- District
- East Side Union High
- NCES district ID
- 0611820
- Math proficiency
- 53% ▲ 12.00%
- Reading proficiency
- 70% ▲ 8.00%
- Median HH income
- $80,293
- Composite
- 55.15/100
- National rank
- #1278
- State rank
- #69 of 517 in CA
Livability — San Jose
- Score
- 78/100
- State rank
- #68
- US rank
- #2559
Category grades
Schools grade is shown separately in the Schools card above.
Census & demographics
- Census place
- San Jose, CA
- County
- Santa Clara County · 1,806,974 people
- City population
- 954,479
- Metro
- San Jose-Sunnyvale-Santa Clara, CA
- Population (ZIP)
- 29,710
- Household income
- $142,170
- Rent vs Own
- Severe rent burden
- 859.0
Population outlook (Santa Clara County) Hauer SSP2
- Today (2025)
- 2,179,074 people
- By 2030
- 2,301,297 · +5.6%
- By 2040
- 2,528,195 · +16.0%
- By 2050
- 2,712,135 · +24.5%
- By 2075
- 2,998,701 · +37.6%
- By 2100
- 2,931,429 · +34.5%
Race, ethnicity, and origin ACS 2023
- Neighborhood character
- Diverse neighborhood (Simpson 0.56)
- Race & ethnicity
- Asian 61% Hispanic / Latino 24% Two or more races 9% White 8% Black 2%
- Hispanic origin (detail)
- Mexican 17%
- Common ancestry
- Russian 2% Scotch-Irish 1%
- Foreign-born
- 56% · Vietnam, Canada, China
- Languages at home
- 28% English-only · Spanish 18% Vietnamese 17% Chinese 15%
Political lean MEDSL · Santa Clara
- 2024 margin
- Solid D (+40.0) · D 68.1% · R 28.1% · Other 3.8%
- 2008→2024 swing
- -0.9pp no change · 2008: 40.9pp · 2024: 40.0pp
- All cycles
- 2024: D+40.0 2020: D+47.4 2016: D+52.5 2012: D+42.1 2008: D+40.9
Not yet ingested
- Civics
- —
Market trends
- HPI YoY
- ▼ -1026.89%
- Current HPI
- 298.019
- Rent YoY
- ▲ 4.40%
- Metro
- San Jose-Sunnyvale-Santa Clara, CA
- State GDP YoY
- ▲ 3.21%
- F500 in state
- 116
Industry mix (Fortune 500 HQ in CA)
| Industry | F500 HQs | Revenue |
|---|---|---|
| Technology | 27 | $1,492B |
|
||
| Financial Services | 3 | $174B |
|
||
| Retail | 3 | $44B |
|
||
| Insurance | 3 | $26B |
|
||
| Media / Entertainment | 2 | $115B |
|
||
| Pharmaceuticals / Biotech | 2 | $62B |
|
||
Price history
+0.0% since first listed2 events — show timeline
- 2025-12-17 Listed $409,900 MLSListings
- 2025-12-17 Listed $409,900 bridgeMLS, Bay East AOR, or Contra Costa AOR
Cash-flow waterfall
monthlySold comps — $/sqft
last 12 mo · ≤1 miLoading sold comps…