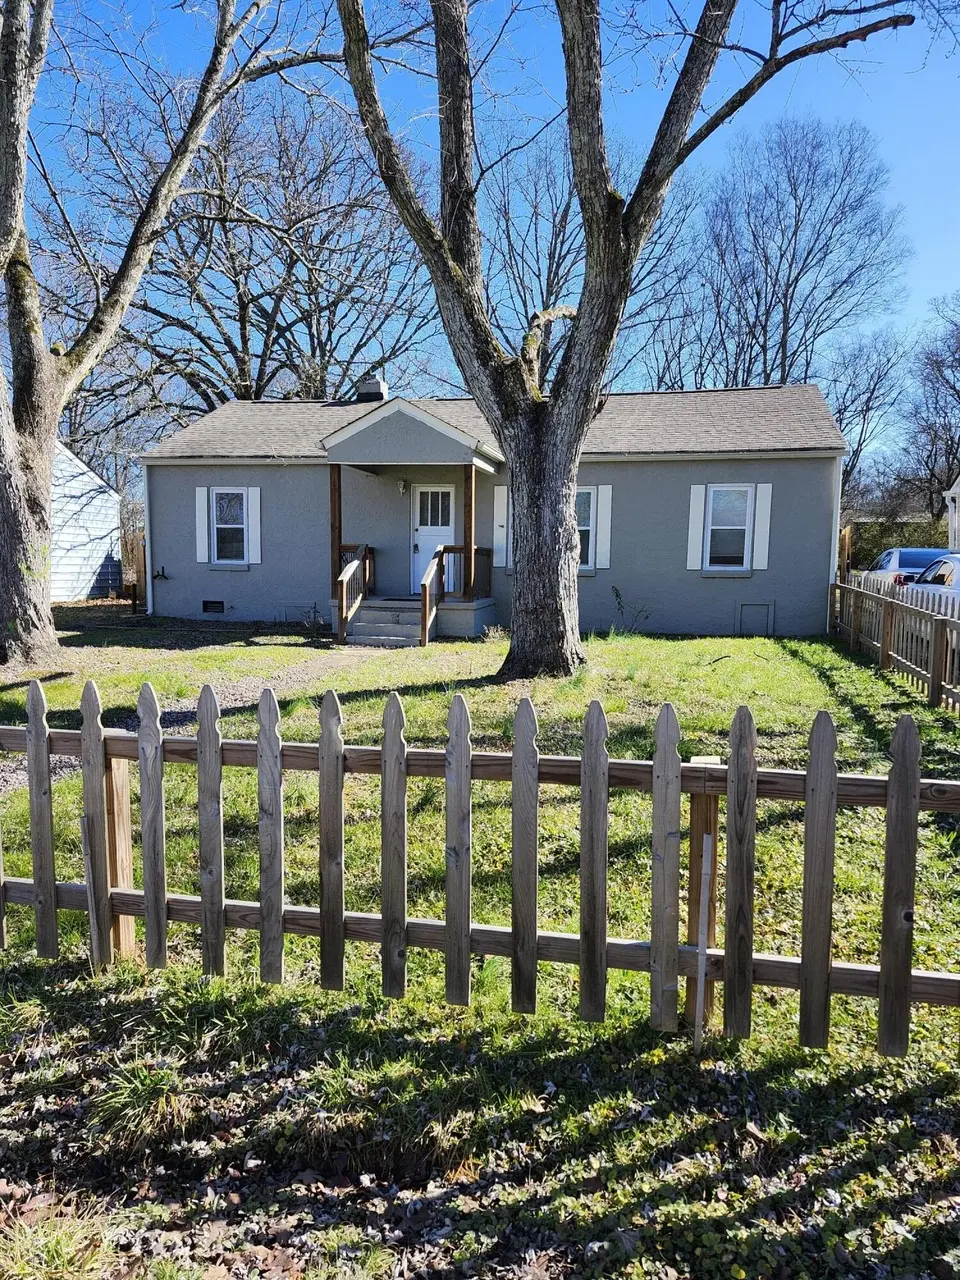
83 Everglades Blvd · East Ridge, TN
Flood risk 1/10 · Minimal
- FEMA flood zone
- X (unshaded)
- Chance of flooding over 30 yrs
- 0.0%
- Est. flood insurance / yr
- $507 – $1,088
Fire risk 1/10 · Minimal
- Est. fire insurance / yr
- $963 – $1,789
Heat risk 6/10 · Moderate
- Hot days now (above 105°F)
- 7 days/yr
- Hot days in 30 yrs
- 19 days/yr
Wind risk 4/10 · Minor
- Chance of severe wind over 30 yrs
- 11.0%
Air-quality risk 3/10 · Minor
- Unhealthy air days now
- 2 days/yr
- Unhealthy air days in 30 yrs
- 2 days/yr
Risk factors via First Street. Map © Google.
Why this score? — see what drove the C- grade
The composite is a weighted blend of 9 inputs, each scored 0–100. Each bar is that input's sub-score; the figure is the points it added to the 100-point composite (weight × sub-score).
- Cash flow +18.9/30.0
- ARV discount +10.8/15.0
- DSCR +6.0/10.0
- Rent growth +4.4/5.0
- 1% rule +4.1/10.0
- Livability +3.6/5.0
- Schools +3.3/10.0
- Condition / age +2.5/5.0
- Appreciation +0.0/10.0
$164,900
🖨 Deal sheet 📄 Offer letter ✓ Due diligence
Listing remarks MLS
PRICE REDUCED!!! Updated 3 bedroom 1 bath home in convenient location hear East Ridge. Fresh paint. Fenced level backyard. New Flooring. Large storage room. Move in Ready.
Key facts
- Fresh paint
- New flooring
- Convenient location
Tags
Neighborhood map
What this means for you Summary
Snapshot
- This is a 3-bed/1.0-bath single-family listed at $165k.
Deal economics
- At list price, monthly cash flow is $170 ($2k/yr) — positive.
- The deal already cash-flows at list — no discount required.
- To meet the 1% rule (rent ≥ 1% of price), the offer needs to be $150k (9.1% below list).
- Recommended offer: $150k (9.1% below list) — sets the bar for 1% rule.
- Cap rate 7.5% vs local median 3.8% in East Ridge — top-decile yield for the area; either an underpriced asset or a hidden risk that comps aren't pricing in. Stress-test before assuming the spread holds.
Location & tenants
- Location reads 71/100 on livability (#41 in TN) — a middle-class / working-renter tenant base. Strengths: cost of living A+, housing A+, health & safety A; Watch: amenities D+, crime D, schools F.
- Catoosa County (suburban): math 36% / reading 41% proficiency, ranked #49 of 174 in GA (top 28%) — families likely to look elsewhere, expect single-tenant / working-renter base with shorter leases.
- Market conditions: Rents rising fast (+7.4%/yr); 13 comparable units currently listed for rent nearby; rentals at typical pace (median 24d on market — plan ~3-4 weeks tenant-placement turnaround); 848 units permitted in Catoosa County in 2024 (256 in 5+ unit buildings).
- This rent runs 31% of the median local income ($59k/yr) — at the standard rent-burdened threshold; future hikes will face affordability resistance.
Forward outlook
- Local home prices are declining (-3.0%/yr); year-one equity from $1k of loan paydown is wiped out by about $5k of value loss. Plan a longer hold.
- Catoosa County population projected at +5% by 2050 — modest demand growth; plan on rents tracking national, not racing it.
- At projected returns (-3.0% appreciation + 7.4% rent growth), your $46k cash investment doubles in ~10 years — after that, you're playing with house money.
Negotiation context
- It's been on market 103 days — a 9% lower offer ($150k) is reasonable based on typical stale-listing flexibility.
- Current owner paid $25k; list at $165k implies a 560% gain — meaningful room to come down on a strong offer.
Risks & watch-outs
- Watch-outs: built in 1947 — expect roof / HVAC / electrical / plumbing capex.
- Climate carrying-cost: extreme-heat days projected 7→19/yr by 2055 (HVAC capex compounding) — expect insurance premiums to compound above CPI over the hold.
Questions for the listing agent
- It's been on market 103 days. Have you received any prior offers? Is the seller open to a 9% concession, seller financing, or rate buy-down credit?
- Built in 1947 — when were the roof, HVAC, electrical panel, plumbing, and water heater last replaced?
- Why hasn't it sold? Are there any deal-killer items the seller is aware of (foundation, flood, title, zoning, code violations)?
- Is there a deadline driving the sale (1031 exchange, divorce, estate, relocation)? That informs how much negotiation room exists.
- Schools are F-rated, which usually means shorter tenancies and higher turnover. Who's the typical renter profile here, and what's been the actual vacancy rate?
- Crime grade is D in this area — have there been break-ins, vandalism, or insurance claims at this property in the last 3 years? What carrier currently insures it and at what premium?
- What's the average days-on-market for RENTAL listings here right now (not sales)? A rising rental-DOM trend means longer vacancies and softer asking-rent achievability than the comps imply.
- What's the recent tenant-quality profile in this submarket — average credit score on applications, eviction rate, late-payment / NSF rate, and stable-employment percentage? A property-management company in the area should have these aggregated.
- How much new for-sale + rental construction is in the pipeline within 1–3 miles? Heavy new supply typically softens prices + rents 12–24 months out; constrained supply supports both.
Investment metrics
- 1% rule
- 0.91% ✗
- Cap rate
- 7.53%
- Cash-on-cash
- 4.41%
- DSCR
- 1.20
- GRM
- 9.2
CMA / ARV
- ARV (median comp)
- $178,044
- List price
- $164,900
- Delta
- -7.38%
- Verdict
- FAIR
- Comps
- 20 within 1.0 mi
Show comp detail 12 sales within ~0.75 mi
| Address | Dist | Beds/Ba | Sqft | Sold | Price | $/sf | Match |
|---|---|---|---|---|---|---|---|
| 5422 Clemons Rd | 0.68mi | 2/1.0 (-1) | 1,010 (+0%) | 2mo | $185,000 | $183 | 62 |
| 193 Biscayne Blvd | 0.13mi | 3/2.0 | 1,150 (+14%) | 7mo | $220,000 | $191 | 61 |
| 1314 Adona Ln | 0.53mi | 2/1.0 (-1) | 1,062 (+5%) | 3mo | $165,000 | $155 | 59 |
| 402 Idle Place Cir Lot 56 | 0.66mi | 2/2.0 (-1) | 1,023 (+2%) | 0mo | $300,000 | $293 | 58 |
| 6016 Welworth Ave | 0.71mi | 3/1.5 | 1,040 (+3%) | 4mo | $230,000 | $221 | 56 |
| 5603 Clemons Rd | 0.51mi | 3/1.0 | 1,142 (+13%) | 2mo | $180,000 | $158 | 52 |
| 164 Idle Place Cir Lot 80 | 0.74mi | 2/2.0 (-1) | 1,023 (+2%) | 2mo | $290,000 | $283 | 52 |
| 152 Idle Place Cir Lot 82 | 0.74mi | 2/2.0 (-1) | 958 (-5%) | 1mo | $269,900 | $282 | 48 |
| 267 Idle Place Cir | 0.66mi | 2/2.0 (-1) | 1,042 (+3%) | 10mo | $319,900 | $307 | 46 |
| 172 Idle Place Cir Lot 79 | 0.74mi | 2/2.0 (-1) | 1,086 (+8%) | 2mo | $325,000 | $299 | 42 |
| 211 Idle Place Cir | 0.70mi | 2/2.0 (-1) | 1,090 (+8%) | 6mo | $320,000 | $294 | 40 |
| 291 Idle Place Cir | 0.66mi | 2/2.0 (-1) | 1,090 (+8%) | 10mo | $329,900 | $303 | 39 |
Match score weights: distance 35% · size 25% · config 20% · recency 20%. Top-matched comps best support the ARV.
Projected returns pro-forma
-3.0% appreciation · 7.44% rent growth · sell at horizon
- IRR
- -5.0%
- Equity multiple
- 0.81×
- Total profit
- $-8,976
- Equity at exit
- $24,587
- IRR
- 8.9%
- Equity multiple
- 1.81×
- Total profit
- $37,330
- Equity at exit
- $14,258
Cash invested: $46,172 (down + closing). Projections, not guarantees.
Landlord ↔ Tenant lean methodology
- Overall (STATE)
- 87 Strongly Landlord-Friendly
- State Tennessee
- 87 Strongly Landlord-Friendly · R+13
- County
- — inherits STATE
- City
- — inherits STATE
ZIP-level market 30741
- Home prices YoY
- -30.7%
- Rents YoY
- 7.4%
- Price-to-rent
- 9.2×
Monthly cashflow live
- Estimated rent
- $1,498 high interval (Pro) →
- Mortgage (P&I)
- −$865
- Tax from tax record
- −$81 /mo · $966/yr
- Insurance
- −$69
- HOA
- −$0
- Vacancy / Maint / Mgmt
- −$315
- Net cashflow
- $170
Break-even live
UW: 25.0% down · 7.5% · 30yr · 1.5% tax · 5.0% vac · 8.0% maint · 8.0% mgmt
Financing live
Cash to close
- Down payment
- $41,225
- Closing costs
- $4,947
- Reserves months
- —
- Total cash needed
- —
Loan-product check · same deal, 3 products live
Conventional
25% down · 7.5% · 30yr
- Down + closing
- —
- Monthly P&I
- —
- Monthly cashflow
- —
- DSCR
- —
- Eligible?
- —
Personal DTI + credit; lowest rate.
DSCR
20% down · 8.5% · 30yr
- Down + closing
- —
- Monthly P&I
- —
- Monthly cashflow
- —
- DSCR
- —
- Eligible?
- —
No personal income docs; deal must DSCR.
Hard money
10% down · 12.0% · 12mo
- Down + closing
- —
- Monthly P&I
- —
- Monthly cashflow
- —
- DSCR
- —
- Eligible?
- —
Short-term bridge; refi at stabilization.
Rent comps 13 comps
| Address | Beds | Baths | Sqft | Rent | $/sqft | DOM | Units | Dist |
|---|---|---|---|---|---|---|---|---|
| 34 Biscayne Blvd Rossville, GA | 3.0 | 1.0 | 1100 | $1,399 | $1.27 | 14d | 1 | 0.07mi |
| 105 Biscayne Blvd Rossville, GA | 2.0 | 2.0 | 1000 | $1,650 | $1.65 | 44d | 1 | 0.11mi |
| 1640 Keeble St East Ridge, TN | 2.0 | 1.5 | 800 | $1,095 | $1.37 | 23d | 1 | 0.17mi |
| 1638 Keeble St Unit 1640 Chattanooga, TN | 2.0 | 1.5 | 800 | $1,095 | $1.37 | 23d | 1 | 0.18mi |
| 5700 Roper St Chattanooga, TN | 1.0–2.0 | 1.0–1.5 | 795 | $1,120 | $1.41 | 23d | 1 | 0.20mi |
| 1502 Prater Rd Chattanooga, TN | 4.0 | 1.5 | 1280 | $2,340 | $1.83 | 23d | 1 | 0.45mi |
| 5307 Marion Ave Chattanooga, TN | 2.0 | 1.0 | 900 | $1,150 | $1.28 | 23d | 1 | 1.04mi |
| 1710 Jennings Ln Chattanooga, TN | 3.0 | 2.0 | 1350 | $1,795 | $1.33 | 23d | 1 | 1.10mi |
| 1111 McBrien Rd Chattanooga, TN | 4.0 | 2.0 | 1300 | $1,499 | $1.15 | 14d | 1 | 1.18mi |
| 22 Ann Dr Rossville, GA | 2.0 | 1.0 | 800 | $1,250 | $1.56 | 14d | 1 | 1.25mi |
| 686 Mack Smith Rd Rossville, GA | 3.0 | 2.0 | 1443 | $2,500 | $1.73 | 44d | 1 | 1.27mi |
| 61 Corley Ave Rossville, GA | 3.0 | 2.0 | 1304 | $1,823 | $1.40 | 23d | 1 | 1.37mi |
| 315 Mcbrien Rd Unit 2 Chattanooga, TN | 2.0 | 2.0 | 1080 | $1,850 | $1.71 | 23d | 1 | 1.47mi |
Listing history 5 events
-
2026-05-08price $164,900 171-char remark
Show marketing remark (171 chars)
PRICE REDUCED!!! Updated 3 bedroom 1 bath home in convenient location hear East Ridge. Fresh paint. Fenced level backyard. New Flooring. Large storage room. Move in Ready.
-
2026-04-18price $169,900 171-char remark
Show marketing remark (171 chars)
PRICE REDUCED!!! Updated 3 bedroom 1 bath home in convenient location hear East Ridge. Fresh paint. Fenced level backyard. New Flooring. Large storage room. Move in Ready.
-
2026-03-06price $175,900 171-char remark
Show marketing remark (171 chars)
PRICE REDUCED!!! Updated 3 bedroom 1 bath home in convenient location hear East Ridge. Fresh paint. Fenced level backyard. New Flooring. Large storage room. Move in Ready.
-
2026-02-12$185,000 Active 171-char remark
Show marketing remark (171 chars)
PRICE REDUCED!!! Updated 3 bedroom 1 bath home in convenient location hear East Ridge. Fresh paint. Fenced level backyard. New Flooring. Large storage room. Move in Ready.
-
1993-10-15soldstatus $25,000
ⓘ Source: listings_history table (triggers on properties + properties_extension) + one-shot
backfill from property_details.listing_events for pre-trigger history.
Tax reassessment forecast TN · Resets to sale price
- Current annual tax
- $966 · $81/mo
- Projected year-2 tax
- $1,171 · $98/mo
- Expected delta
- +$205/yr (+$17/mo · 21.2%)
ⓘ Screening estimate from a state-policy table — verify with the county assessor before closing.
Climate risk First Street
- Flood 1/10 Low FEMA zone X (unshaded) · 0% chance over 30 yrs
- Wildfire 1/10 Low
- Heat 6/10 Major 7 d/yr ≥105°F today · 19 d/yr by 30 yrs out
- Wind 4/10 Moderate 11% chance of damaging wind over 30 yrs
- Air quality 3/10 Moderate 2 unhealthy d/yr today · 2 by 30 yrs out
Nearby sold comps map
Loading sold comps map…
Walkable amenities ~0.75 mi
Loading nearby amenities…
Taxation est. · year 1
- Rental income
- $17,979
- − Mortgage interest
- −$9,237
- − Property taxes
- −$966
- − Insurance
- −$824
- − Repairs & maintenance
- −$1,438
- − Management
- −$1,438
- − Depreciation
- −$4,797
- Taxable loss
- −$722
- Est. tax savings @ 24.0%
- +$173
- After-tax cash flow
- $2,209/yr
For passive investors: Depreciation is non-cash, so a rental often shows a tax loss while cash-flowing — sheltering income. Rental losses are passive: they offset passive income freely, and up to $25,000/yr can offset ordinary (W-2) income if you actively participate and your MAGI is under $100k (phasing out to $0 by $150k); unused losses carry forward. On sale, claimed depreciation is recaptured at up to 25%, and gains may owe capital-gains tax (a 1031 exchange can defer both). Figures are a year-1 estimate at your 24.0% rate — not tax advice; consult a CPA.
Schools (NCES district)
- District
- Catoosa County
- NCES district ID
- 1300930
- Math proficiency
- 36% ▼ -15.00%
- Reading proficiency
- 41% ▼ -8.00%
- Median HH income
- $48,913
- Composite
- 33.13/100
- National rank
- #5558
- State rank
- #49 of 174 in GA
Livability — East Ridge
- Score
- 71/100
- State rank
- #41
- US rank
- #6686
Category grades
Schools grade is shown separately in the Schools card above.
Census & demographics
- County
- Walker County
- City population
- 21,864
- Metro
- Chattanooga, TN-GA
- Population (ZIP)
- 30,041
- Household income
- $58,834
- Rent vs Own
- Severe rent burden
- 834.0
Population outlook (Catoosa County) Hauer SSP2
- Today (2025)
- 70,112 people
- By 2030
- 71,621 · +2.2%
- By 2040
- 73,595 · +5.0%
- By 2050
- 73,921 · +5.4%
- By 2075
- 72,135 · +2.9%
- By 2100
- 65,979 · -5.9%
Race, ethnicity, and origin ACS 2023
- Neighborhood character
- Predominantly White (86%)
- Race & ethnicity
- White 86% Black 5% Two or more races 5% Hispanic / Latino 5%
- Common ancestry
- Slovak 3% Iranian 2% Italian 1%
- Foreign-born
- 2% · Canada
- Languages at home
- 96% English-only · Spanish 3%
Political lean MEDSL · Catoosa
- 2024 margin
- Solid R (+55.5) · D 22.0% · R 77.5%
- 2008→2024 swing
- -5.7pp toward R · 2008: -49.8pp · 2024: -55.5pp
- All cycles
- 2024: R+55.5 2020: R+56.0 2016: R+60.7 2012: R+52.8 2008: R+49.8
Not yet ingested
- Civics
- —
Market trends
- HPI YoY
- ▼ -118.05%
- Current HPI
- 267.0047
- Rent YoY
- ▲ 7.44%
- Metro
- Chattanooga, TN-GA
- State GDP YoY
- ▲ 2.78%
- F500 in state
- 22
Industry mix (Fortune 500 HQ in TN)
| Industry | F500 HQs | Revenue |
|---|---|---|
| Healthcare | 3 | $91B |
|
||
| Retail | 3 | $72B |
|
||
| Transportation / Logistics | 1 | $88B |
|
||
| Paper / Packaging | 1 | $19B |
|
||
| Insurance | 1 | $13B |
|
||
| Energy | 1 | $12B |
|
||
Price history
+559.6% since first listed5 events — show timeline
- 2026-05-08 Price Changed $164,900 GCAR
- 2026-04-18 Price Changed $169,900 GCAR
- 2026-03-06 Price Changed $175,900 GCAR
- 2026-02-12 Listed $185,000 GCAR
- 1993-10-15 Sold (Public Records) $25,000 Public Records
Property tax history
+7.5%/yrLatest (2025): $966 · +22.4% YoY. Source: county tax records.
Cash-flow waterfall
monthlySold comps — $/sqft
last 12 mo · ≤1 miLoading sold comps…