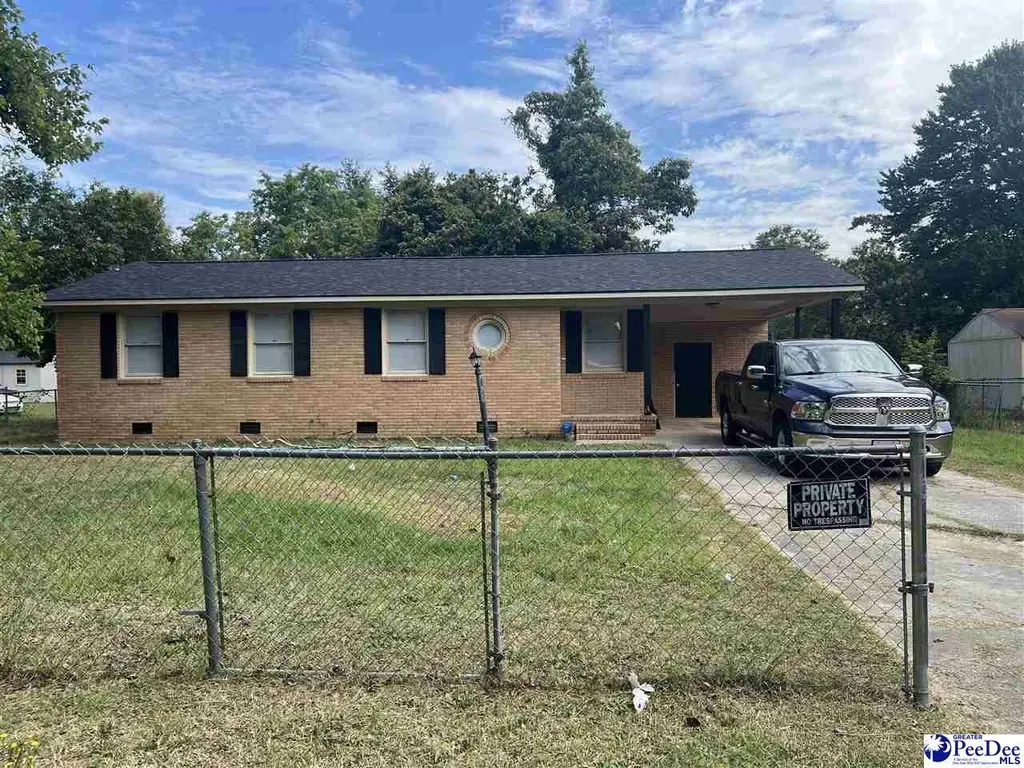
811 E Scarlett Ln · Florence, SC
Flood risk 1/10 · Minimal
- FEMA flood zone
- X (unshaded)
- Chance of flooding over 30 yrs
- 0.0%
- Est. flood insurance / yr
- $507 – $1,088
Fire risk 7/10 · Major
- Est. fire insurance / yr
- $783 – $1,453
Heat risk 7/10 · Major
- Hot days now (above 108°F)
- 7 days/yr
- Hot days in 30 yrs
- 16 days/yr
Wind risk 8/10 · Major
- Chance of severe wind over 30 yrs
- 80.0%
Air-quality risk 1/10 · Minimal
- Unhealthy air days now
- 0 days/yr
- Unhealthy air days in 30 yrs
- 0 days/yr
Risk factors via First Street. Map © Google.
Why this score? — see what drove the C+ grade
The composite is a weighted blend of 9 inputs, each scored 0–100. Each bar is that input's sub-score; the figure is the points it added to the 100-point composite (weight × sub-score).
- Cash flow +26.3/30.0
- DSCR +8.9/10.0
- ARV discount +8.9/15.0
- 1% rule +6.6/10.0
- Rent growth +4.2/5.0
- Schools +3.2/10.0
- Livability +3.1/5.0
- Condition / age +2.5/5.0
- Appreciation +0.0/10.0
$145,000
🖨 Deal sheet 📄 Offer letter ✓ Due diligence
Listing remarks MLS
HUD PROPERTY SOLD AS IS. FHA INSURABLE WITH REPAIR ESCROW.
Key facts
- Near schools
- Recent remodel
- Near shopping
Tags
Property features AI
Finance
- Other: Located in the Tara Village subdivision
Exterior
- Parking: 1-car garage
- Utilities: Public water; Public sewer
- Home design: Single family residence; Residential property
- Construction: Brick veneer construction; Crawl space foundation; Built area above grade: 1,047
- Exterior features: Storage
Interior
- Kitchen: Range; Refrigerator
- Flooring: Carpet; Laminate
- Bathrooms: 1 full bathroom; 1 half bathroom
- Heating & cooling: Central heating; Central air conditioning
- Interior features: Range; Refrigerator; Storage
Neighborhood map
What this means for you Summary
Snapshot
- This is a 3-bed/1.5-bath single-family listed at $145k.
Deal economics
- At list price, monthly cash flow is $374 ($4k/yr) — positive.
- The deal already cash-flows at list — no discount required.
- Meets the 1% rule at list price ($2k rent vs $145k).
- Recommended offer: $141k (3.0% below list) — sets the bar for market timing.
- Cap rate 9.4% vs local median 3.5% in Florence — top-decile yield for the area; either an underpriced asset or a hidden risk that comps aren't pricing in. Stress-test before assuming the spread holds.
Location & tenants
- Location reads 62/100 on livability (#196 in SC) — a middle-class / working-renter tenant base. Strengths: cost of living A+, housing A+, health & safety B+; Watch: employment C-, crime F, amenities F.
- Florence 01 (urban): math 29% / reading 47% proficiency, ranked #34 of 80 in SC (top 42%) — families likely to look elsewhere, expect single-tenant / working-renter base with shorter leases.
- Zoned schools: Dewey-Carter Elementary (math 25% / reading 34%, grade F, #399 of 597 statewide, top 69%, 583 students, 100% FRL); Southside Middle (math 18% / reading 38%, grade F, #146 of 229 statewide, top 64%, 1,100 students, 100% FRL); South Florence High (math 58% / reading 86%, grade B+, #48 of 196 statewide, top 26%, 1,643 students, 77% FRL) — zoned schools average 92% FRL vs 57% district-wide (35 pts higher); higher-poverty schools than district average — tighter screening recommended.
- Market conditions: Rents rising fast (+7.0%/yr); 183 active listings in the ZIP; 657 units permitted in Florence County in 2024 (40 in 5+ unit buildings).
- This rent runs 30% of the median local income ($67k/yr) — at the standard rent-burdened threshold; future hikes will face affordability resistance.
Forward outlook
- Local home prices are declining (-3.0%/yr); year-one equity from $1k of loan paydown is wiped out by about $4k of value loss. Plan a longer hold.
- At projected returns (-3.0% appreciation + 7.0% rent growth), your $41k cash investment doubles in ~8 years — after that, you're playing with house money.
Negotiation context
- It's been on market 52 days — a 3% lower offer ($141k) is reasonable based on typical stale-listing flexibility.
- 3 sale attempts since 24y ago with the ask held roughly flat each time — persistent listings suggest the price (not the market) is what's stuck; bring a comps-based counter.
- Current owner paid $61k; list at $145k implies a 138% gain — meaningful room to come down on a strong offer.
Risks & watch-outs
- Climate carrying-cost: severe wind risk, 80% chance of damaging wind over 30y; major wildfire risk; extreme-heat days projected 7→16/yr by 2055 (HVAC capex compounding) — expect insurance premiums to compound above CPI over the hold.
Questions for the listing agent
- It's been on market 52 days. Have you received any prior offers? Is the seller open to a 3% concession, seller financing, or rate buy-down credit?
- Built in 1973 — when were the roof, HVAC, electrical panel, plumbing, and water heater last replaced?
- Is there a deadline driving the sale (1031 exchange, divorce, estate, relocation)? That informs how much negotiation room exists.
- Crime grade is F in this area — have there been break-ins, vandalism, or insurance claims at this property in the last 3 years? What carrier currently insures it and at what premium?
- What's the average days-on-market for RENTAL listings here right now (not sales)? A rising rental-DOM trend means longer vacancies and softer asking-rent achievability than the comps imply.
- What's the recent tenant-quality profile in this submarket — average credit score on applications, eviction rate, late-payment / NSF rate, and stable-employment percentage? A property-management company in the area should have these aggregated.
- How much new for-sale + rental construction is in the pipeline within 1–3 miles? Heavy new supply typically softens prices + rents 12–24 months out; constrained supply supports both.
Investment metrics
- 1% rule
- 1.16% ✓
- Cap rate
- 9.39%
- Cash-on-cash
- 11.06%
- DSCR
- 1.49
- GRM
- 7.2
CMA / ARV
- ARV (on-the-fly)
- $149,721
- Comps found
- 12
Show comp detail 12 sales within ~0.75 mi
| Address | Dist | Beds/Ba | Sqft | Sold | Price | $/sf | Match |
|---|---|---|---|---|---|---|---|
| 822 E Butler Ln | 0.17mi | 3/1.5 | 1,100 (+5%) | 1mo | $134,900 | $123 | 83 |
| 818 E Scarlett Ln | 0.04mi | 3/2.0 | 1,050 (+0%) | 16mo | $165,000 | $157 | 82 |
| 3509 Plantation Dr | 0.44mi | 3/1.5 | 1,050 (+0%) | 12mo | $139,900 | $133 | 69 |
| 1025 E Scarlett Ln | 0.36mi | 3/1.0 | 1,102 (+5%) | 4mo | $100,000 | $91 | 69 |
| 823 E Bonnie Ln | 0.20mi | 3/1.5 | 1,108 (+6%) | 16mo | $100,000 | $90 | 67 |
| 1010 E Scarlett Ln | 0.29mi | 3/2.0 | 1,050 (+0%) | 20mo | $165,000 | $157 | 67 |
| 3707 Gable Ter | 0.56mi | 3/1.5 | 1,120 (+7%) | 2mo | $75,000 | $67 | 61 |
| 3505 Plantation Dr | 0.44mi | 3/1.5 | 1,051 (+0%) | 22mo | $170,000 | $162 | 60 |
| 3523 Atlanta Ter | 0.10mi | 4/1.5 (+1) | 1,150 (+10%) | 21mo | $135,000 | $117 | 57 |
| 1033 Aunt Prissey Ct | 0.41mi | 3/2.0 | 1,008 (-4%) | 22mo | $144,000 | $143 | 54 |
| 3524 Plantation Dr | 0.48mi | 4/2.0 (+1) | 1,150 (+10%) | 5mo | $174,000 | $151 | 50 |
| 1016 Aunt Prissey Ct | 0.39mi | 3/2.0 | 1,183 (+13%) | 13mo | $173,200 | $146 | 47 |
Match score weights: distance 35% · size 25% · config 20% · recency 20%. Top-matched comps best support the ARV.
Projected returns pro-forma
-3.0% appreciation · 6.97% rent growth · sell at horizon
- IRR
- 4.5%
- Equity multiple
- 1.18×
- Total profit
- $7,341
- Equity at exit
- $21,620
- IRR
- 17.3%
- Equity multiple
- 2.68×
- Total profit
- $68,245
- Equity at exit
- $12,537
Cash invested: $40,600 (down + closing). Projections, not guarantees.
Landlord ↔ Tenant lean methodology
- Overall (STATE)
- 90 Strongly Landlord-Friendly
- State South Carolina
- 90 Strongly Landlord-Friendly · R+6
- County
- — inherits STATE
- City
- — inherits STATE
ZIP-level market 29505
- Rents YoY
- 7.0%
- Active inventory
- 183
- Price-to-rent
- 7.2×
Monthly cashflow live
- Estimated rent
- $1,684 medium interval (Pro) →
- Mortgage (P&I)
- −$760
- Tax from tax record
- −$136 /mo · $1,626/yr
- Insurance
- −$60
- HOA
- −$0
- Vacancy / Maint / Mgmt
- −$354
- Net cashflow
- $374
Break-even live
UW: 25.0% down · 7.5% · 30yr · 1.5% tax · 5.0% vac · 8.0% maint · 8.0% mgmt
Financing live
Cash to close
- Down payment
- $36,250
- Closing costs
- $4,350
- Reserves months
- —
- Total cash needed
- —
Loan-product check · same deal, 3 products live
Conventional
25% down · 7.5% · 30yr
- Down + closing
- —
- Monthly P&I
- —
- Monthly cashflow
- —
- DSCR
- —
- Eligible?
- —
Personal DTI + credit; lowest rate.
DSCR
20% down · 8.5% · 30yr
- Down + closing
- —
- Monthly P&I
- —
- Monthly cashflow
- —
- DSCR
- —
- Eligible?
- —
No personal income docs; deal must DSCR.
Hard money
10% down · 12.0% · 12mo
- Down + closing
- —
- Monthly P&I
- —
- Monthly cashflow
- —
- DSCR
- —
- Eligible?
- —
Short-term bridge; refi at stabilization.
Listing history 23 events
-
2026-06-19days on market $145,000 Active 52 DOM
-
2026-06-18days on market $145,000 Active 51 DOM
-
2026-06-17days on market $145,000 Active 50 DOM
-
2026-06-16days on market $145,000 Active 49 DOM
-
2026-06-15days on market $145,000 Active 48 DOM
-
2026-06-14days on market $145,000 Active 46 DOM
-
2026-06-13days on market $145,000 Active 45 DOM
-
2026-06-10days on market $145,000 Active 43 DOM
-
2026-06-09days on market $145,000 Active 42 DOM
-
2026-06-08days on market $145,000 Active 41 DOM
-
2026-06-07days on market $145,000 Active 40 DOM
-
2026-06-05days on market $145,000 Active 37 DOM
-
2026-06-02days on market $145,000 Active 35 DOM
-
2026-06-01days on market $145,000 Active 34 DOM
-
2026-05-31days on market $145,000 Active 33 DOM
-
2026-05-30days on market $145,000 Active 32 DOM
-
2026-04-28$150,000 Active
-
2024-08-05historical $1,200
-
2024-07-10$1,200
-
2004-01-28soldstatus $61,000
-
2002-08-29soldstatus $39,100 58-char remark
Show marketing remark (58 chars)
HUD PROPERTY SOLD AS IS. FHA INSURABLE WITH REPAIR ESCROW.
-
2002-03-08$40,800 58-char remark
Show marketing remark (58 chars)
HUD PROPERTY SOLD AS IS. FHA INSURABLE WITH REPAIR ESCROW.
-
1997-07-31soldstatus $28,000
ⓘ Source: listings_history table (triggers on properties + properties_extension) + one-shot
backfill from property_details.listing_events for pre-trigger history.
Tax reassessment forecast SC · Resets to sale price
- Current annual tax
- $1,626 · $136/mo
- Projected year-2 tax
- $1,626 · $136/mo
- Expected delta
- $0/yr ($0/mo · 0.0%)
ⓘ Screening estimate from a state-policy table — verify with the county assessor before closing.
Climate risk First Street
- Flood 1/10 Low FEMA zone X (unshaded) · 0% chance over 30 yrs
- Wildfire 7/10 Severe
- Heat 7/10 Severe 7 d/yr ≥108°F today · 16 d/yr by 30 yrs out
- Wind 8/10 Severe 80% chance of damaging wind over 30 yrs
- Air quality 1/10 Low 0 unhealthy d/yr today · 0 by 30 yrs out
Nearby sold comps map
Loading sold comps map…
Walkable amenities ~0.75 mi
Loading nearby amenities…
Taxation est. · year 1
- Rental income
- $20,213
- − Mortgage interest
- −$8,122
- − Property taxes
- −$1,626
- − Insurance
- −$725
- − Repairs & maintenance
- −$1,617
- − Management
- −$1,617
- − Depreciation
- −$4,218
- Taxable income
- $2,287
- Est. tax owed @ 24.0%
- −$549
- After-tax cash flow
- $3,943/yr
For passive investors: Depreciation is non-cash, so a rental often shows a tax loss while cash-flowing — sheltering income. Rental losses are passive: they offset passive income freely, and up to $25,000/yr can offset ordinary (W-2) income if you actively participate and your MAGI is under $100k (phasing out to $0 by $150k); unused losses carry forward. On sale, claimed depreciation is recaptured at up to 25%, and gains may owe capital-gains tax (a 1031 exchange can defer both). Figures are a year-1 estimate at your 24.0% rate — not tax advice; consult a CPA.
Schools (NCES district)
- District
- Florence 01
- NCES district ID
- 4502130
- Math proficiency
- 29% ▼ -10.00%
- Reading proficiency
- 47% ▬ 0.00%
- Median HH income
- $45,782
- Composite
- 32.36/100
- National rank
- #5737
- State rank
- #34 of 80 in SC
Livability — Florence
- Score
- 62/100
- State rank
- #196
- US rank
- #17076
Category grades
Schools grade is shown separately in the Schools card above.
Census & demographics
- County
- Florence County · 93,345 people
- City population
- 93,345
- Metro
- Florence, SC
- Population (ZIP)
- 23,895
- Household income
- $67,343
- Rent vs Own
- Severe rent burden
- 559.0
Population outlook (Florence County) Hauer SSP2
- Today (2025)
- 141,714 people
- By 2030
- 142,121 · +0.3%
- By 2040
- 141,344 · -0.3%
- By 2050
- 139,478 · -1.6%
- By 2075
- 132,275 · -6.7%
- By 2100
- 118,374 · -16.5%
Race, ethnicity, and origin ACS 2023
- Neighborhood character
- Diverse neighborhood (Simpson 0.57)
- Race & ethnicity
- White 53% Black 38% Hispanic / Latino 5% Two or more races 3% Asian 1%
- Common ancestry
- Slovak 2% Lithuanian 1% Serbian 1%
- Foreign-born
- 3% · Canada, China
- Languages at home
- 96% English-only · Spanish 2% Other Indo-European 1%
Political lean MEDSL · Florence
- 2024 margin
- Lean R (+8.0) · D 45.3% · R 53.3% · Other 1.3%
- 2008→2024 swing
- -4.8pp toward R · 2008: -3.2pp · 2024: -8.0pp
- All cycles
- 2024: R+8.0 2020: R+2.3 2016: R+5.0 2012: R+0.5 2008: R+3.2
Not yet ingested
- Civics
- —
Market trends
- HPI YoY
- ▼ -138.13%
- Current HPI
- 177.9352
- Rent YoY
- ▲ 6.97%
- Metro
- Florence, SC
- State GDP YoY
- ▲ 4.51%
- F500 in state
- 2
Industry mix (Fortune 500 HQ in SC)
| Industry | F500 HQs | Revenue |
|---|---|---|
| Packaging | 1 | $7B |
|
||
Price history
+435.7% since first listed7 events — show timeline
- 2026-04-28 Listed $150,000 RAGPD
- 2024-08-05 Rental Removed $1,200 RAGPD
- 2024-07-10 Listed for Rent $1,200 RAGPD
- 2004-01-28 Sold (Public Records) $61,000 Public Records
- 2002-08-29 Sold (MLS) $39,100 Charleston Trident MLS
- 2002-03-08 Listed $40,800 Charleston Trident MLS
- 1997-07-31 Sold (Public Records) $28,000 Public Records
Property tax history
+3.7%/yrLatest (2025): $1,626 · +3.2% YoY. Source: county tax records.
Cash-flow waterfall
monthlySold comps — $/sqft
last 12 mo · ≤1 miLoading sold comps…