 🏢 Co-op
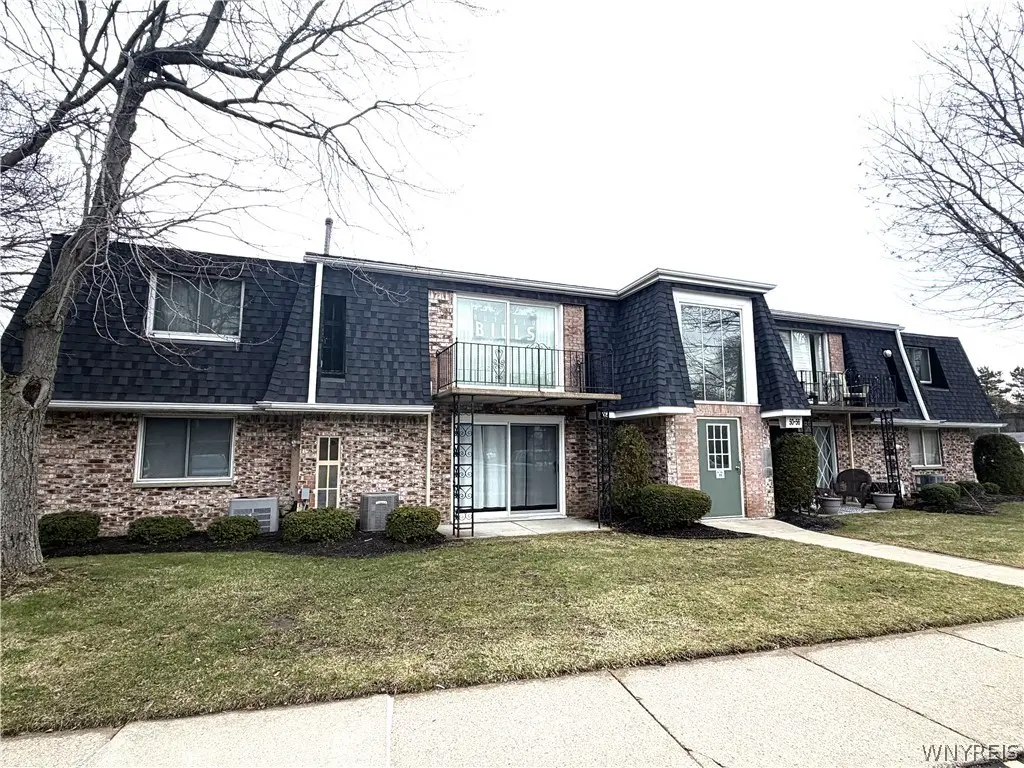
50A Foxberry · University at Buffalo, NY
Flood risk 1/10 · Minimal
- FEMA flood zone
- X (shaded)
- Chance of flooding over 30 yrs
- 0.0%
- Est. flood insurance / yr
- $473 – $860
Fire risk 3/10 · Minor
- Est. fire insurance / yr
- $691 – $1,283
Heat risk 3/10 · Minor
- Hot days now (above 94°F)
- 7 days/yr
- Hot days in 30 yrs
- 16 days/yr
Wind risk 1/10 · Minimal
- Chance of severe wind over 30 yrs
- —
Air-quality risk 3/10 · Minor
- Unhealthy air days now
- 2 days/yr
- Unhealthy air days in 30 yrs
- 3 days/yr
Risk factors via First Street. Map © Google.
Why this score? — see what drove the D+ grade
The composite is a weighted blend of 9 inputs, each scored 0–100. Each bar is that input's sub-score; the figure is the points it added to the 100-point composite (weight × sub-score).
- Cash flow +15.0/30.0
- ARV discount +7.5/15.0
- Schools +6.3/10.0
- 1% rule +5.0/10.0
- DSCR +5.0/10.0
- Livability +4.4/5.0
- Rent growth +2.5/5.0
- Condition / age +2.5/5.0
- Appreciation +0.0/10.0
$164,900
🖨 Deal sheet (PDF) 📄 Offer letter ✓ Due diligence
Multi-family units
County records classify this as Multi-Family (5+ Unit). Listing-text estimate: 1 unit. estimate disagrees with records
5+ unit building — per-unit beds/baths from public records are typically unavailable; the breakdown below (if shown) is an estimate from the listing text.
Listing remarks
Totally updated 1st floor condo (building#11)! Light & bright throughout! Kitchen with light wood cabinets, granite counters, breakfast bar & includes stainless stove, refrigerator, dishwasher & microwave. Living room with sliding doors to covered porch/patio. Updated bathroom. Recent luxury vinyl plank flooring through out, light fixutres & freshly painted (all in 2023'). Updated Furnace & Central Air (2025'). Common laundry (20' from this unit). Private storage room. Don't forget the pool! Pets: Cats allowed. Dogs up to 30lbs with board approval. No rental units allowed at this time. There is a buyers entrance fee of $250 to the Hoa.
Key facts
- Stainless stove
- Dishwasher
- Refrigerator
Tags
Property features AI
Exterior
- Home design: Property located at 50A Foxberry, Getzville, NY 14068
Neighborhood map
What this means for you Summary
Snapshot
- This is a 2-bed/1.0-bath multifamily listed at $165k.
Deal economics
- At list price, monthly cash flow is $7k ($83k/yr) — positive.
- The deal already cash-flows at list — no discount required.
- Meets the 1% rule at list price ($10k rent vs $165k).
- Recommended offer: $162k (1.5% below list) — sets the bar for market timing.
- Cap rate 56.9% vs local median 2.8% in University at Buffalo — top-decile yield for the area; either an underpriced asset or a hidden risk that comps aren't pricing in. Stress-test before assuming the spread holds.
Location & tenants
- Location reads 88/100 on livability (#9 in NY, #176 nationally) — a professional / high-income tenant draw. Strengths: schools A+, amenities A+, commute A+; Watch: cost of living D+, employment F.
- Williamsville Central School District (suburban): math 64% / reading 77% proficiency, ranked #114 of 590 in NY (top 19%) — strong family-tenant draw, lease renewals of 3-5y typical; only 10% free/reduced lunch — higher-income household profile.
- Market conditions: 34 active listings in the ZIP; 3 comparable units currently listed for rent nearby; rentals leasing fast (median 4d on market — plan ~1-2 weeks tenant-placement turnaround); 1,244 units permitted in Erie County in 2024 (563 in 5+ unit buildings).
Forward outlook
- Local home prices are declining (-3.0%/yr); year-one equity from $1k of loan paydown is wiped out by about $5k of value loss. Plan a longer hold.
- At projected returns (-3.0% appreciation + 3.0% rent growth), your $46k cash investment doubles in ~1 year — after that, you're playing with house money.
Negotiation context
- It's been on market 15 days — a 2% lower offer ($162k) is reasonable based on typical stale-listing flexibility.
- Current owner paid $138k; 20% above their basis — modest negotiation headroom, anchor on the comps not their cost.
Questions for the listing agent
- Built in 1975 — when were the roof, HVAC, electrical panel, plumbing, and water heater last replaced?
- What does the HOA fee cover, when was the last increase, and are there any pending special assessments or reserve-fund shortfalls?
- Is there a deadline driving the sale (1031 exchange, divorce, estate, relocation)? That informs how much negotiation room exists.
- Schools are A-rated — typically a magnet for longer-tenancy family renters. What's the average tenant stay here, and is there a school-zone premium baked into asking?
- The area grade is low — what's the realistic commute time and amenity access for the typical tenant pool here? Any planned neighborhood developments (good or bad) we should know about?
- What's the average days-on-market for RENTAL listings here right now (not sales)? A rising rental-DOM trend means longer vacancies and softer asking-rent achievability than the comps imply.
- What's the recent tenant-quality profile in this submarket — average credit score on applications, eviction rate, late-payment / NSF rate, and stable-employment percentage? A property-management company in the area should have these aggregated.
- How much new apartment / multifamily construction is in the pipeline within 1–3 miles? Heavy new supply (>2% of stock underway) typically softens rents 12–24 months out; light construction supports rent growth.
Investment metrics
- 1% rule
- 6.34% ✓
- Cap rate
- 56.89%
- Cash-on-cash
- 180.71%
- DSCR
- 9.04
- GRM
- 1.3
CMA / ARV
No comps found within radius.
Projected returns pro-forma
-3.0% appreciation · 3.0% rent growth · sell at horizon
- IRR
- —
- Equity multiple
- 10.02×
- Total profit
- $416,376
- Equity at exit
- $24,587
- IRR
- —
- Equity multiple
- 21.23×
- Total profit
- $933,845
- Equity at exit
- $14,258
Cash invested: $46,172 (down + closing). Projections, not guarantees.
Landlord ↔ Tenant lean methodology
- Overall (STATE)
- 15 Strongly Tenant-Friendly
- State New York
- 15 Strongly Tenant-Friendly · D+10
- County
- — inherits STATE
- City
- — inherits STATE
ZIP-level market 14068
- Home prices YoY
- -16.3%
- Active inventory
- 34
- Price-to-rent
- 6.6×
Monthly cashflow live
- Estimated rent
- $10,450 high interval (Pro) →
- Mortgage (P&I)
- −$865
- Tax from tax record
- −$139 /mo · $1,669/yr
- Insurance
- −$69
- HOA
- −$230
- Vacancy / Maint / Mgmt
- −$2,194
- Net cashflow
- $6,953
Break-even live
Sensitivity live
| Price | -10% $7,046 | -5% $7,000 | +0% $6,953 | +5% $6,906 | +10% $6,860 |
|---|---|---|---|---|---|
| Rent | -10% $6,127 | -5% $6,540 | +0% $6,953 | +5% $7,366 | +10% $7,779 |
| Rate | -1.0pp $7,036 | -0.5pp $6,995 | base $6,953 | +0.5pp $6,910 | +1.0pp $6,867 |
5-unit breakdown (identical units grouped — click to expand)
| Units | Beds | Baths | Est. rent |
|---|---|---|---|
| 5× units | 2 | 1 | $10,450 |
| #1 | 2 | 1 | $2,090 |
| #2 | 2 | 1 | $2,090 |
| #3 | 2 | 1 | $2,090 |
| #4 | 2 | 1 | $2,090 |
| #5 | 2 | 1 | $2,090 |
| Total (5 units) | $10,450 | ||
UW: 25.0% down · 7.5% · 30yr · 1.5% tax · 5.0% vac · 8.0% maint · 8.0% mgmt
Financing live
Cash to close
- Down payment
- $41,225
- Closing costs
- $4,947
- Reserves months
- —
- Total cash needed
- —
Loan-product check · same deal, 3 products live
Conventional
25% down · 7.5% · 30yr
- Down + closing
- —
- Monthly P&I
- —
- Monthly cashflow
- —
- DSCR
- —
- Eligible?
- —
Personal DTI + credit; lowest rate.
DSCR
20% down · 8.5% · 30yr
- Down + closing
- —
- Monthly P&I
- —
- Monthly cashflow
- —
- DSCR
- —
- Eligible?
- —
No personal income docs; deal must DSCR.
Hard money
10% down · 12.0% · 12mo
- Down + closing
- —
- Monthly P&I
- —
- Monthly cashflow
- —
- DSCR
- —
- Eligible?
- —
Short-term bridge; refi at stabilization.
Rent comps 3 comps
| Address | Beds | Baths | Sqft | Rent | $/sqft | DOM | Units | Dist |
|---|---|---|---|---|---|---|---|---|
| 3253 Millersport Hwy Getzville, NY | 2.0 | 2.0 | 1069 | $1,995 | $1.87 | 3d | 26 | 0.90mi |
| 2635 N Forest Rd Unit Type G Getzville, NY | 1.0 | 1.0 | 705 | $1,699 | $2.41 | 3d | 1 | 1.28mi |
| 2250 N French Rd Getzville, NY | 1.0–2.0 | 1.0 | 814 | $1,700 | $2.09 | 3d | 1 | 1.38mi |
HOA detail
- Monthly dues
- $230 · $2,760/yr
- Likely covers
- pool
Listing history 5 events
-
2026-04-14status Pending
-
2026-04-10historical Active Under Contract
-
2026-03-30$164,900 Active
-
2021-09-29soldstatus $137,500
-
2016-10-28soldstatus $94,500
ⓘ Source: listings_history table (triggers on properties + properties_extension) + one-shot
backfill from property_details.listing_events for pre-trigger history.
Tax reassessment forecast NY · Partial reset (capped growth)
- Current annual tax
- $1,669 · $139/mo
- Projected year-2 tax
- $2,228 · $186/mo
- Expected delta
- +$559/yr (+$47/mo · 33.5%)
ⓘ Screening estimate from a state-policy table — verify with the county assessor before closing.
Climate risk First Street
- Flood 1/10 Low FEMA zone X (shaded) · 0% chance over 30 yrs
- Wildfire 3/10 Moderate
- Heat 3/10 Moderate 7 d/yr ≥94°F today · 16 d/yr by 30 yrs out
- Wind 1/10 Low
- Air quality 3/10 Moderate 2 unhealthy d/yr today · 3 by 30 yrs out
Nearby sold comps map
Loading sold comps map…
Walkable amenities ~0.75 mi
Loading nearby amenities…
Taxation est. · year 1
- Rental income
- $125,400
- − Mortgage interest
- −$9,237
- − Property taxes
- −$1,669
- − Insurance
- −$824
- − Repairs & maintenance
- −$10,032
- − Management
- −$10,032
- − HOA
- −$2,760
- − Depreciation
- −$4,797
- Taxable income
- $86,049
- Est. tax owed @ 24.0%
- −$20,652
- After-tax cash flow
- $62,784/yr
For passive investors: Depreciation is non-cash, so a rental often shows a tax loss while cash-flowing — sheltering income. Rental losses are passive: they offset passive income freely, and up to $25,000/yr can offset ordinary (W-2) income if you actively participate and your MAGI is under $100k (phasing out to $0 by $150k); unused losses carry forward. On sale, claimed depreciation is recaptured at up to 25%, and gains may owe capital-gains tax (a 1031 exchange can defer both). Figures are a year-1 estimate at your 24.0% rate — not tax advice; consult a CPA.
Schools (NCES district)
- District
- Williamsville Central School District
- NCES district ID
- 3631470
- Math proficiency
- 64% ▼ -14.00%
- Reading proficiency
- 77% ▲ 6.00%
- Median HH income
- $79,907
- Composite
- 62.59/100
- National rank
- #678
- State rank
- #114 of 590 in NY
Livability — University at Buffalo
- Score
- 88/100
- State rank
- #9
- US rank
- #176
Category grades
Schools grade is shown separately in the Schools card above.
Census & demographics
- City population
- 5,827
- Population (ZIP)
- 8,504
Population outlook (Erie County) Hauer SSP2
- Today (2025)
- 933,037 people
- By 2030
- 935,181 · +0.2%
- By 2040
- 928,531 · -0.5%
- By 2050
- 905,725 · -2.9%
- By 2075
- 834,037 · -10.6%
- By 2100
- 708,033 · -24.1%
Race, ethnicity, and origin ACS 2023
- Neighborhood character
- Predominantly White (81%)
- Race & ethnicity
- White 81% Two or more races 9% Asian 6% Black 4% Hispanic / Latino 2%
- Common ancestry
- Romanian 12% Scotch-Irish 3% Scandinavian 2%
- Foreign-born
- 11% · China, Canada, South Korea
- Languages at home
- 88% English-only · Other Indo-European 4% Chinese 3% Russian/Polish/Slavic 2%
Political lean MEDSL · Erie
- 2024 margin
- Lean D (+9.7) · D 54.8% · R 45.2%
- 2008→2024 swing
- -7.9pp toward R · 2008: 17.5pp · 2024: 9.7pp
- All cycles
- 2024: D+9.7 2020: D+14.7 2016: D+4.8 2012: D+15.6 2008: D+17.5
Not yet ingested
- Civics
- —
Market trends
- HPI YoY
- ▼ -61.31%
- Current HPI
- 314.5567
- Rent YoY
- —
- Metro
- —
- State GDP YoY
- ▲ 2.60%
- F500 in state
- 92
Industry mix (Fortune 500 HQ in NY)
| Industry | F500 HQs | Revenue |
|---|---|---|
| Financial Services | 10 | $950B |
|
||
| Consumer Goods | 9 | $162B |
|
||
| Insurance | 4 | $225B |
|
||
| Telecommunications | 2 | $144B |
|
||
| Pharmaceuticals | 2 | $112B |
|
||
| Media / Entertainment | 2 | $69B |
|
||
Price history
+74.5% since first listed5 events — show timeline
- 2026-04-14 Pending — WNYREIS
- 2026-04-10 Contingent — WNYREIS
- 2026-03-30 Listed $164,900 WNYREIS
- 2021-09-29 Sold (Public Records) $137,500 Public Records
- 2016-10-28 Sold (Public Records) $94,500 Public Records
Property tax history
+10.7%/yrLatest (2025): $1,669 · +2.1% YoY. Source: county tax records.
Cash-flow waterfall
monthlySold comps — $/sqft
last 12 mo · ≤1 miLoading sold comps…