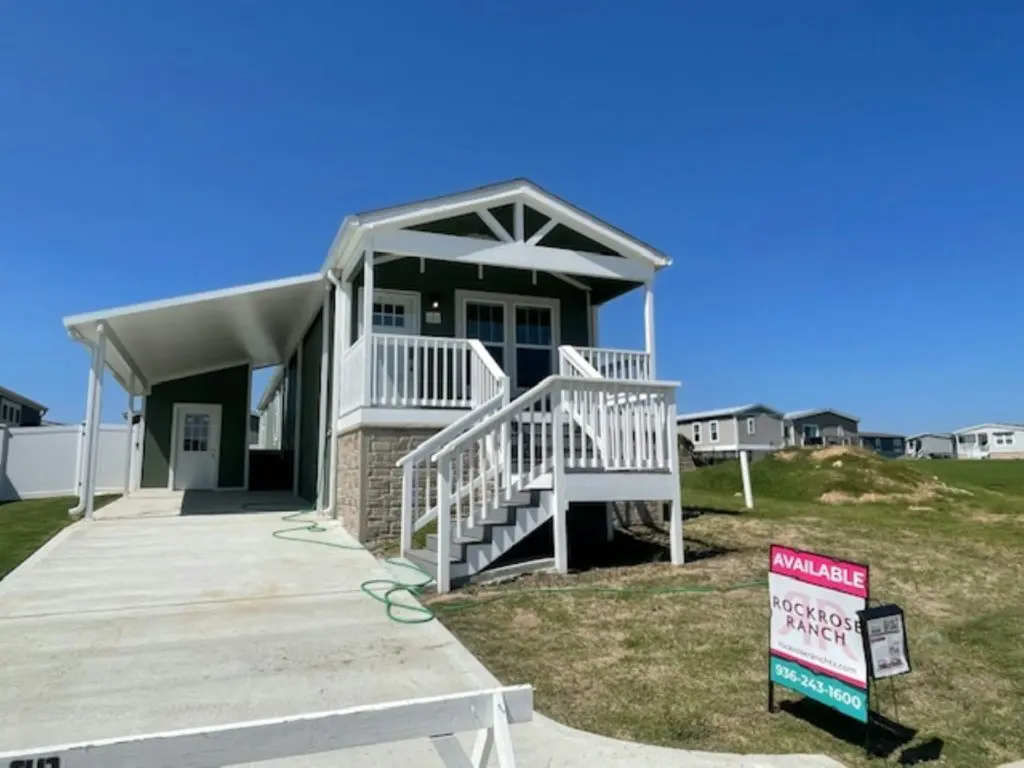
205 Campfire Way · Willis, TX
Flood risk 1/10 · Minimal
- FEMA flood zone
- X (unshaded)
- Chance of flooding over 30 yrs
- 0.0%
- Est. flood insurance / yr
- $507 – $1,088
Fire risk 5/10 · Moderate
- Est. fire insurance / yr
- $1,222 – $2,270
Heat risk 8/10 · Major
- Hot days now (above 111°F)
- 7 days/yr
- Hot days in 30 yrs
- 25 days/yr
Wind risk 9/10 · Severe
- Chance of severe wind over 30 yrs
- 99.0%
Air-quality risk 2/10 · Minimal
- Unhealthy air days now
- 1 days/yr
- Unhealthy air days in 30 yrs
- 1 days/yr
Risk factors via First Street. Map © Google.
Why this score? — see what drove the C grade
The composite is a weighted blend of 9 inputs, each scored 0–100. Each bar is that input's sub-score; the figure is the points it added to the 100-point composite (weight × sub-score).
- Cash flow +30.0/30.0
- DSCR +10.0/10.0
- 1% rule +8.5/10.0
- Schools +3.2/10.0
- Livability +3.1/5.0
- Condition / age +2.2/5.0
- Rent growth +2.0/5.0
- ARV discount +0.0/15.0
- Appreciation +0.0/10.0
$129,900
🖨 Deal sheet (PDF) 📄 Offer letter ✓ Due diligence
Listing remarks MLS
Come see why we are living our best life at RockRose Ranch. You can lease or buy a spacious 1266 sq. ft. home with 3 bedrooms, and 2 baths. RockRose Ranch is located in one of the most desirable areas in Willis. Close to great shopping, restaurants, and parks. It is easy to see why our residents live the best life in our neighborhood. Stop by at RockRose Ranch, send us an email, or give us a call. We look forward to connecting with you soon.
Key facts
- Built 2025
- Listed 199 days
Neighborhood map
What this means for you Summary
Snapshot
- This is a 3-bed/2.0-bath manufactured listed at $130k. Condition is rated fair.
Deal economics
- At list price, monthly cash flow is $485 ($6k/yr) — positive.
- The deal already cash-flows at list — no discount required.
- Meets the 1% rule at list price ($2k rent vs $130k).
- Recommended offer: $114k (12.0% below list) — sets the bar for market timing.
- Cap rate 10.8% vs local median 4.7% in Willis — top-decile yield for the area; either an underpriced asset or a hidden risk that comps aren't pricing in. Stress-test before assuming the spread holds.
Location & tenants
- Location reads 62/100 on livability (#933 in TX) — a middle-class / working-renter tenant base. Strengths: cost of living A+, housing A+; Watch: crime C-, employment D+, amenities F.
- Willis ISD (rural): math 33% / reading 40% proficiency, ranked #458 of 826 in TX (top 55%) — families likely to look elsewhere, expect single-tenant / working-renter base with shorter leases.
- Zoned schools: Parmley El (math 39% / reading 34%, grade F, #1,883 of 4,322 statewide, top 44%, 625 students, 72% FRL); Lynn Lucas Middle (math 23% / reading 32%, grade F, #1,156 of 1,662 statewide, top 71%, 971 students, 74% FRL); Willis H S (math 19% / reading 46%, grade F, #1,029 of 1,632 statewide, top 64%, 2,521 students, 57% FRL).
- Market conditions: Rents soft (-2.1%/yr); 1199 active listings in the ZIP; 8 comparable units currently listed for rent nearby; rentals lingering (median 46d on market — plan ~5-8 weeks vacancy on turnover, expect pricing pressure); 75% of comp listings sitting > 30 days — soft ceiling on asking rent; solid renter incomes; 13,259 units permitted in Montgomery County in 2024 (1,402 in 5+ unit buildings).
Forward outlook
- Local home prices are declining (-3.0%/yr); year-one equity from $898 of loan paydown is wiped out by about $4k of value loss. Plan a longer hold.
- Montgomery County population projected at +65% by 2050 — long-run rental-demand tailwind backs the buy-and-hold thesis.
Negotiation context
- It's been on market 199 days — a 12% lower offer ($114k) is reasonable based on typical stale-listing flexibility.
Risks & watch-outs
- Climate carrying-cost: severe wind risk, 99% chance of damaging wind over 30y; moderate wildfire risk; extreme-heat days projected 7→25/yr by 2055 (HVAC capex compounding) — expect insurance premiums to compound above CPI over the hold.
Questions for the listing agent
- It's been on market 199 days. Have you received any prior offers? Is the seller open to a 12% concession, seller financing, or rate buy-down credit?
- Have any recent inspections been done? Can we get a copy of the seller's disclosures and any deferred-maintenance estimates?
- Why hasn't it sold? Are there any deal-killer items the seller is aware of (foundation, flood, title, zoning, code violations)?
- Is there a deadline driving the sale (1031 exchange, divorce, estate, relocation)? That informs how much negotiation room exists.
- Schools are D-rated, which usually means shorter tenancies and higher turnover. Who's the typical renter profile here, and what's been the actual vacancy rate?
- What's the average days-on-market for RENTAL listings here right now (not sales)? A rising rental-DOM trend means longer vacancies and softer asking-rent achievability than the comps imply.
- What's the recent tenant-quality profile in this submarket — average credit score on applications, eviction rate, late-payment / NSF rate, and stable-employment percentage? A property-management company in the area should have these aggregated.
- How much new for-sale + rental construction is in the pipeline within 1–3 miles? Heavy new supply typically softens prices + rents 12–24 months out; constrained supply supports both.
Investment metrics
- 1% rule
- 1.35% ✓
- Cap rate
- 10.77%
- Cash-on-cash
- 15.99%
- DSCR
- 1.71
- GRM
- 6.2
CMA / ARV
- ARV (median comp)
- $104,950
- List price
- $129,900
- Delta
- 23.77%
- Verdict
- OVERPRICED
- Comps
- 2 within 1.0 mi
Projected returns pro-forma
-3.0% appreciation · 0.0% rent growth · sell at horizon
- IRR
- 3.5%
- Equity multiple
- 1.13×
- Total profit
- $4,715
- Equity at exit
- $19,369
- IRR
- 9.9%
- Equity multiple
- 1.66×
- Total profit
- $24,140
- Equity at exit
- $11,231
Cash invested: $36,372 (down + closing). Projections, not guarantees.
Landlord ↔ Tenant lean methodology
- Overall (STATE)
- 87 Strongly Landlord-Friendly
- State Texas
- 87 Strongly Landlord-Friendly · R+5
- County
- — inherits STATE
- City
- — inherits STATE
ZIP-level market 77318
- Home prices YoY
- -32.7%
- Rents YoY
- -2.1%
- Active inventory
- 1199
- Price-to-rent
- 6.2×
Monthly cashflow live
- Estimated rent
- $1,750 high interval (Pro) →
- Mortgage (P&I)
- −$681
- Tax est. 1.5%
- −$162 /mo · $1,948/yr
- Insurance
- −$54
- HOA
- −$0
- Vacancy / Maint / Mgmt
- −$367
- Net cashflow
- $485
Break-even live
Sensitivity live
| Price | -10% $574 | -5% $530 | +0% $485 | +5% $440 | +10% $395 |
|---|---|---|---|---|---|
| Rent | -10% $346 | -5% $416 | +0% $485 | +5% $554 | +10% $623 |
| Rate | -1.0pp $550 | -0.5pp $518 | base $485 | +0.5pp $451 | +1.0pp $417 |
UW: 25.0% down · 7.5% · 30yr · 1.5% tax · 5.0% vac · 8.0% maint · 8.0% mgmt
Financing live
Cash to close
- Down payment
- $32,475
- Closing costs
- $3,897
- Reserves months
- —
- Total cash needed
- —
Loan-product check · same deal, 3 products live
Conventional
25% down · 7.5% · 30yr
- Down + closing
- —
- Monthly P&I
- —
- Monthly cashflow
- —
- DSCR
- —
- Eligible?
- —
Personal DTI + credit; lowest rate.
DSCR
20% down · 8.5% · 30yr
- Down + closing
- —
- Monthly P&I
- —
- Monthly cashflow
- —
- DSCR
- —
- Eligible?
- —
No personal income docs; deal must DSCR.
Hard money
10% down · 12.0% · 12mo
- Down + closing
- —
- Monthly P&I
- —
- Monthly cashflow
- —
- DSCR
- —
- Eligible?
- —
Short-term bridge; refi at stabilization.
Rent comps 8 comps
| Address | Beds | Baths | Sqft | Rent | $/sqft | DOM | Units | Dist |
|---|---|---|---|---|---|---|---|---|
| 11561 Persimmon St Willis, TX | 3.0 | 2.0 | 1000 | $1,530 | $1.53 | 45d | 1 | 0.65mi |
| 11559 Persimmon St Willis, TX | 3.0 | 2.0 | 1000 | $1,490 | $1.49 | 45d | 1 | 0.65mi |
| 9992 Calendar St Willis, TX | 2.0 | 1.0 | 800 | $1,200 | $1.50 | 45d | 1 | 0.66mi |
| 11555 Persimmon St Willis, TX | 3.0 | 2.0 | 1000 | $1,495 | $1.50 | 45d | 1 | 0.66mi |
| 9745 Black Gum Willis, TX | 3.0 | 2.0 | 1000 | $1,300 | $1.30 | 45d | 1 | 0.76mi |
| 9743 Black Gum Willis, TX | 3.0 | 2.0 | 1000 | $1,350 | $1.35 | 4d | 1 | 0.76mi |
| 14190 Green Wing Cir Willis, TX | 3.0 | 2.0 | 1402 | $1,795 | $1.28 | 5d | 1 | 1.46mi |
| 14214 Green Wing Cir Willis, TX | 3.0 | 2.0 | 1200 | $1,950 | $1.62 | 45d | 1 | 1.49mi |
Listing history 15 events
-
2026-06-21days on market $129,900 Active 199 DOM
-
2026-06-18days on market $129,900 Active 196 DOM
-
2026-06-17days on market $129,900 Active 195 DOM
-
2026-06-16days on market $129,900 Active 194 DOM
-
2026-06-15days on market $129,900 Active 193 DOM
-
2026-06-13days on market $129,900 Active 191 DOM
-
2026-06-09days on market $129,900 Active 187 DOM
-
2026-06-08days on market $129,900 Active 186 DOM
-
2026-06-07days on market $129,900 Active 185 DOM
-
2026-06-04days on market $129,900 Active 182 DOM
-
2026-06-03days on market $129,900 Active 181 DOM
-
2026-06-02days on market $129,900 Active 180 DOM
-
2026-06-01days on market $129,900 Active 179 DOM
-
2026-05-31days on market $129,900 Active 178 DOM
-
2025-12-04$129,900 Active 445-char remark
Show marketing remark (445 chars)
Come see why we are living our best life at RockRose Ranch. You can lease or buy a spacious 1266 sq. ft. home with 3 bedrooms, and 2 baths. RockRose Ranch is located in one of the most desirable areas in Willis. Close to great shopping, restaurants, and parks. It is easy to see why our residents live the best life in our neighborhood. Stop by at RockRose Ranch, send us an email, or give us a call. We look forward to connecting with you soon.
ⓘ Source: listings_history table (triggers on properties + properties_extension) + one-shot
backfill from property_details.listing_events for pre-trigger history.
Climate risk First Street
- Flood 1/10 Low FEMA zone X (unshaded) · 0% chance over 30 yrs
- Wildfire 5/10 Major
- Heat 8/10 Severe 7 d/yr ≥111°F today · 25 d/yr by 30 yrs out
- Wind 9/10 Extreme 99% chance of damaging wind over 30 yrs
- Air quality 2/10 Low 1 unhealthy d/yr today · 1 by 30 yrs out
Nearby sold comps map
Loading sold comps map…
Walkable amenities ~0.75 mi
Loading nearby amenities…
Taxation est. · year 1
- Rental income
- $20,997
- − Mortgage interest
- −$7,276
- − Property taxes
- −$1,948
- − Insurance
- −$650
- − Repairs & maintenance
- −$1,680
- − Management
- −$1,680
- − Depreciation
- −$3,779
- Taxable income
- $3,985
- Est. tax owed @ 24.0%
- −$956
- After-tax cash flow
- $4,859/yr
For passive investors: Depreciation is non-cash, so a rental often shows a tax loss while cash-flowing — sheltering income. Rental losses are passive: they offset passive income freely, and up to $25,000/yr can offset ordinary (W-2) income if you actively participate and your MAGI is under $100k (phasing out to $0 by $150k); unused losses carry forward. On sale, claimed depreciation is recaptured at up to 25%, and gains may owe capital-gains tax (a 1031 exchange can defer both). Figures are a year-1 estimate at your 24.0% rate — not tax advice; consult a CPA.
Condition & rehab AI · 0 photos
This manufactured home requires significant repairs and updates to improve its condition and value. Immediate attention to the kitchen, bathrooms, exterior, flooring, and landscaping is recommended.
Repairs flagged
- Major kitchen appliances — Significant wear and tear
- Major bathroom fixtures — Significant wear and tear
- Major exterior paint — Significant wear and tear
- Major flooring — Significant wear and tear
- Major interior paint — Significant wear and tear
- Major landscaping — Overgrown vegetation
Value-add opportunities
- Resale new kitchen appliances — Modern appliances can significantly increase appeal
- Resale new bathroom fixtures — Modern fixtures can significantly increase appeal
- Both exterior paint — Fresh paint can improve curb appeal and resale value
- Both new flooring — New flooring can improve both resale and rental appeal
- Both new interior paint — Fresh paint can improve both resale and rental appeal
- Both landscaping — Well-maintained landscaping can improve both resale and rental appeal
Renovation cost estimate screening
| Repair item | Severity | Est. cost |
|---|---|---|
| kitchen appliances · Significant wear and tear | Major | $15,000–50,000 |
| bathroom fixtures · Significant wear and tear | Major | $15,000–50,000 |
| exterior paint · Significant wear and tear | Major | $15,000–50,000 |
| flooring · Significant wear and tear | Major | $15,000–50,000 |
| interior paint · Significant wear and tear | Major | $15,000–50,000 |
| landscaping · Overgrown vegetation | Major | $15,000–50,000 |
| Total estimated repair cost · 6 items | $90,000–300,000 |
Value-add ROI direction
- Resale new kitchen appliances — Modern appliances can significantly increase appeal ↑
- Resale new bathroom fixtures — Modern fixtures can significantly increase appeal ↑
- Both exterior paint — Fresh paint can improve curb appeal and resale value ↑
- Both new flooring — New flooring can improve both resale and rental appeal ↑
- Both new interior paint — Fresh paint can improve both resale and rental appeal ↑
- Both landscaping — Well-maintained landscaping can improve both resale and rental appeal ↑
ⓘ Cost ranges are severity-bucket heuristics (US national rule-of-thumb). Get contractor quotes + a written scope before underwriting a rehab budget.
Schools (NCES district)
- District
- Willis ISD
- NCES district ID
- 4845900
- Math proficiency
- 33% ▼ -15.00%
- Reading proficiency
- 40% ▼ -2.00%
- Median HH income
- $57,828
- Composite
- 32.32/100
- National rank
- #5746
- State rank
- #458 of 826 in TX
Livability — Willis
- Score
- 62/100
- State rank
- #933
- US rank
- #16579
Category grades
Schools grade is shown separately in the Schools card above.
Census & demographics
- County
- Montgomery County · 663,713 people
- City population
- 38,421
- Metro
- Houston-The Woodlands-Sugar Land, TX
- Population (ZIP)
- 20,792
- Household income
- $92,415
- Rent vs Own
- Severe rent burden
- 279.0
Population outlook (Montgomery County) Hauer SSP2
- Today (2025)
- 713,896 people
- By 2030
- 805,263 · +12.8%
- By 2040
- 992,708 · +39.1%
- By 2050
- 1,179,590 · +65.2%
- By 2075
- 1,628,084 · +128.1%
- By 2100
- 1,937,880 · +171.5%
Race, ethnicity, and origin ACS 2023
- Neighborhood character
- Predominantly White (72%)
- Race & ethnicity
- White 72% Hispanic / Latino 17% Two or more races 14% Black 3%
- Hispanic origin (detail)
- Mexican 12%
- Common ancestry
- Lithuanian 4% Slovak 2% Serbian 2%
- Foreign-born
- 6% · Canada, Jamaica
- Languages at home
- 88% English-only · Spanish 10%
Political lean MEDSL · Montgomery
- 2024 margin
- Solid R (+45.5) · D 26.8% · R 72.3%
- 2008→2024 swing
- +7.2pp toward D · 2008: -52.7pp · 2024: -45.5pp
- All cycles
- 2024: R+45.5 2020: R+43.8 2016: R+51.4 2012: R+60.7 2008: R+52.7
Not yet ingested
- Civics
- —
Market trends
- HPI YoY
- ▼ -114.58%
- Current HPI
- 236.256
- Rent YoY
- ▼ -2.09%
- Metro
- Houston-The Woodlands-Sugar Land, TX
- State GDP YoY
- ▲ 3.95%
- F500 in state
- 110
Industry mix (Fortune 500 HQ in TX)
| Industry | F500 HQs | Revenue |
|---|---|---|
| Energy | 16 | $1,198B |
|
||
| Technology | 5 | $198B |
|
||
| Engineering / Construction | 4 | $72B |
|
||
| Energy Services | 3 | $60B |
|
||
| Utilities | 3 | $41B |
|
||
| Healthcare | 2 | $330B |
|
||
Price history
1 event — show timeline
- 2025-12-04 Listed $129,900 Zillow
Cash-flow waterfall
monthlySold comps — $/sqft
last 12 mo · ≤1 miLoading sold comps…