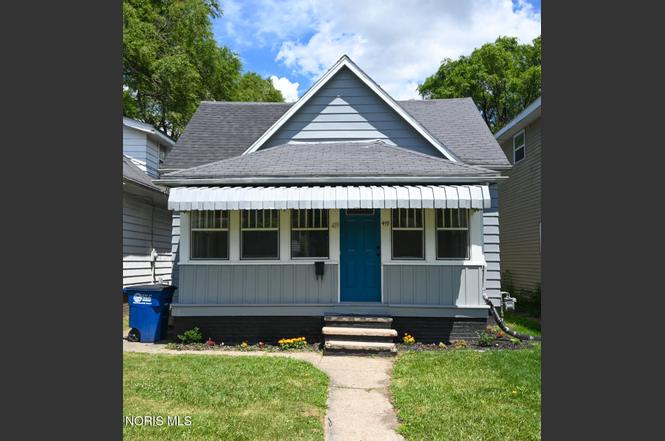
419 E Streicher St · Toledo, OH
Flood risk 1/10 · Minimal
- FEMA flood zone
- X (unshaded)
- Chance of flooding over 30 yrs
- 0.0%
- Est. flood insurance / yr
- $473 – $860
Fire risk 1/10 · Minimal
- Est. fire insurance / yr
- $713 – $1,323
Heat risk 3/10 · Minor
- Hot days now (above 100°F)
- 7 days/yr
- Hot days in 30 yrs
- 16 days/yr
Wind risk 2/10 · Minimal
- Chance of severe wind over 30 yrs
- —
Air-quality risk 2/10 · Minimal
- Unhealthy air days now
- 1 days/yr
- Unhealthy air days in 30 yrs
- 3 days/yr
Risk factors via First Street. Map © Google.
Why this score? — see what drove the C grade
The composite is a weighted blend of 9 inputs, each scored 0–100. Each bar is that input's sub-score; the figure is the points it added to the 100-point composite (weight × sub-score).
- Cash flow +25.0/30.0
- DSCR +8.1/10.0
- ARV discount +7.5/15.0
- 1% rule +6.0/10.0
- Rent growth +3.5/5.0
- Livability +3.3/5.0
- Condition / age +2.5/5.0
- Schools +1.6/10.0
- Appreciation +0.0/10.0
$75,000
🖨 Deal sheet (PDF) 📄 Offer letter ✓ Due diligence
Listing remarks MLS
Great investment opportunity—this property can be purchased individually or as part of a larger parcel package. Ideal for investors looking for a flip or value-add project. Strong potential to renovate, reposition, and build equity quickly. Packaged Parcels: 808 Bartley SFH (0206397), 1401 Foster SFH (0504717), 2010 Airport Triplex (0515444). Asking $141,400.00 for the package.
Key facts
- Quartz countertops
- Private backyard
- Finished basement
Tags
Property features AI
Finance
- HOA & community: Curbs; Street lights; Sidewalks
Exterior
- Parking: Detached 2-car garage; Alley access; On-street parking
- Security: Carbon monoxide detector(s); Fire alarm
- Utilities: Cable available; Electricity available; Natural gas available; Public water; Public sewer; Internet available
- Home design: Single-family house; One story
- Construction: Aluminum siding; Shingle roof; Other foundation
- Exterior features: Awning(s); Enclosed porch; Privacy fencing; Landscaped lot; Garage(s) structure
Interior
- Kitchen: Gas range; Microwave; Refrigerator
- Bedrooms: Bedroom 2 on the main level; Additional bedroom(s) on the main level
- Flooring: Luxury vinyl; Tile
- Bathrooms: 1 full bathroom; 1 half bathroom (1.5 total)
- Heating & cooling: Forced air heating (natural gas); Ceiling fan(s) for cooling; Has heating and cooling
- Interior features: Eat-in kitchen; Pantry; Smart thermostat; Ceiling fan(s); Screens on windows; Door screens; 4 total rooms; Finished full basement (concrete)
- Laundry & utility: Washer hookup in basement; Electric dryer hookup in basement
Neighborhood map
What this means for you Summary
Snapshot
- This is a 2-bed/1.0-bath single-family listed at $75k.
Deal economics
- At list price, monthly cash flow is $163 ($2k/yr) — positive.
- The deal already cash-flows at list — no discount required.
- Meets the 1% rule at list price ($824 rent vs $75k).
Location & tenants
- Location reads 66/100 on livability (#645 in OH) — a middle-class / working-renter tenant base. Strengths: cost of living A+, housing A+, health & safety A+; Watch: amenities C-, crime F, commute F.
- Toledo City (urban): math 15% / reading 24% proficiency, ranked #634 of 656 in OH (top 97%) — low school quality limits family demand, transient renter base, plan for 1-2y turnover; 72% free/reduced lunch — lower-income household profile, screen leases tightly.
- Zoned schools: Sherman Elementary School (math 2% / reading 8%, grade F, #1,554 of 1,584 statewide, top 100%, 293 students, 0% FRL); Woodward High School (math 2% / reading 22%, grade F, #726 of 781 statewide, top 94%, 672 students, 0% FRL) — zoned schools average 0% FRL vs 72% district-wide (72 pts lower); this property's tenant base skews higher-income than the district average.
- Market conditions: Rents rising (+3.9%/yr); 59 active listings in the ZIP; 4 comparable units currently listed for rent nearby; rentals at typical pace (median 25d on market — plan ~3-4 weeks tenant-placement turnaround); lower-income renter base — watch delinquency; 415 units permitted in Lucas County in 2024 (122 in 5+ unit buildings).
- This rent runs 34% of the median local income ($29k/yr) — at the standard rent-burdened threshold; future hikes will face affordability resistance.
Forward outlook
- Local home prices are declining (-3.0%/yr); year-one equity from $519 of loan paydown is wiped out by about $2k of value loss. Plan a longer hold.
- Lucas County population projected at -16% by 2050 — secular population decline; favor cash flow + early exit over multi-decade hold.
- At projected returns (-3.0% appreciation + 3.9% rent growth), your $21k cash investment doubles in ~10 years — after that, you're playing with house money.
Negotiation context
- Only 4 days on market — expect competitive offers; lowballing is unlikely to land.
- 2 sale attempts with the ask held roughly flat each time — persistent listings suggest the price (not the market) is what's stuck; bring a comps-based counter.
- Current owner paid $18k; list at $75k implies a 329% gain — meaningful room to come down on a strong offer.
Risks & watch-outs
- Watch-outs: built in 1913 — expect roof / HVAC / electrical / plumbing capex.
Questions for the listing agent
- Built in 1913 — when were the roof, HVAC, electrical panel, plumbing, and water heater last replaced?
- Is there a deadline driving the sale (1031 exchange, divorce, estate, relocation)? That informs how much negotiation room exists.
- Schools are D-rated, which usually means shorter tenancies and higher turnover. Who's the typical renter profile here, and what's been the actual vacancy rate?
- Crime grade is F in this area — have there been break-ins, vandalism, or insurance claims at this property in the last 3 years? What carrier currently insures it and at what premium?
- What's the average days-on-market for RENTAL listings here right now (not sales)? A rising rental-DOM trend means longer vacancies and softer asking-rent achievability than the comps imply.
- What's the recent tenant-quality profile in this submarket — average credit score on applications, eviction rate, late-payment / NSF rate, and stable-employment percentage? A property-management company in the area should have these aggregated.
- How much new for-sale + rental construction is in the pipeline within 1–3 miles? Heavy new supply typically softens prices + rents 12–24 months out; constrained supply supports both.
Investment metrics
- 1% rule
- 1.10% ✓
- Cap rate
- 8.90%
- Cash-on-cash
- 9.30%
- DSCR
- 1.41
- GRM
- 7.6
CMA / ARV
- ARV (on-the-fly)
- $28,224
- Comps found
- 10
Show comp detail 10 sales within ~0.75 mi
| Address | Dist | Beds/Ba | Sqft | Sold | Price | $/sf | Match |
|---|---|---|---|---|---|---|---|
| 419 E Streicher St | 0.00mi | 2/1.0 | 672 (0%) | 6mo | $17,500 | $26 | 95 |
| 703 Ashwood Ave | 0.52mi | 2/1.0 | 680 (+1%) | 1mo | $36,000 | $53 | 73 |
| 3245 Elm St | 0.10mi | 2/1.0 | 756 (+12%) | 3mo | $33,000 | $44 | 72 |
| 3560 Wersell Ave | 0.47mi | 2/1.0 | 660 (-2%) | 18mo | $75,000 | $114 | 60 |
| 326 Bronson Ave | 0.25mi | 2/1.0 | 740 (+10%) | 14mo | $28,000 | $38 | 60 |
| 3154 Elm St | 0.04mi | 1/1.0 (-1) | 592 (-12%) | 19mo | $25,000 | $42 | 58 |
| 246 E Manhattan Blvd | 0.47mi | 2/1.0 | 732 (+9%) | 14mo | $77,500 | $106 | 52 |
| 30 W Oakland St | 0.62mi | 1/1.0 (-1) | 730 (+9%) | 7mo | $28,000 | $38 | 46 |
| 34 E Streicher St | 0.48mi | 2/1.0 | 760 (+13%) | 17mo | $25,000 | $33 | 42 |
| 1142 Page St | 0.74mi | 1/1.0 (-1) | 772 (+15%) | 12mo | $19,500 | $25 | 25 |
Match score weights: distance 35% · size 25% · config 20% · recency 20%. Top-matched comps best support the ARV.
Projected returns pro-forma
-3.0% appreciation · 3.89% rent growth · sell at horizon
- IRR
- -1.3%
- Equity multiple
- 0.95×
- Total profit
- $-1,051
- Equity at exit
- $11,183
- IRR
- 9.3%
- Equity multiple
- 1.74×
- Total profit
- $15,517
- Equity at exit
- $6,485
Cash invested: $21,000 (down + closing). Projections, not guarantees.
Landlord ↔ Tenant lean methodology
- Overall (STATE)
- 73 Landlord-Friendly
- State Ohio
- 73 Landlord-Friendly · R+6
- County
- — inherits STATE
- City
- — inherits STATE
ZIP-level market 43608
- Home prices YoY
- -21.3%
- Rents YoY
- 3.9%
- Active inventory
- 59
- Price-to-rent
- 7.6×
Monthly cashflow live
- Estimated rent
- $824 medium interval (Pro) →
- Mortgage (P&I)
- −$393
- Tax from tax record
- −$64 /mo · $767/yr
- Insurance
- −$31
- HOA
- −$0
- Vacancy / Maint / Mgmt
- −$173
- Net cashflow
- $163
Break-even live
Sensitivity live
| Price | -10% $205 | -5% $184 | +0% $163 | +5% $141 | +10% $120 |
|---|---|---|---|---|---|
| Rent | -10% $98 | -5% $130 | +0% $163 | +5% $195 | +10% $228 |
| Rate | -1.0pp $200 | -0.5pp $182 | base $163 | +0.5pp $143 | +1.0pp $124 |
UW: 25.0% down · 7.5% · 30yr · 1.5% tax · 5.0% vac · 8.0% maint · 8.0% mgmt
Financing live
Cash to close
- Down payment
- $18,750
- Closing costs
- $2,250
- Reserves months
- —
- Total cash needed
- —
Loan-product check · same deal, 3 products live
Conventional
25% down · 7.5% · 30yr
- Down + closing
- —
- Monthly P&I
- —
- Monthly cashflow
- —
- DSCR
- —
- Eligible?
- —
Personal DTI + credit; lowest rate.
DSCR
20% down · 8.5% · 30yr
- Down + closing
- —
- Monthly P&I
- —
- Monthly cashflow
- —
- DSCR
- —
- Eligible?
- —
No personal income docs; deal must DSCR.
Hard money
10% down · 12.0% · 12mo
- Down + closing
- —
- Monthly P&I
- —
- Monthly cashflow
- —
- DSCR
- —
- Eligible?
- —
Short-term bridge; refi at stabilization.
Rent comps 4 comps
| Address | Beds | Baths | Sqft | Rent | $/sqft | DOM | Units | Dist |
|---|---|---|---|---|---|---|---|---|
| 340 E Lake St Toledo, OH | 2.0 | 1.0 | 683 | $775 | $1.13 | 25d | 1 | 0.30mi |
| 2807 Chestnut St Unit 2 Toledo, OH | 1.0 | 1.0 | 745 | $495 | $0.66 | 23d | 1 | 0.38mi |
| 3474 Maher St Toledo, OH | 2.0 | 1.0 | 736 | $1,125 | $1.53 | 45d | 1 | 0.84mi |
| 426 Beacon St Toledo, OH | 1.0–2.0 | 1.0–1.5 | 809 | $882 | $1.09 | 15d | 10 | 1.31mi |
Listing history 3 events
-
2026-06-21days on market $75,000 Active 4 DOM
-
2026-06-18remarks 699-char remark
-
2026-06-18$75,000 Active 1 DOM
ⓘ Source: listings_history table (triggers on properties + properties_extension) + one-shot
backfill from property_details.listing_events for pre-trigger history.
Tax reassessment forecast OH · Partial reset (capped growth)
- Current annual tax
- $767 · $64/mo
- Projected year-2 tax
- $969 · $81/mo
- Expected delta
- +$201/yr (+$17/mo · 26.2%)
ⓘ Screening estimate from a state-policy table — verify with the county assessor before closing.
Climate risk First Street
- Flood 1/10 Low FEMA zone X (unshaded) · 0% chance over 30 yrs
- Wildfire 1/10 Low
- Heat 3/10 Moderate 7 d/yr ≥100°F today · 16 d/yr by 30 yrs out
- Wind 2/10 Low
- Air quality 2/10 Low 1 unhealthy d/yr today · 3 by 30 yrs out
Nearby sold comps map
Loading sold comps map…
Walkable amenities ~0.75 mi
Loading nearby amenities…
Taxation est. · year 1
- Rental income
- $9,892
- − Mortgage interest
- −$4,201
- − Property taxes
- −$767
- − Insurance
- −$375
- − Repairs & maintenance
- −$791
- − Management
- −$791
- − Depreciation
- −$2,182
- Taxable income
- $784
- Est. tax owed @ 24.0%
- −$188
- After-tax cash flow
- $1,764/yr
For passive investors: Depreciation is non-cash, so a rental often shows a tax loss while cash-flowing — sheltering income. Rental losses are passive: they offset passive income freely, and up to $25,000/yr can offset ordinary (W-2) income if you actively participate and your MAGI is under $100k (phasing out to $0 by $150k); unused losses carry forward. On sale, claimed depreciation is recaptured at up to 25%, and gains may owe capital-gains tax (a 1031 exchange can defer both). Figures are a year-1 estimate at your 24.0% rate — not tax advice; consult a CPA.
Schools (NCES district)
- District
- Toledo City
- NCES district ID
- 3904490
- Math proficiency
- 15% ▼ -16.00%
- Reading proficiency
- 24% ▼ -13.00%
- Median HH income
- $32,137
- Composite
- 15.76/100
- National rank
- #9276
- State rank
- #634 of 656 in OH
Livability — Toledo
- Score
- 66/100
- State rank
- #645
- US rank
- #11442
Category grades
Schools grade is shown separately in the Schools card above.
Census & demographics
- Census place
- Toledo, OH
- County
- Lucas County · 380,724 people
- City population
- 280,811
- Metro
- Toledo, OH
- Population (ZIP)
- 13,593
- Household income
- $29,275
- Rent vs Own
- Severe rent burden
- 911.0
Population outlook (Lucas County) Hauer SSP2
- Today (2025)
- 420,751 people
- By 2030
- 410,187 · -2.5%
- By 2040
- 384,019 · -8.7%
- By 2050
- 355,125 · -15.6%
- By 2075
- 291,683 · -30.7%
- By 2100
- 233,670 · -44.5%
Race, ethnicity, and origin ACS 2023
- Neighborhood character
- Diverse neighborhood (Simpson 0.60)
- Race & ethnicity
- Black 57% White 25% Two or more races 9% Hispanic / Latino 8% Asian 2%
- Hispanic origin (detail)
- Mexican 4%
- Common ancestry
- Romanian 4% Lithuanian 2% Slovak 1%
- Foreign-born
- 4% · Canada, China
- Languages at home
- 91% English-only · Spanish 7%
Political lean MEDSL · Lucas
- 2024 margin
- D (+12.6) · D 55.8% · R 43.2%
- 2008→2024 swing
- -18.9pp toward R · 2008: 31.4pp · 2024: 12.6pp
- All cycles
- 2024: D+12.6 2020: D+16.8 2016: D+17.4 2012: D+30.4 2008: D+31.4
Not yet ingested
- Civics
- —
Market trends
- HPI YoY
- ▼ -37.73%
- Current HPI
- 139.4964
- Rent YoY
- ▲ 3.89%
- Metro
- Toledo, OH
- State GDP YoY
- ▲ 1.98%
- F500 in state
- 48
Industry mix (Fortune 500 HQ in OH)
| Industry | F500 HQs | Revenue |
|---|---|---|
| Insurance | 3 | $145B |
|
||
| Industrial Machinery | 3 | $49B |
|
||
| Financial Services | 3 | $24B |
|
||
| Consumer Goods | 2 | $93B |
|
||
| Aerospace / Defense | 2 | $47B |
|
||
| Utilities | 2 | $33B |
|
||
Price history
+383.9% since first listed5 events — show timeline
- 2026-06-17 Listed $75,000 NORIS
- 2026-01-08 Sold (MLS) $17,500 NORIS
- 2025-12-28 Pending — NORIS
- 2025-11-21 Listed $22,600 NORIS
- 1989-02-24 Sold (Public Records) $15,500 Public Records
Property tax history
+3.1%/yrLatest (2025): $767 · +2.1% YoY. Source: county tax records.
Cash-flow waterfall
monthlySold comps — $/sqft
last 12 mo · ≤1 miLoading sold comps…