7681 Timber Riv · Azalea Park, FL
Flood risk 1/10 · Minimal
- FEMA flood zone
- X (unshaded)
- Chance of flooding over 30 yrs
- 0.0%
- Est. flood insurance / yr
- $507 – $1,088
Fire risk 1/10 · Minimal
- Est. fire insurance / yr
- $947 – $1,759
Heat risk 9/10 · Severe
- Hot days now (above 108°F)
- 7 days/yr
- Hot days in 30 yrs
- 22 days/yr
Wind risk 9/10 · Severe
- Chance of severe wind over 30 yrs
- 99.0%
Air-quality risk 2/10 · Minimal
- Unhealthy air days now
- 0 days/yr
- Unhealthy air days in 30 yrs
- 1 days/yr
Risk factors via First Street. Map © Google.
Why this score? — see what drove the C+ grade
The composite is a weighted blend of 9 inputs, each scored 0–100. Each bar is that input's sub-score; the figure is the points it added to the 100-point composite (weight × sub-score).
- Cash flow +26.3/30.0
- DSCR +8.9/10.0
- ARV discount +7.5/15.0
- 1% rule +5.9/10.0
- Schools +4.1/10.0
- Livability +4.0/5.0
- Rent growth +3.2/5.0
- Condition / age +2.5/5.0
- Appreciation +0.0/10.0
$150,000
🖨 Deal sheet 📄 Offer letter ✓ Due diligence
Listing remarks
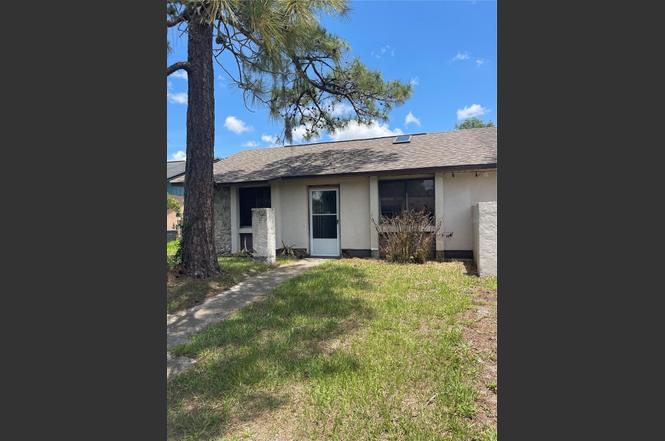
Under contract-accepting backup offers. Excellent investor opportunity in Orlando! This two-bedroom, two-bath half duplex offers great potential for renovation and value-add improvements. Major updates have already been completed, including a new roof (2023), air conditioner (2018) and water heater (2025). Inside, you'll find vaulted ceilings, an open floor plan and plenty of natural light. The fenced backyard overlooks a peaceful lake, providing a scenic setting rarely found at this price point. With no HOA, you'll enjoy added flexibility and fewer restrictions. Conveniently near the University of Central Florida, Valencia College East Campus, Advent Health, shopping, dining and major road
Key facts
- Built 1985
Property features AI
Finance
- Other: Zoned R-2
- Financial info: Homesteaded
- HOA & community: No association
Exterior
- Parking: Paved asphalt/concrete road access
- Utilities: Public water; Septic tank sewer; Other utilities
- Home design: Residential half-duplex; Attached property; One story; South-facing; Fixer condition
- Construction: Block construction; Shingle roof; Slab foundation; Built area approximately 949 square feet
- Exterior features: Patio; Sidewalk; Sliding doors; Outside storage; Chain link fencing; Mature landscaping
Interior
- Kitchen: Other appliance(s)
- Bedrooms: 2 bedrooms
- Flooring: Concrete flooring
- Bathrooms: 2 full bathrooms
- Heating & cooling: Central heating (electric); Central air conditioning
- Interior features: Ceiling fans; High ceilings; Skylight(s); Great room
- Laundry & utility: Laundry room
Neighborhood map
What this means for you Summary
Snapshot
- This is a 2-bed/2.0-bath townhouse listed at $150k.
Deal economics
- At list price, monthly cash flow is $385 ($5k/yr) — positive.
- The deal already cash-flows at list — no discount required.
- Meets the 1% rule at list price ($2k rent vs $150k).
- Cap rate 9.4% vs local median 4.0% in Azalea Park — top-decile yield for the area; either an underpriced asset or a hidden risk that comps aren't pricing in. Stress-test before assuming the spread holds.
Location & tenants
- Location reads 79/100 on livability (#144 in FL, #2,148 nationally) — a middle-class / working-renter tenant base. Strengths: commute A+, cost of living A+, housing A+; Watch: amenities F, employment D-.
- Orange (suburban): math 46% / reading 51% proficiency, ranked #43 of 73 in FL (top 59%) — families likely to look elsewhere, expect single-tenant / working-renter base with shorter leases.
- Zoned schools: Forsyth Woods Elementary (math 31% / reading 35%, grade F, #1,773 of 2,144 statewide, top 83%, 476 students, 81% FRL); Colonial High (math 16% / reading 33%, grade F, #505 of 667 statewide, top 79%, 3,442 students, 62% FRL).
- Zoned-school proficiency averages 29% at this address vs 48% district-wide (-20 pts) — the specific schools serving this property underperform the Orange average; the district grade overstates school quality for this exact location.
- Market conditions: Rents rising (+2.6%/yr); 172 active listings in the ZIP; 21 comparable units currently listed for rent nearby; rentals leasing fast (median 8d on market — plan ~1-2 weeks tenant-placement turnaround); 8,053 units permitted in Orange County in 2024 (3,133 in 5+ unit buildings).
- This rent runs 33% of the median local income ($60k/yr) — at the standard rent-burdened threshold; future hikes will face affordability resistance.
Forward outlook
- Local home prices are declining (-3.0%/yr); year-one equity from $1k of loan paydown is wiped out by about $4k of value loss. Plan a longer hold.
- Orange County population projected at +52% by 2050 — long-run rental-demand tailwind backs the buy-and-hold thesis.
Negotiation context
- Only 1 days on market — expect competitive offers; lowballing is unlikely to land.
- Current owner paid $79k; list at $150k implies a 90% gain — meaningful room to come down on a strong offer.
Risks & watch-outs
- Climate carrying-cost: severe wind risk, 99% chance of damaging wind over 30y; extreme-heat days projected 7→22/yr by 2055 (HVAC capex compounding) — expect insurance premiums to compound above CPI over the hold.
Questions for the listing agent
- Is there a deadline driving the sale (1031 exchange, divorce, estate, relocation)? That informs how much negotiation room exists.
- Schools are B-rated — typically a magnet for longer-tenancy family renters. What's the average tenant stay here, and is there a school-zone premium baked into asking?
- What's the average days-on-market for RENTAL listings here right now (not sales)? A rising rental-DOM trend means longer vacancies and softer asking-rent achievability than the comps imply.
- What's the recent tenant-quality profile in this submarket — average credit score on applications, eviction rate, late-payment / NSF rate, and stable-employment percentage? A property-management company in the area should have these aggregated.
- How much new for-sale + rental construction is in the pipeline within 1–3 miles? Heavy new supply typically softens prices + rents 12–24 months out; constrained supply supports both.
Investment metrics
- 1% rule
- 1.09% ✓
- Cap rate
- 9.38%
- Cash-on-cash
- 11.01%
- DSCR
- 1.49
- GRM
- 7.6
CMA / ARV
No comps found within radius.
Projected returns pro-forma
-3.0% appreciation · 2.6% rent growth · sell at horizon
- IRR
- -0.3%
- Equity multiple
- 0.99×
- Total profit
- $-472
- Equity at exit
- $22,365
- IRR
- 9.0%
- Equity multiple
- 1.67×
- Total profit
- $28,304
- Equity at exit
- $12,969
Cash invested: $42,000 (down + closing). Projections, not guarantees.
Landlord ↔ Tenant lean methodology
- Overall (STATE)
- 87 Strongly Landlord-Friendly
- State Florida
- 87 Strongly Landlord-Friendly · R+3
- County
- — inherits STATE
- City
- — inherits STATE
ZIP-level market 32807
- Home prices YoY
- -20.1%
- Rents YoY
- 2.6%
- Active inventory
- 172
- Price-to-rent
- 7.6×
Monthly cashflow live
- Estimated rent
- $1,641 high interval (Pro) →
- Mortgage (P&I)
- −$787
- Tax from tax record
- −$62 /mo · $742/yr
- Insurance
- −$62
- HOA
- −$0
- Vacancy / Maint / Mgmt
- −$345
- Net cashflow
- $385
Break-even live
UW: 25.0% down · 7.5% · 30yr · 1.5% tax · 5.0% vac · 8.0% maint · 8.0% mgmt
Financing live
Cash to close
- Down payment
- $37,500
- Closing costs
- $4,500
- Reserves months
- —
- Total cash needed
- —
Loan-product check · same deal, 3 products live
Conventional
25% down · 7.5% · 30yr
- Down + closing
- —
- Monthly P&I
- —
- Monthly cashflow
- —
- DSCR
- —
- Eligible?
- —
Personal DTI + credit; lowest rate.
DSCR
20% down · 8.5% · 30yr
- Down + closing
- —
- Monthly P&I
- —
- Monthly cashflow
- —
- DSCR
- —
- Eligible?
- —
No personal income docs; deal must DSCR.
Hard money
10% down · 12.0% · 12mo
- Down + closing
- —
- Monthly P&I
- —
- Monthly cashflow
- —
- DSCR
- —
- Eligible?
- —
Short-term bridge; refi at stabilization.
Rent comps 21 comps
| Address | Beds | Baths | Sqft | Rent | $/sqft | DOM | Units | Dist |
|---|---|---|---|---|---|---|---|---|
| 7451 Gatehouse Cir Orlando, FL | 2.0–3.0 | 2.0 | 1050 | $1,436 | $1.37 | 23d | 4 | 0.19mi |
| 7909 Richwood Dr Orlando, FL | 2.0 | 2.0 | 936 | $1,950 | $2.08 | 21d | 1 | 0.36mi |
| 949 Crowsnest Cir Orlando, FL | 1.0–2.0 | 1.0–2.0 | 822 | $1,754 | $2.13 | 1d | 31 | 0.44mi |
| 7595 Sun Tree Cir Orlando, FL | 1.0–2.0 | 1.0–2.0 | 744 | $1,844 | $2.48 | 2d | 13 | 0.46mi |
| 7325 Goldenpointe Blvd Orlando, FL | 1.0–3.0 | 1.0–2.0 | 1050 | $1,689 | $1.61 | 7d | 9 | 0.54mi |
| 8203 Sun Spring Cir #62 Orlando, FL | 1.0 | 1.0 | 926 | $1,300 | $1.40 | 23d | 1 | 0.57mi |
| 8215 Sun Spring Cir #23 Orlando, FL | 2.0 | 2.0 | 1064 | $1,550 | $1.46 | 21d | 1 | 0.59mi |
| 8205 Sun Spring Cir Unit B1 Orlando, FL | 1.0 | 1.0 | 764 | $1,300 | $1.70 | 23d | 1 | 0.63mi |
| 8211 Sun Spring Cir #41 Orlando, FL | 2.0 | 2.0 | 1064 | $1,499 | $1.41 | 4d | 1 | 0.66mi |
| 604 Laurel Cove Ct Orlando, FL | 1.0–3.0 | 1.0–2.0 | 892 | $1,698 | $1.90 | 1d | 15 | 0.76mi |
| 1220 Linda Ln Azalea Park, FL | 2.0 | 1.0 | 813 | $1,195 | $1.47 | 7d | 1 | 0.81mi |
| 1000 Avida Village Cir Orlando, FL | 1.0–3.0 | 1.0–2.0 | 977 | $2,004 | $2.05 | 1d | 22 | 0.94mi |
| 8225 Claire Ann Dr #203 Orlando, FL | 2.0 | 2.0 | 1046 | $1,725 | $1.65 | 3d | 1 | 0.99mi |
| 800 Lombard St Orlando, FL | 1.0–3.0 | 1.0–2.0 | 1002 | $2,110 | $2.11 | 1d | 7 | 0.99mi |
| 8103 Lillies Way #107 Orlando, FL | 2.0 | 2.0 | 1000 | $1,600 | $1.60 | 7d | 1 | 1.00mi |
| 8137 Claire Ann Dr #207 Orlando, FL | 2.0 | 2.0 | 1046 | $1,750 | $1.67 | 21d | 1 | 1.03mi |
| 7960 Pine Crossings Cir Orlando, FL | 1.0–2.0 | 1.0–2.0 | 870 | $1,911 | $2.20 | 1d | 30 | 1.10mi |
| 1124 Crosstown Way Orlando, FL | 1.0–3.0 | 1.0–2.0 | 1104 | $2,223 | $2.01 | 1d | 10 | 1.22mi |
| 908 Tucker Ave Orlando, FL | 2.0 | 1.0 | 912 | $1,550 | $1.70 | 7d | 1 | 1.22mi |
| 6003 Oleander Dr Orlando, FL | 2.0 | 1.5 | 900 | $1,700 | $1.89 | 23d | 1 | 1.42mi |
| 6635 Breeze Way Orlando, FL | 1.0–2.0 | 1.0–2.0 | 855 | $1,550 | $1.81 | 4d | 1 | 1.50mi |
Listing history 2 events
-
2026-06-17remarks 699-char remark
-
2026-06-17$150,000 Pending 1 DOM
ⓘ Source: listings_history table (triggers on properties + properties_extension) + one-shot
backfill from property_details.listing_events for pre-trigger history.
Tax reassessment forecast FL · Resets to sale price
- Current annual tax
- $742 · $62/mo
- Projected year-2 tax
- $1,245 · $104/mo
- Expected delta
- +$503/yr (+$42/mo · 67.7%)
ⓘ Screening estimate from a state-policy table — verify with the county assessor before closing.
Climate risk First Street
- Flood 1/10 Low FEMA zone X (unshaded) · 0% chance over 30 yrs
- Wildfire 1/10 Low
- Heat 9/10 Extreme 7 d/yr ≥108°F today · 22 d/yr by 30 yrs out
- Wind 9/10 Extreme 99% chance of damaging wind over 30 yrs
- Air quality 2/10 Low 0 unhealthy d/yr today · 1 by 30 yrs out
Nearby sold comps map
Loading sold comps map…
Walkable amenities ~0.75 mi
Loading nearby amenities…
Taxation est. · year 1
- Rental income
- $19,692
- − Mortgage interest
- −$8,402
- − Property taxes
- −$742
- − Insurance
- −$750
- − Repairs & maintenance
- −$1,575
- − Management
- −$1,575
- − Depreciation
- −$4,364
- Taxable income
- $2,283
- Est. tax owed @ 24.0%
- −$548
- After-tax cash flow
- $4,077/yr
For passive investors: Depreciation is non-cash, so a rental often shows a tax loss while cash-flowing — sheltering income. Rental losses are passive: they offset passive income freely, and up to $25,000/yr can offset ordinary (W-2) income if you actively participate and your MAGI is under $100k (phasing out to $0 by $150k); unused losses carry forward. On sale, claimed depreciation is recaptured at up to 25%, and gains may owe capital-gains tax (a 1031 exchange can defer both). Figures are a year-1 estimate at your 24.0% rate — not tax advice; consult a CPA.
Schools (NCES district)
- District
- Orange
- NCES district ID
- 1201440
- Math proficiency
- 46% ▼ -9.00%
- Reading proficiency
- 51% ▼ -2.00%
- Median HH income
- $49,350
- Composite
- 41.47/100
- National rank
- #3461
- State rank
- #43 of 73 in FL
Livability — Azalea Park
- Score
- 79/100
- State rank
- #144
- US rank
- #2148
Category grades
Schools grade is shown separately in the Schools card above.
Census & demographics
- County
- Orange County · 1,471,359 people
- City population
- 34,933
- Metro
- Orlando-Kissimmee-Sanford, FL
- Population (ZIP)
- 34,456
- Household income
- $59,971
- Rent vs Own
- Severe rent burden
- 1566.0
Population outlook (Orange County) Hauer SSP2
- Today (2025)
- 1,618,226 people
- By 2030
- 1,787,404 · +10.5%
- By 2040
- 2,125,621 · +31.4%
- By 2050
- 2,454,016 · +51.6%
- By 2075
- 3,173,711 · +96.1%
- By 2100
- 3,607,781 · +122.9%
Race, ethnicity, and origin ACS 2023
- Neighborhood character
- Majority Hispanic (62%)
- Race & ethnicity
- Hispanic / Latino 62% White 25% Two or more races 24% Black 6% Asian 4%
- Hispanic origin (detail)
- Mexican 6% Puerto Rican 28% Cuban 7% Dominican 5%
- Common ancestry
- Romanian 1% Slovak 1% Lithuanian 1%
- Foreign-born
- 26% · Canada, Jamaica, Vietnam
- Languages at home
- 44% English-only · Spanish 52% Vietnamese 2% Other Indo-European 1%
Political lean MEDSL · Orange
- 2024 margin
- D (+13.6) · D 56.1% · R 42.5% · Other 1.3%
- 2008→2024 swing
- -5.0pp toward R · 2008: 18.6pp · 2024: 13.6pp
- All cycles
- 2024: D+13.6 2020: D+23.1 2016: D+24.6 2012: D+18.2 2008: D+18.6
Not yet ingested
- Civics
- —
Market trends
- HPI YoY
- ▼ -97.72%
- Current HPI
- 388.4089
- Rent YoY
- ▲ 2.60%
- Metro
- Orlando-Kissimmee-Sanford, FL
- State GDP YoY
- ▲ 3.28%
- F500 in state
- 36
Industry mix (Fortune 500 HQ in FL)
| Industry | F500 HQs | Revenue |
|---|---|---|
| Industrial Technology | 2 | $29B |
|
||
| Insurance | 2 | $17B |
|
||
| Retail | 1 | $60B |
|
||
| Technology Distribution | 1 | $58B |
|
||
| Homebuilding | 1 | $35B |
|
||
| Technology Manufacturing | 1 | $35B |
|
||
Price history
+194.7% since first listed4 events — show timeline
- 2026-06-16 Pending — Stellar MLS as Distributed by MLS Grid
- 2026-06-16 Listed $150,000 Stellar MLS as Distributed by MLS Grid
- 2003-10-06 Sold (Public Records) $79,000 Public Records
- 1985-12-01 Sold (Public Records) $50,900 Public Records
Property tax history
+4.6%/yrLatest (2025): $742 · +18.8% YoY. Source: county tax records.
Cash-flow waterfall
monthlySold comps — $/sqft
last 12 mo · ≤1 miLoading sold comps…