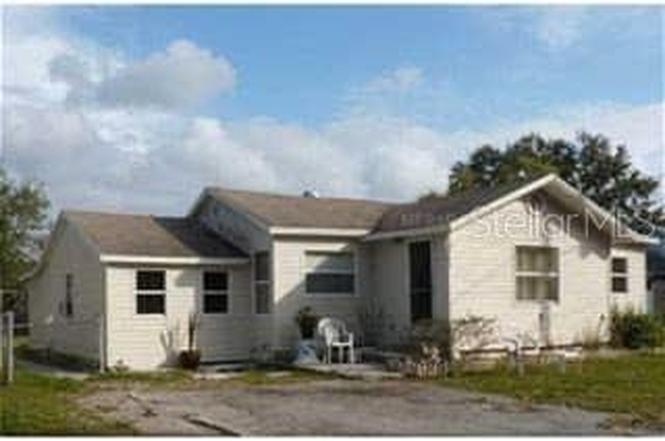
2505 3rd St E · West Samoset, FL
Flood risk 1/10 · Minimal
- FEMA flood zone
- X (unshaded)
- Chance of flooding over 30 yrs
- 0.0%
- Est. flood insurance / yr
- $507 – $1,088
Fire risk 1/10 · Minimal
- Est. fire insurance / yr
- $947 – $1,759
Heat risk 10/10 · Severe
- Hot days now (above 107°F)
- 7 days/yr
- Hot days in 30 yrs
- 30 days/yr
Wind risk 10/10 · Severe
- Chance of severe wind over 30 yrs
- 99.0%
Air-quality risk 3/10 · Minor
- Unhealthy air days now
- 2 days/yr
- Unhealthy air days in 30 yrs
- 2 days/yr
Risk factors via First Street. Map © Google.
Why this score? — see what drove the D- grade
The composite is a weighted blend of 9 inputs, each scored 0–100. Each bar is that input's sub-score; the figure is the points it added to the 100-point composite (weight × sub-score).
- Cash flow +15.6/30.0
- DSCR +4.8/10.0
- Schools +4.4/10.0
- 1% rule +3.7/10.0
- Livability +3.6/5.0
- Condition / age +2.5/5.0
- ARV discount +1.8/15.0
- Rent growth +1.1/5.0
- Appreciation +0.0/10.0
$199,000
🖨 Deal sheet (PDF) 📄 Offer letter ✓ Due diligence
Listing remarks MLS
Cute and nicely maintained 2 bedroom, 2 one bath with tenant in place. Great investment with immediate income. Buyer to confirm all data, room sizes, taxes, utilities.
Key facts
- 6,159 sq ft lot
- Built 1949
- Listed 104 days
Property features AI
Finance
- Other: Zoning: RSF6; Total number of units: 2 (one 2-bedroom unit and one 1-bedroom unit); Unit breakdown: one 2-bedroom/1-bath unit and one 1-bedroom/1-bath unit
- Financial info: Annual net income reported: $31,200
- HOA & community: No association
Exterior
- Utilities: Public water; Public sewer; Public utilities
- Home design: Duplex (Residential Income); Single building (one structure); 0.14-acre lot (approx. 55 x 112); Less than 1/4 acre
- Construction: Vinyl siding and frame construction; Built-up, shingle and other roof types; Crawlspace and slab foundation; Built area approximately 1,400 sq ft (public records)
- Exterior features: Fenced yard; Paved road frontage
Interior
- Kitchen: Appliances not specified
- Bedrooms: Total of 3 bedrooms
- Bathrooms: Includes full bathrooms (unit-level counts available)
- Heating & cooling: Ductless heating; Wall/Window cooling units
- Interior features: Other
- Laundry & utility: Laundry located inside
Neighborhood map
What this means for you Summary
Snapshot
- This is a 2-bed/1.0-bath single-family listed at $199k.
Deal economics
- At list price, monthly cash flow is $83 ($998/yr) — positive.
- The deal already cash-flows at list — no discount required.
- To meet the 1% rule (rent ≥ 1% of price), the offer needs to be $173k (13.3% below list).
- Recommended offer: $173k (13.3% below list) — sets the bar for 1% rule.
- Cap rate 6.8% vs local median 4.9% in West Samoset — top-decile yield for the area; either an underpriced asset or a hidden risk that comps aren't pricing in. Stress-test before assuming the spread holds.
Location & tenants
- Location reads 72/100 on livability (#342 in FL) — a middle-class / working-renter tenant base. Strengths: cost of living A+, housing A+, health & safety A+; Watch: amenities F, commute F, employment F.
- Manatee (suburban): math 54% / reading 50% proficiency, ranked #26 of 73 in FL (top 36%) — acceptable for families but not a draw, mixed tenant base, ~2y average lease.
- Zoned schools: G D Rogers Garden- Bullock Elementary (math 28% / reading 25%, grade F, #2,009 of 2,144 statewide, top 94%, 504 students, 78% FRL); W. D. Sugg Middle School (math 34% / reading 28%, grade F, #462 of 571 statewide, top 81%, 1,010 students, 72% FRL); Southeast High School (math 25% / reading 34%, grade F, #447 of 667 statewide, top 68%, 1,716 students, 66% FRL) — zoned schools average 72% FRL vs 51% district-wide (21 pts higher); higher-poverty schools than district average — tighter screening recommended.
- Zoned-school proficiency averages 29% at this address vs 52% district-wide (-23 pts) — the specific schools serving this property underperform the Manatee average; the district grade overstates school quality for this exact location.
- Market conditions: Rents falling (-5.4%/yr); 351 active listings in the ZIP; 40 comparable units currently listed for rent nearby; rentals at typical pace (median 26d on market — plan ~3-4 weeks tenant-placement turnaround); 7,472 units permitted in Manatee County in 2024 (1,782 in 5+ unit buildings).
Forward outlook
- Local home prices are declining (-3.0%/yr); year-one equity from $1k of loan paydown is wiped out by about $6k of value loss. Plan a longer hold.
- Manatee County population projected at +43% by 2050 — long-run rental-demand tailwind backs the buy-and-hold thesis.
Negotiation context
- It's been on market 104 days — a 9% lower offer ($181k) is reasonable based on typical stale-listing flexibility.
- 5 sale attempts since 21y ago with the ask held roughly flat each time — persistent listings suggest the price (not the market) is what's stuck; bring a comps-based counter.
- Current owner paid $85k; list at $199k implies a 134% gain — meaningful room to come down on a strong offer.
Risks & watch-outs
- Watch-outs: built in 1949 — expect roof / HVAC / electrical / plumbing capex.
- Climate carrying-cost: severe wind risk, 99% chance of damaging wind over 30y; extreme-heat days projected 7→30/yr by 2055 (HVAC capex compounding) — expect insurance premiums to compound above CPI over the hold.
Questions for the listing agent
- It's been on market 104 days. Have you received any prior offers? Is the seller open to a 13% concession, seller financing, or rate buy-down credit?
- Built in 1949 — when were the roof, HVAC, electrical panel, plumbing, and water heater last replaced?
- Why hasn't it sold? Are there any deal-killer items the seller is aware of (foundation, flood, title, zoning, code violations)?
- Is there a deadline driving the sale (1031 exchange, divorce, estate, relocation)? That informs how much negotiation room exists.
- Schools are B-rated — typically a magnet for longer-tenancy family renters. What's the average tenant stay here, and is there a school-zone premium baked into asking?
- The area grade is low — what's the realistic commute time and amenity access for the typical tenant pool here? Any planned neighborhood developments (good or bad) we should know about?
- What's the average days-on-market for RENTAL listings here right now (not sales)? A rising rental-DOM trend means longer vacancies and softer asking-rent achievability than the comps imply.
- What's the recent tenant-quality profile in this submarket — average credit score on applications, eviction rate, late-payment / NSF rate, and stable-employment percentage? A property-management company in the area should have these aggregated.
- How much new for-sale + rental construction is in the pipeline within 1–3 miles? Heavy new supply typically softens prices + rents 12–24 months out; constrained supply supports both.
Investment metrics
- 1% rule
- 0.87% ✗
- Cap rate
- 6.79%
- Cash-on-cash
- 1.79%
- DSCR
- 1.08
- GRM
- 9.6
CMA / ARV
- ARV (on-the-fly)
- $176,778
- Comps found
- 12
Show comp detail 12 sales within ~0.75 mi
| Address | Dist | Beds/Ba | Sqft | Sold | Price | $/sf | Match |
|---|---|---|---|---|---|---|---|
| 2207 5th St E | 0.16mi | 3/2.0 (+1) | 1,120 (+2%) | 5mo | $325,000 | $290 | 76 |
| 2124 3rd St E | 0.12mi | 2/1.0 | 972 (-12%) | 5mo | $247,000 | $254 | 71 |
| 390 301 Blvd W Unit 12D | 0.62mi | 2/2.0 | 1,118 (+2%) | 1mo | $133,200 | $119 | 63 |
| 390 301 Blvd W Unit 12A | 0.62mi | 2/2.0 | 1,118 (+2%) | 3mo | $139,000 | $124 | 62 |
| 390 301 Blvd W Unit 17C | 0.62mi | 2/2.0 | 1,125 (+2%) | 4mo | $105,000 | $93 | 60 |
| 390 301 Blvd W Unit 11A | 0.62mi | 2/2.0 | 1,118 (+2%) | 5mo | $137,000 | $123 | 60 |
| 390 301 Blvd W Unit 28D | 0.62mi | 2/2.0 | 1,125 (+2%) | 6mo | $100,000 | $89 | 58 |
| 842 31st Ave E | 0.51mi | 3/2.0 (+1) | 1,065 (-3%) | 9mo | $320,000 | $300 | 55 |
| 838 31st Ave E | 0.50mi | 3/2.0 (+1) | 1,065 (-3%) | 13mo | $330,000 | $310 | 52 |
| 808 20th Ave W | 0.68mi | 3/1.0 (+1) | 1,112 (+1%) | 12mo | $179,000 | $161 | 51 |
| 390 301 Blvd W Unit 5C | 0.62mi | 2/1.5 | 1,060 (-4%) | 15mo | $195,000 | $184 | 51 |
| 2406 10th St W | 0.73mi | 3/2.0 (+1) | 1,144 (+4%) | 7mo | $165,000 | $144 | 44 |
Match score weights: distance 35% · size 25% · config 20% · recency 20%. Top-matched comps best support the ARV.
Projected returns pro-forma
-3.0% appreciation · 0.0% rent growth · sell at horizon
- IRR
- -16.7%
- Equity multiple
- 0.42×
- Total profit
- $-32,041
- Equity at exit
- $29,672
- IRR
- -14.7%
- Equity multiple
- 0.27×
- Total profit
- $-40,757
- Equity at exit
- $17,206
Cash invested: $55,720 (down + closing). Projections, not guarantees.
Landlord ↔ Tenant lean methodology
- Overall (STATE)
- 87 Strongly Landlord-Friendly
- State Florida
- 87 Strongly Landlord-Friendly · R+3
- County
- — inherits STATE
- City
- — inherits STATE
ZIP-level market 34208
- Rents YoY
- -5.4%
- Active inventory
- 351
- Price-to-rent
- 9.6×
Monthly cashflow live
- Estimated rent
- $1,726 high interval (Pro) →
- Mortgage (P&I)
- −$1,044
- Tax from tax record
- −$154 /mo · $1,843/yr
- Insurance
- −$83
- HOA
- −$0
- Vacancy / Maint / Mgmt
- −$362
- Net cashflow
- $83
Break-even live
Sensitivity live
| Price | -10% $196 | -5% $139 | +0% $83 | +5% $27 | +10% $-30 |
|---|---|---|---|---|---|
| Rent | -10% $-53 | -5% $15 | +0% $83 | +5% $151 | +10% $219 |
| Rate | -1.0pp $183 | -0.5pp $134 | base $83 | +0.5pp $32 | +1.0pp $-21 |
UW: 25.0% down · 7.5% · 30yr · 1.5% tax · 5.0% vac · 8.0% maint · 8.0% mgmt
Financing live
Cash to close
- Down payment
- $49,750
- Closing costs
- $5,970
- Reserves months
- —
- Total cash needed
- —
Loan-product check · same deal, 3 products live
Conventional
25% down · 7.5% · 30yr
- Down + closing
- —
- Monthly P&I
- —
- Monthly cashflow
- —
- DSCR
- —
- Eligible?
- —
Personal DTI + credit; lowest rate.
DSCR
20% down · 8.5% · 30yr
- Down + closing
- —
- Monthly P&I
- —
- Monthly cashflow
- —
- DSCR
- —
- Eligible?
- —
No personal income docs; deal must DSCR.
Hard money
10% down · 12.0% · 12mo
- Down + closing
- —
- Monthly P&I
- —
- Monthly cashflow
- —
- DSCR
- —
- Eligible?
- —
Short-term bridge; refi at stabilization.
Rent comps 40 comps
| Address | Beds | Baths | Sqft | Rent | $/sqft | DOM | Units | Dist |
|---|---|---|---|---|---|---|---|---|
| 313 24th Ave E Bradenton, FL | 3.0 | 2.0 | 1260 | $2,400 | $1.90 | 25d | 1 | 0.06mi |
| 505 22nd Ter E Bradenton, FL | 3.0 | 2.0 | 1039 | $1,989 | $1.91 | 4d | 1 | 0.17mi |
| 718 26th Ave E Bradenton, FL | 2.0 | 1.0 | 750 | $1,600 | $2.13 | 25d | 1 | 0.23mi |
| 712 26th Ave E Bradenton, FL | 2.0 | 1.0 | 750 | $1,600 | $2.13 | 25d | 1 | 0.23mi |
| 2402 9th St E Bradenton, FL | 2.0 | 1.0 | 1137 | $2,000 | $1.76 | 25d | 1 | 0.30mi |
| 302 26th Ave W Bradenton, FL | 2.0–3.0 | 2.0 | 1043 | $1,575 | $1.51 | 3d | 23 | 0.34mi |
| 2019 5th St W Bradenton, FL | 1.0–2.0 | 1.0–2.0 | 750 | $1,575 | $2.10 | 5d | 22 | 0.46mi |
| 305 30th Ave W Unit A207 Bradenton, FL | 2.0 | 2.0 | 1050 | $1,400 | $1.33 | 16d | 1 | 0.49mi |
| 305 30th Ave W Bradenton, FL | 1.0–2.0 | 1.5–2.0 | 987 | $1,400 | $1.42 | 25d | 2 | 0.49mi |
| 603 27th Ave W Bradenton, FL | 2.0 | 1.0 | 1365 | $1,250 | $0.92 | 25d | 1 | 0.53mi |
| 425 30th Ave W Unit C308 Bradenton, FL | 2.0 | 2.0 | 924 | $1,590 | $1.72 | 25d | 1 | 0.53mi |
| 616 33rd Ave E Bradenton, FL | 2.0 | 2.0 | 750 | $1,600 | $2.13 | 25d | 1 | 0.54mi |
| 515 30th Ave W Bradenton, FL | 2.0 | 2.0 | 1001 | $1,375 | $1.37 | 17d | 2 | 0.58mi |
| 702 21st Ave W Unit C Bradenton, FL | 2.0 | 1.0 | 1000 | $1,350 | $1.35 | 5d | 1 | 0.61mi |
| 505 30th Ave W Unit E406 Bradenton, FL | 2.0 | 2.0 | 1001 | $1,450 | $1.45 | 25d | 1 | 0.62mi |
| 390 301 Blvd W Bradenton, FL | 2.0 | 2.0 | 1125 | $1,495 | $1.33 | 25d | 1 | 0.64mi |
| 350 34th Avenue Dr E Bradenton, FL | 1.0–3.0 | 1.0–2.0 | 893 | $1,335 | $1.49 | 3d | 6 | 0.64mi |
| 805 22nd Ave W Bradenton, FL | 1.0 | 1.0 | 790 | $1,200 | $1.52 | 25d | 1 | 0.65mi |
| 2244 9th St W Bradenton, FL | 1.0–2.0 | 1.0–2.0 | 768 | $1,323 | $1.72 | 25d | 4 | 0.71mi |
| 1415 23rd Ave E Bradenton, FL | 3.0 | 1.0 | 1288 | $1,600 | $1.24 | 5d | 1 | 0.75mi |
| 1410 21st Ave E Bradenton, FL | 2.0 | 1.0 | 975 | $1,599 | $1.64 | 16d | 1 | 0.76mi |
| 2117 11th St W Bradenton, FL | 1.0 | 1.0 | 850 | $1,295 | $1.52 | 25d | 1 | 0.79mi |
| 2422 11th St W Bradenton, FL | 2.0 | 1.0 | 900 | $1,445 | $1.61 | 25d | 1 | 0.80mi |
| 2017 12th St W Bradenton, FL | 1.0 | 1.0 | 720 | $1,300 | $1.81 | 25d | 1 | 0.85mi |
| 1016 7th St E Bradenton, FL | 3.0 | 2.0 | 1198 | $2,300 | $1.92 | 5d | 1 | 0.87mi |
| 2409 13th St W Apt 2 Bradenton, FL | 2.0 | 1.0 | 770 | $1,175 | $1.53 | 25d | 1 | 0.87mi |
| 907 34th Ave W Unit B Bradenton, FL | 3.0 | 1.0 | 1000 | $1,795 | $1.79 | 25d | 1 | 0.88mi |
| 907 34th Ave W Bradenton, FL | 3.0 | 1.0 | 985 | $1,599 | $1.62 | 21d | 1 | 0.88mi |
| 2127 13th St W Unit B Bradenton, FL | 1.0 | 1.0 | 700 | $1,149 | $1.64 | 25d | 1 | 0.88mi |
| 919 34th Ave W Bradenton, FL | 3.0 | 1.0 | 950 | $1,599 | $1.68 | 13d | 1 | 0.90mi |
| 1701 13th St W Apt A Bradenton, FL | 2.0 | 1.0 | 850 | $1,395 | $1.64 | 4d | 1 | 0.95mi |
| 3808 11th St E Bradenton, FL | 2.0 | 1.0 | 850 | $1,600 | $1.88 | 25d | 1 | 0.96mi |
| 1319 18th Ave W Bradenton, FL | 3.0 | 2.0 | 1185 | $1,795 | $1.51 | 25d | 1 | 0.98mi |
| 1501 13th St W Bradenton, FL | 1.0 | 1.0 | 1050 | $1,199 | $1.14 | 25d | 1 | 1.01mi |
| 1418 18th Avenue Dr W Unit 1418 Bradenton, FL | 3.0 | 2.0 | 1000 | $1,900 | $1.90 | 25d | 1 | 1.02mi |
| 1167 42nd Ter E Bradenton, FL | 3.0 | 2.0 | 1274 | $2,025 | $1.59 | 21d | 1 | 1.06mi |
| 723 44th Ave E Unit 5 Bradenton, FL | 2.0 | 1.5 | 1350 | $1,650 | $1.22 | 17d | 1 | 1.09mi |
| 1505 18th Avenue Dr W Bradenton, FL | 3.0 | 1.0 | 886 | $1,875 | $2.12 | 17d | 1 | 1.10mi |
| 1308 36th Ave W Bradenton, FL | 1.0 | 1.0 | 715 | $1,199 | $1.68 | 25d | 1 | 1.10mi |
| 1515 15th St W Bradenton, FL | 1.0 | 1.0 | 900 | $1,300 | $1.44 | 25d | 1 | 1.11mi |
Listing history 34 events
-
2026-06-22days on market $199,000 Active 104 DOM
-
2026-06-18days on market $199,000 Active 101 DOM
-
2026-06-17days on market $199,000 Active 100 DOM
-
2026-06-16days on market $199,000 Active 99 DOM
-
2026-06-15days on market $199,000 Active 98 DOM
-
2026-06-13days on market $199,000 Active 96 DOM
-
2026-06-13days on market $199,000 Active 95 DOM
-
2026-06-10days on market $199,000 Active 93 DOM
-
2026-06-09days on market $199,000 Active 92 DOM
-
2026-06-08days on market $199,000 Active 91 DOM
-
2026-06-08days on market $199,000 Active 90 DOM
-
2026-06-03days on market $199,000 Active 86 DOM
-
2026-06-02days on market $199,000 Active 85 DOM
-
2026-06-01days on market $199,000 Active 84 DOM
-
2026-05-31days on market $199,000 Active 83 DOM
-
2026-03-09$199,000 Active
-
2021-11-19soldstatus $85,000
-
2014-12-23soldstatus $43,700
-
2014-05-28soldstatus $30,000 Sold 167-char remark
Show marketing remark (167 chars)
Cute and nicely maintained 2 bedroom, 2 one bath with tenant in place. Great investment with immediate income. Buyer to confirm all data, room sizes, taxes, utilities.
-
2014-05-06status Pending 167-char remark
Show marketing remark (167 chars)
Cute and nicely maintained 2 bedroom, 2 one bath with tenant in place. Great investment with immediate income. Buyer to confirm all data, room sizes, taxes, utilities.
-
2014-04-14historical Contingent - Inspections 167-char remark
Show marketing remark (167 chars)
Cute and nicely maintained 2 bedroom, 2 one bath with tenant in place. Great investment with immediate income. Buyer to confirm all data, room sizes, taxes, utilities.
-
2014-02-12$45,000 Active 167-char remark
Show marketing remark (167 chars)
Cute and nicely maintained 2 bedroom, 2 one bath with tenant in place. Great investment with immediate income. Buyer to confirm all data, room sizes, taxes, utilities.
-
2008-08-06historical
-
2008-06-03$59,900
-
2008-03-03historical
-
2008-01-10$85,900
-
2006-02-08soldstatus $174,000
-
2005-04-25soldstatus $76,000
-
2005-03-07$73,900
-
2003-09-02soldstatus $84,000
-
1998-11-20soldstatus $49,300
-
1996-03-28soldstatus $35,000
-
1995-06-30soldstatus $33,000
-
1991-05-01soldstatus $37,000
ⓘ Source: listings_history table (triggers on properties + properties_extension) + one-shot
backfill from property_details.listing_events for pre-trigger history.
Tax reassessment forecast FL · Resets to sale price
- Current annual tax
- $1,843 · $154/mo
- Projected year-2 tax
- $1,843 · $154/mo
- Expected delta
- $0/yr ($0/mo · 0.0%)
ⓘ Screening estimate from a state-policy table — verify with the county assessor before closing.
Climate risk First Street
- Flood 1/10 Low FEMA zone X (unshaded) · 0% chance over 30 yrs
- Wildfire 1/10 Low
- Heat 10/10 Extreme 7 d/yr ≥107°F today · 30 d/yr by 30 yrs out
- Wind 10/10 Extreme 99% chance of damaging wind over 30 yrs
- Air quality 3/10 Moderate 2 unhealthy d/yr today · 2 by 30 yrs out
Nearby sold comps map
Loading sold comps map…
Walkable amenities ~0.75 mi
Loading nearby amenities…
Taxation est. · year 1
- Rental income
- $20,707
- − Mortgage interest
- −$11,147
- − Property taxes
- −$1,843
- − Insurance
- −$995
- − Repairs & maintenance
- −$1,657
- − Management
- −$1,657
- − Depreciation
- −$5,789
- Taxable loss
- −$2,380
- Est. tax savings @ 24.0%
- +$571
- After-tax cash flow
- $1,569/yr
For passive investors: Depreciation is non-cash, so a rental often shows a tax loss while cash-flowing — sheltering income. Rental losses are passive: they offset passive income freely, and up to $25,000/yr can offset ordinary (W-2) income if you actively participate and your MAGI is under $100k (phasing out to $0 by $150k); unused losses carry forward. On sale, claimed depreciation is recaptured at up to 25%, and gains may owe capital-gains tax (a 1031 exchange can defer both). Figures are a year-1 estimate at your 24.0% rate — not tax advice; consult a CPA.
Schools (NCES district)
- District
- Manatee
- NCES district ID
- 1201230
- Math proficiency
- 54% ▼ -6.00%
- Reading proficiency
- 50% ▼ -2.00%
- Median HH income
- $49,607
- Composite
- 44.43/100
- National rank
- #2806
- State rank
- #26 of 73 in FL
Livability — West Samoset
- Score
- 72/100
- State rank
- #342
- US rank
- #5939
Category grades
Schools grade is shown separately in the Schools card above.
Census & demographics
- Census place
- West Samoset, FL
- County
- Manatee County · 416,364 people
- Metro
- North Port-Sarasota-Bradenton, FL
- Population (ZIP)
- 44,004
- Household income
- $60,504
- Rent vs Own
- Severe rent burden
- 1777.0
Population outlook (Manatee County) Hauer SSP2
- Today (2025)
- 447,342 people
- By 2030
- 488,911 · +9.3%
- By 2040
- 567,934 · +27.0%
- By 2050
- 637,995 · +42.6%
- By 2075
- 781,970 · +74.8%
- By 2100
- 848,272 · +89.6%
Race, ethnicity, and origin ACS 2023
- Neighborhood character
- Diverse neighborhood (Simpson 0.67)
- Race & ethnicity
- White 43% Hispanic / Latino 33% Black 18% Two or more races 16% Asian 2%
- Hispanic origin (detail)
- Mexican 18% Puerto Rican 3% Cuban 2% Dominican 2%
- Common ancestry
- Hispanic 2% Iranian 2% Lithuanian 1%
- Foreign-born
- 20% · Canada, Jamaica, China
- Languages at home
- 67% English-only · Spanish 27% French/Haitian/Cajun 3% Other Indo-European 1%
Political lean MEDSL · Manatee
- 2024 margin
- Strong R (+23.5) · D 37.9% · R 61.4%
- 2008→2024 swing
- -16.5pp toward R · 2008: -7.0pp · 2024: -23.5pp
- All cycles
- 2024: R+23.5 2020: R+16.1 2016: R+17.1 2012: R+12.5 2008: R+7.0
Not yet ingested
- Civics
- —
Market trends
- HPI YoY
- ▼ -353.49%
- Current HPI
- 287.0443
- Rent YoY
- ▼ -5.44%
- Metro
- North Port-Sarasota-Bradenton, FL
- State GDP YoY
- ▲ 3.28%
- F500 in state
- 36
Industry mix (Fortune 500 HQ in FL)
| Industry | F500 HQs | Revenue |
|---|---|---|
| Industrial Technology | 2 | $29B |
|
||
| Insurance | 2 | $17B |
|
||
| Retail | 1 | $60B |
|
||
| Technology Distribution | 1 | $58B |
|
||
| Homebuilding | 1 | $35B |
|
||
| Technology Manufacturing | 1 | $35B |
|
||
Price history
+437.8% since first listed19 events — show timeline
- 2026-03-09 Listed $199,000 Stellar MLS as Distributed by MLS Grid
- 2021-11-19 Sold (Public Records) $85,000 Public Records
- 2014-12-23 Sold (Public Records) $43,700 Public Records
- 2014-05-28 Sold (MLS) $30,000 Stellar MLS as Distributed by MLS Grid
- 2014-05-06 Pending — Stellar MLS as Distributed by MLS Grid
- 2014-04-14 Contingent — Stellar MLS as Distributed by MLS Grid
- 2014-02-12 Listed $45,000 Stellar MLS as Distributed by MLS Grid
- 2008-08-06 Listing Removed — Stellar MLS as Distributed by MLS Grid
- 2008-06-03 Listed $59,900 Stellar MLS as Distributed by MLS Grid
- 2008-03-03 Listing Removed — Stellar MLS as Distributed by MLS Grid
- 2008-01-10 Listed $85,900 Stellar MLS as Distributed by MLS Grid
- 2006-02-08 Sold (Public Records) $174,000 Public Records
- 2005-04-25 Sold (MLS) $76,000 Stellar MLS as Distributed by MLS Grid
- 2005-03-07 Listed $73,900 Stellar MLS as Distributed by MLS Grid
- 2003-09-02 Sold (Public Records) $84,000 Public Records
- 1998-11-20 Sold (Public Records) $49,300 Public Records
- 1996-03-28 Sold (Public Records) $35,000 Public Records
- 1995-06-30 Sold (Public Records) $33,000 Public Records
- 1991-05-01 Sold (Public Records) $37,000 Public Records
Property tax history
+9.6%/yrLatest (2025): $1,843 · -1.4% YoY. Source: county tax records.
Cash-flow waterfall
monthlySold comps — $/sqft
last 12 mo · ≤1 miLoading sold comps…