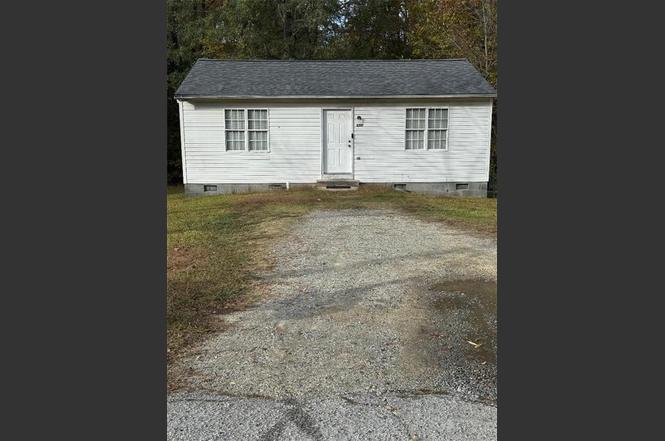
2317 Purdy Ave · High Point, NC
Flood risk 1/10 · Minimal
- FEMA flood zone
- X (unshaded)
- Chance of flooding over 30 yrs
- 0.0%
- Est. flood insurance / yr
- $507 – $1,088
Fire risk 1/10 · Minimal
- Est. fire insurance / yr
- $906 – $1,684
Heat risk 5/10 · Moderate
- Hot days now (above 104°F)
- 7 days/yr
- Hot days in 30 yrs
- 16 days/yr
Wind risk 4/10 · Minor
- Chance of severe wind over 30 yrs
- 15.0%
Air-quality risk 2/10 · Minimal
- Unhealthy air days now
- 1 days/yr
- Unhealthy air days in 30 yrs
- 1 days/yr
Risk factors via First Street. Map © Google.
Why this score? — see what drove the C- grade
The composite is a weighted blend of 9 inputs, each scored 0–100. Each bar is that input's sub-score; the figure is the points it added to the 100-point composite (weight × sub-score).
- Cash flow +18.2/30.0
- ARV discount +9.0/15.0
- DSCR +5.7/10.0
- 1% rule +4.0/10.0
- Livability +3.9/5.0
- Schools +3.6/10.0
- Rent growth +3.4/5.0
- Condition / age +2.5/5.0
- Appreciation +0.0/10.0
$119,900
🖨 Deal sheet 📄 Offer letter ✓ Due diligence
Listing remarks
EXCELLENT INVESTMENT OPPORTUNITY OR STARTER HOME! this 2-bedroom, 1-bath property is ideally situated close to the highway, schools, and downtown High Point. Strong rental potential with easy access to local amenities and employment centers.
Key facts
- Near the highway
- Conveniently located
- 9,147 sq ft lot
Tags
Property features AI
Finance
- HOA & community: No homeowners association; Subdivision: D.D. Kersey
Exterior
- Parking: Driveway parking
- Utilities: Public water; Public sewer; Electric water heater
- Home design: Residential stick/site-built house; One-story home; Built in 1997
- Construction: Vinyl siding; Existing structure
- Exterior features: Cleared lot; Located on a dead-end street
Interior
- Bedrooms: Layout includes bedrooms (total rooms: 4)
- Bathrooms: 1 full bathroom
- Heating & cooling: Heat pump with natural gas heating; Central air conditioning
- Interior features: Primary bedroom on the main level; Crawl space basement
- Laundry & utility: Electric water heater
Neighborhood map
What this means for you Summary
Snapshot
- This is a 2-bed/1.0-bath single-family listed at $120k.
Deal economics
- At list price, monthly cash flow is $108 ($1k/yr) — positive.
- The deal already cash-flows at list — no discount required.
- To meet the 1% rule (rent ≥ 1% of price), the offer needs to be $108k (9.5% below list).
- Recommended offer: $106k (12.0% below list) — sets the bar for market timing.
- Cap rate 7.4% vs local median 4.0% in High Point — top-decile yield for the area; either an underpriced asset or a hidden risk that comps aren't pricing in. Stress-test before assuming the spread holds.
Location & tenants
- Location reads 77/100 on livability (#31 in NC, #3,084 nationally) — a middle-class / working-renter tenant base. Strengths: commute A+, cost of living A+, housing A+; Watch: schools D+, amenities D, employment D.
- Guilford County Schools (urban): math 39% / reading 45% proficiency, ranked #99 of 178 in NC (top 56%) — families likely to look elsewhere, expect single-tenant / working-renter base with shorter leases.
- Market conditions: Rents rising (+3.6%/yr); 128 active listings in the ZIP; 20 comparable units currently listed for rent nearby; rentals at typical pace (median 23d on market — plan ~3-4 weeks tenant-placement turnaround); lower-income renter base — watch delinquency; 3,843 units permitted in Guilford County in 2024 (2,397 in 5+ unit buildings).
- This rent runs 31% of the median local income ($42k/yr) — at the standard rent-burdened threshold; future hikes will face affordability resistance.
Forward outlook
- Local home prices are declining (-3.0%/yr); year-one equity from $829 of loan paydown is wiped out by about $4k of value loss. Plan a longer hold.
- Guilford County population projected at +26% by 2050 — long-run rental-demand tailwind backs the buy-and-hold thesis.
Negotiation context
- It's been on market 219 days — a 12% lower offer ($106k) is reasonable based on typical stale-listing flexibility.
- Current owner paid $1k; list at $120k implies a 11890% gain — meaningful room to come down on a strong offer.
Risks & watch-outs
- Climate carrying-cost: extreme-heat days projected 7→16/yr by 2055 (HVAC capex compounding) — expect insurance premiums to compound above CPI over the hold.
Questions for the listing agent
- It's been on market 219 days. Have you received any prior offers? Is the seller open to a 12% concession, seller financing, or rate buy-down credit?
- Why hasn't it sold? Are there any deal-killer items the seller is aware of (foundation, flood, title, zoning, code violations)?
- Is there a deadline driving the sale (1031 exchange, divorce, estate, relocation)? That informs how much negotiation room exists.
- Schools are D-rated, which usually means shorter tenancies and higher turnover. Who's the typical renter profile here, and what's been the actual vacancy rate?
- Crime grade is F in this area — have there been break-ins, vandalism, or insurance claims at this property in the last 3 years? What carrier currently insures it and at what premium?
- What's the average days-on-market for RENTAL listings here right now (not sales)? A rising rental-DOM trend means longer vacancies and softer asking-rent achievability than the comps imply.
- What's the recent tenant-quality profile in this submarket — average credit score on applications, eviction rate, late-payment / NSF rate, and stable-employment percentage? A property-management company in the area should have these aggregated.
- How much new for-sale + rental construction is in the pipeline within 1–3 miles? Heavy new supply typically softens prices + rents 12–24 months out; constrained supply supports both.
Investment metrics
- 1% rule
- 0.90% ✗
- Cap rate
- 7.38%
- Cash-on-cash
- 3.87%
- DSCR
- 1.17
- GRM
- 9.2
CMA / ARV
- ARV (on-the-fly)
- $124,000
- Comps found
- 12
Show comp detail 12 sales within ~0.75 mi
| Address | Dist | Beds/Ba | Sqft | Sold | Price | $/sf | Match |
|---|---|---|---|---|---|---|---|
| 1116 Winslow St | 0.28mi | 2/1.0 | 840 (+5%) | 5mo | $120,000 | $143 | 75 |
| 230 Windley St | 0.56mi | 2/1.0 | 797 (-0%) | 3mo | $140,000 | $176 | 71 |
| 1423 E Commerce Ave | 0.46mi | 3/2.0 (+1) | 796 (-0%) | 3mo | $158,000 | $198 | 67 |
| 1701 Franklin Ave | 0.29mi | 2/1.0 | 840 (+5%) | 14mo | $76,000 | $90 | 66 |
| 900 Carter St | 0.27mi | 2/1.0 | 895 (+12%) | 7mo | $139,900 | $156 | 62 |
| 1229 Franklin Ave | 0.63mi | 2/1.0 | 799 (-0%) | 14mo | $90,000 | $113 | 58 |
| 2410 Friends Ave | 0.63mi | 2/1.0 | 768 (-4%) | 11mo | $128,000 | $167 | 54 |
| 1000 Garrison St | 0.74mi | 3/2.0 (+1) | 816 (+2%) | 9mo | $77,000 | $94 | 46 |
| 1303 Leonard Ave | 0.66mi | 2/1.0 | 686 (-14%) | 4mo | $80,000 | $117 | 42 |
| 2103 Wesley Dr | 0.70mi | 3/1.0 (+1) | 871 (+9%) | 9mo | $135,400 | $155 | 40 |
| 910 Arch St | 0.68mi | 3/1.0 (+1) | 903 (+13%) | 7mo | $105,000 | $116 | 36 |
| 1213 Furlough Ave | 0.70mi | 2/2.0 | 900 (+12%) | 13mo | $200,000 | $222 | 32 |
Match score weights: distance 35% · size 25% · config 20% · recency 20%. Top-matched comps best support the ARV.
Projected returns pro-forma
-3.0% appreciation · 3.64% rent growth · sell at horizon
- IRR
- -9.6%
- Equity multiple
- 0.65×
- Total profit
- $-11,862
- Equity at exit
- $17,877
- IRR
- 0.6%
- Equity multiple
- 1.04×
- Total profit
- $1,339
- Equity at exit
- $10,367
Cash invested: $33,572 (down + closing). Projections, not guarantees.
Landlord ↔ Tenant lean methodology
- Overall (STATE)
- 85 Strongly Landlord-Friendly
- State North Carolina
- 85 Strongly Landlord-Friendly · R+3
- County
- — inherits STATE
- City
- — inherits STATE
ZIP-level market 27260
- Rents YoY
- 3.6%
- Active inventory
- 128
- Price-to-rent
- 9.2×
Monthly cashflow live
- Estimated rent
- $1,084 high interval (Pro) →
- Mortgage (P&I)
- −$629
- Tax from tax record
- −$70 /mo · $837/yr
- Insurance
- −$50
- HOA
- −$0
- Vacancy / Maint / Mgmt
- −$228
- Net cashflow
- $108
Break-even live
UW: 25.0% down · 7.5% · 30yr · 1.5% tax · 5.0% vac · 8.0% maint · 8.0% mgmt
Financing live
Cash to close
- Down payment
- $29,975
- Closing costs
- $3,597
- Reserves months
- —
- Total cash needed
- —
Loan-product check · same deal, 3 products live
Conventional
25% down · 7.5% · 30yr
- Down + closing
- —
- Monthly P&I
- —
- Monthly cashflow
- —
- DSCR
- —
- Eligible?
- —
Personal DTI + credit; lowest rate.
DSCR
20% down · 8.5% · 30yr
- Down + closing
- —
- Monthly P&I
- —
- Monthly cashflow
- —
- DSCR
- —
- Eligible?
- —
No personal income docs; deal must DSCR.
Hard money
10% down · 12.0% · 12mo
- Down + closing
- —
- Monthly P&I
- —
- Monthly cashflow
- —
- DSCR
- —
- Eligible?
- —
Short-term bridge; refi at stabilization.
Rent comps 20 comps
| Address | Beds | Baths | Sqft | Rent | $/sqft | DOM | Units | Dist |
|---|---|---|---|---|---|---|---|---|
| 1701 Franklin Ave High Point, NC | 2.0 | 1.0 | 840 | $1,350 | $1.61 | 23d | 1 | 0.29mi |
| 1416 Furlough Ave High Point, NC | 2.0 | 1.0 | 724 | $950 | $1.31 | 14d | 1 | 0.49mi |
| 223 Woodbury St High Point, NC | 2.0 | 1.0 | 750 | $825 | $1.10 | 23d | 1 | 0.60mi |
| 1235 Franklin Ave High Point, NC | 2.0 | 1.0 | 650 | $750 | $1.15 | 23d | 1 | 0.61mi |
| 1506 Hidden Creek Ter High Point, NC | 3.0 | 2.0 | 1065 | $1,395 | $1.31 | 21d | 1 | 0.75mi |
| 212 Morgan Pl High Point, NC | 2.0 | 1.0 | 560 | $750 | $1.34 | 23d | 1 | 0.79mi |
| 1150 Roberts Ln High Point, NC | 3.0 | 1.0 | 900 | $1,099 | $1.22 | 23d | 1 | 0.79mi |
| 1730 Brooks Ave High Point, NC | 2.0 | 1.0 | 792 | $900 | $1.14 | 18d | 1 | 0.83mi |
| 1109 Garrison St High Point, NC | 2.0 | 1.0 | 768 | $1,100 | $1.43 | 23d | 1 | 0.84mi |
| 104 Lawndale Ave High Point, NC | 3.0 | 1.0 | 884 | $1,395 | $1.58 | 23d | 1 | 0.87mi |
| 1506 Wendell Ave High Point, NC | 3.0 | 1.0 | 1024 | $1,175 | $1.15 | 23d | 1 | 0.93mi |
| 1307 Camden Ave High Point, NC | 3.0 | 1.0 | 875 | $1,500 | $1.71 | 23d | 1 | 1.03mi |
| 509 Ashburn St High Point, NC | 3.0 | 1.0 | 1000 | $795 | $0.80 | 23d | 1 | 1.05mi |
| 511 Saunders Pl Unit B High Point, NC | 2.0 | 1.0 | 913 | $1,050 | $1.15 | 23d | 1 | 1.14mi |
| 419 Hobson St High Point, NC | 3.0 | 1.0 | 840 | $1,150 | $1.37 | 23d | 1 | 1.35mi |
| 312 Ardale Dr High Point, NC | 2.0 | 2.5–3.0 | 1024 | $1,050 | $1.03 | 23d | 2 | 1.37mi |
| 314 Ardale Dr High Point, NC | 2.0 | 2.0–3.0 | 1000 | $1,050 | $1.05 | 23d | 3 | 1.37mi |
| 313 4th St Unit B High Point, NC | 2.0 | 1.0 | 900 | $995 | $1.11 | 23d | 1 | 1.39mi |
| 310 Ardale Dr Unit 1B High Point, NC | 2.0 | 2.0 | 1000 | $1,050 | $1.05 | 23d | 1 | 1.39mi |
| 304 Ardale Dr Unit 1B High Point, NC | 2.0 | 2.5 | 1000 | $1,050 | $1.05 | 23d | 1 | 1.43mi |
Listing history 16 events
-
2026-06-18days on market $119,900 Active 219 DOM
-
2026-06-17days on market $119,900 Active 218 DOM
-
2026-06-16days on market $119,900 Active 217 DOM
-
2026-06-15days on market $119,900 Active 216 DOM
-
2026-06-14days on market $119,900 Active 214 DOM
-
2026-06-10days on market $119,900 Active 211 DOM
-
2026-06-09days on market $119,900 Active 210 DOM
-
2026-06-08days on market $119,900 Active 209 DOM
-
2026-06-07days on market $119,900 Active 208 DOM
-
2026-06-03days on market $119,900 Active 204 DOM
-
2026-06-02days on market $119,900 Active 203 DOM
-
2026-06-01days on market $119,900 Active 202 DOM
-
2026-05-31days on market $119,900 Active 201 DOM
-
2026-05-31days on market $119,900 Active 200 DOM
-
2025-11-11$119,900 Active
-
1988-10-01soldstatus $1,000
ⓘ Source: listings_history table (triggers on properties + properties_extension) + one-shot
backfill from property_details.listing_events for pre-trigger history.
Tax reassessment forecast NC · Resets to sale price
- Current annual tax
- $837 · $70/mo
- Projected year-2 tax
- $983 · $82/mo
- Expected delta
- +$146/yr (+$12/mo · 17.5%)
ⓘ Screening estimate from a state-policy table — verify with the county assessor before closing.
Climate risk First Street
- Flood 1/10 Low FEMA zone X (unshaded) · 0% chance over 30 yrs
- Wildfire 1/10 Low
- Heat 5/10 Major 7 d/yr ≥104°F today · 16 d/yr by 30 yrs out
- Wind 4/10 Moderate 15% chance of damaging wind over 30 yrs
- Air quality 2/10 Low 1 unhealthy d/yr today · 1 by 30 yrs out
Nearby sold comps map
Loading sold comps map…
Walkable amenities ~0.75 mi
Loading nearby amenities…
Taxation est. · year 1
- Rental income
- $13,014
- − Mortgage interest
- −$6,716
- − Property taxes
- −$837
- − Insurance
- −$600
- − Repairs & maintenance
- −$1,041
- − Management
- −$1,041
- − Depreciation
- −$3,488
- Taxable loss
- −$709
- Est. tax savings @ 24.0%
- +$170
- After-tax cash flow
- $1,470/yr
For passive investors: Depreciation is non-cash, so a rental often shows a tax loss while cash-flowing — sheltering income. Rental losses are passive: they offset passive income freely, and up to $25,000/yr can offset ordinary (W-2) income if you actively participate and your MAGI is under $100k (phasing out to $0 by $150k); unused losses carry forward. On sale, claimed depreciation is recaptured at up to 25%, and gains may owe capital-gains tax (a 1031 exchange can defer both). Figures are a year-1 estimate at your 24.0% rate — not tax advice; consult a CPA.
Schools (NCES district)
- District
- Guilford County Schools
- NCES district ID
- 3701920
- Math proficiency
- 39% ▲ 1.00%
- Reading proficiency
- 45% ▲ 1.00%
- Median HH income
- $46,315
- Composite
- 35.78/100
- National rank
- #4842
- State rank
- #99 of 178 in NC
Livability — High Point
- Score
- 77/100
- State rank
- #31
- US rank
- #3084
Category grades
Schools grade is shown separately in the Schools card above.
Census & demographics
- Census place
- High Point, NC
- County
- Guilford County · 487,190 people
- City population
- 102,450
- Metro
- Greensboro-High Point, NC
- Population (ZIP)
- 25,299
- Household income
- $42,308
- Rent vs Own
- Severe rent burden
- 1005.0
Population outlook (Guilford County) Hauer SSP2
- Today (2025)
- 584,596 people
- By 2030
- 616,851 · +5.5%
- By 2040
- 678,451 · +16.1%
- By 2050
- 734,788 · +25.7%
- By 2075
- 862,985 · +47.6%
- By 2100
- 948,704 · +62.3%
Race, ethnicity, and origin ACS 2023
- Neighborhood character
- Diverse neighborhood (Simpson 0.67)
- Race & ethnicity
- Black 51% Hispanic / Latino 20% White 15% Asian 10% Two or more races 10%
- Hispanic origin (detail)
- Mexican 12% Puerto Rican 1%
- Common ancestry
- Hispanic 1% Serbian 1% Italian 1%
- Foreign-born
- 17% · Canada, Philippines, Dominican Republic
- Languages at home
- 71% English-only · Spanish 17% Other Indo-European 4% Other Asian/Pacific 4%
Political lean MEDSL · Guilford
- 2024 margin
- Strong D (+21.8) · D 60.2% · R 38.4% · Other 1.4%
- 2008→2024 swing
- +3.5pp toward D · 2008: 18.4pp · 2024: 21.8pp
- All cycles
- 2024: D+21.8 2020: D+23.1 2016: D+20.0 2012: D+16.5 2008: D+18.4
Not yet ingested
- Civics
- —
Market trends
- HPI YoY
- ▼ -107.22%
- Current HPI
- 159.2101
- Rent YoY
- ▲ 3.64%
- Metro
- Greensboro-High Point, NC
- State GDP YoY
- ▲ 3.28%
- F500 in state
- 26
Industry mix (Fortune 500 HQ in NC)
| Industry | F500 HQs | Revenue |
|---|---|---|
| Financial Services | 2 | $213B |
|
||
| Retail | 2 | $95B |
|
||
| Industrial Conglomerate | 1 | $38B |
|
||
| Metals / Steel | 1 | $35B |
|
||
| Utilities | 1 | $30B |
|
||
| Industrial Machinery | 1 | $19B |
|
||
Price history
+11890.0% since first listed2 events — show timeline
- 2025-11-11 Listed $119,900 Triad MLS
- 1988-10-01 Sold (Public Records) $1,000 Public Records
Property tax history
-0.9%/yrLatest (2025): $837 · -0.8% YoY. Source: county tax records.
Cash-flow waterfall
monthlySold comps — $/sqft
last 12 mo · ≤1 miLoading sold comps…