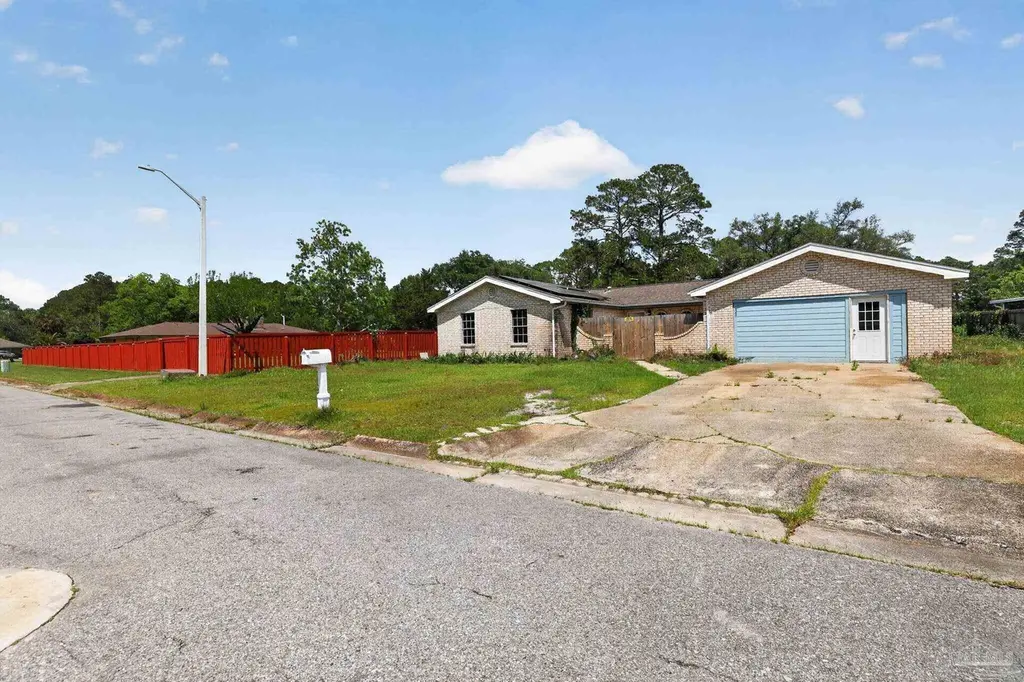
420 Chanterelle Dr · Myrtle Grove, FL
Flood risk 1/10 · Minimal
- FEMA flood zone
- X (unshaded)
- Chance of flooding over 30 yrs
- 0.0%
- Est. flood insurance / yr
- $507 – $1,088
Fire risk 3/10 · Minor
- Est. fire insurance / yr
- $947 – $1,759
Heat risk 10/10 · Severe
- Hot days now (above 105°F)
- 5 days/yr
- Hot days in 30 yrs
- 17 days/yr
Wind risk 9/10 · Severe
- Chance of severe wind over 30 yrs
- 99.0%
Air-quality risk 1/10 · Minimal
- Unhealthy air days now
- 0 days/yr
- Unhealthy air days in 30 yrs
- 0 days/yr
Risk factors via First Street. Map © Google.
Why this score? — see what drove the B grade
The composite is a weighted blend of 9 inputs, each scored 0–100. Each bar is that input's sub-score; the figure is the points it added to the 100-point composite (weight × sub-score).
- Cash flow +28.4/30.0
- ARV discount +15.0/15.0
- DSCR +10.0/10.0
- 1% rule +7.2/10.0
- Schools +3.6/10.0
- Rent growth +3.5/5.0
- Livability +3.2/5.0
- Condition / age +2.5/5.0
- Appreciation +0.0/10.0
$159,900
🖨 Deal sheet (PDF) 📄 Offer letter ✓ Due diligence
Listing remarks MLS
"Home being sold in AS IS Condition "ALL MEASURMENTS ARE ESTIMATED IF REAL IMPORTANT BUYER TO SATISFY HIMSELF. PLAN USED TO HAVE FORMAL AREA'S SEP. WE REMODELED AND NOW IT IS A LARGE GREAT ROOM. WONDER FUL FOR LARGE FAMILY. THIS HOME ADORNS LARGE ROOMS AND LARGE BEDROOMS AND THE MASTER HAS HUGE WALK IN CLOSET AND DBLE VAINITY AT ONE END OF THE HALLWAY PRESENTING LOTS OF PRIVACY. WE ALSO OFFER ALL THE OTHER BEDROOMS ARE PREMIUM SIZE AND OPEN KITCHEN WITH LARGE BREAKFAST BAR, WHICH SEPARATES THE FAMILY GRT. RM. FROM THE KITCHEN AND DINNING AREAS. LOTS OF CABINETS AND ALL FEATURED BY LAMITE WOOD FLOORING WHICH WAS PUT IN DURRING THE OTHER UPDATED FOR EASY TO KEEP AND NO ALERGY PROBLEMS.
Key facts
- Masonry fireplace
- Covered patio
- Brick ranch
Tags
Property features AI
Finance
- Other: Road maintenance handled by county
- HOA & community: No homeowners association
Exterior
- Parking: Attached 2-car garage; Two covered parking spaces (total 2 parking spaces)
- Utilities: Electric with circuit breakers; No public water or sewer
- Home design: One-story property; Resale home; Not attached to other properties; New construction flag present
- Construction: Block construction; Slab foundation; Built as a single-level (one) residence; Total building area approximately 1,776 square feet
- Exterior features: Shingle roof; Paved, county-maintained road access; Lot approximately 0.26 acres; No water/sewer service indicated
Interior
- Kitchen: Kitchen located on the first floor
- Bedrooms: Master bedroom on the first floor, approximately 16' x 14'
- Flooring: Carpet
- Bathrooms: Two full bathrooms (all on the first floor)
- Heating & cooling: Central air conditioning; Natural gas heating; Fireplace heating
- Interior features: Carpet flooring; Fireplace
Neighborhood map
What this means for you Summary
Snapshot
- This is a 4-bed/2.0-bath single-family listed at $160k.
Deal economics
- At list price, monthly cash flow is $518 ($6k/yr) — positive.
- The deal already cash-flows at list — no discount required.
- Meets the 1% rule at list price ($2k rent vs $160k).
- Recommended offer: $155k (3.0% below list) — sets the bar for market timing.
- Cap rate 10.2% vs local median 5.1% in Myrtle Grove — top-decile yield for the area; either an underpriced asset or a hidden risk that comps aren't pricing in. Stress-test before assuming the spread holds.
Location & tenants
- Location reads 64/100 on livability (#701 in FL) — a middle-class / working-renter tenant base. Strengths: cost of living A+, housing A+, health & safety B+; Watch: schools D-, amenities F, commute F.
- Escambia (suburban): math 40% / reading 45% proficiency, ranked #56 of 73 in FL (top 77%) — families likely to look elsewhere, expect single-tenant / working-renter base with shorter leases.
- Market conditions: Rents rising (+3.9%/yr); 270 active listings in the ZIP; 7 comparable units currently listed for rent nearby; rentals at typical pace (median 24d on market — plan ~3-4 weeks tenant-placement turnaround); 1,479 units permitted in Escambia County in 2024 (0 in 5+ unit buildings).
- This rent runs 37% of the median local income ($62k/yr) — at the standard rent-burdened threshold; future hikes will face affordability resistance.
Forward outlook
- Local home prices are declining (-3.0%/yr); year-one equity from $1k of loan paydown is wiped out by about $5k of value loss. Plan a longer hold.
- Escambia County population projected at +13% by 2050 — modest demand growth; plan on rents tracking national, not racing it.
- At projected returns (-3.0% appreciation + 3.9% rent growth), your $45k cash investment doubles in ~8 years — after that, you're playing with house money.
Negotiation context
- It's been on market 39 days — a 3% lower offer ($155k) is reasonable based on typical stale-listing flexibility.
- 2 sale attempts since 10y ago; this cycle's ask has dropped $25k (14%) from the opening price — seller is motivated, your offer sets the floor, not the list.
- Current owner paid $111k; 44% above their basis — modest negotiation headroom, anchor on the comps not their cost.
Risks & watch-outs
- Climate carrying-cost: severe wind risk, 99% chance of damaging wind over 30y; extreme-heat days projected 5→17/yr by 2055 (HVAC capex compounding) — expect insurance premiums to compound above CPI over the hold.
Questions for the listing agent
- It's been on market 39 days. Have you received any prior offers? Is the seller open to a 3% concession, seller financing, or rate buy-down credit?
- Built in 1976 — when were the roof, HVAC, electrical panel, plumbing, and water heater last replaced?
- Is there a deadline driving the sale (1031 exchange, divorce, estate, relocation)? That informs how much negotiation room exists.
- Schools are D-rated, which usually means shorter tenancies and higher turnover. Who's the typical renter profile here, and what's been the actual vacancy rate?
- What's the average days-on-market for RENTAL listings here right now (not sales)? A rising rental-DOM trend means longer vacancies and softer asking-rent achievability than the comps imply.
- What's the recent tenant-quality profile in this submarket — average credit score on applications, eviction rate, late-payment / NSF rate, and stable-employment percentage? A property-management company in the area should have these aggregated.
- How much new for-sale + rental construction is in the pipeline within 1–3 miles? Heavy new supply typically softens prices + rents 12–24 months out; constrained supply supports both.
Investment metrics
- 1% rule
- 1.22% ✓
- Cap rate
- 10.18%
- Cash-on-cash
- 13.89%
- DSCR
- 1.62
- GRM
- 6.8
CMA / ARV
- ARV (median comp)
- $271,772
- List price
- $159,900
- Delta
- -41.16%
- Verdict
- UNDERPRICED
- Comps
- 20 within 1.0 mi
Show comp detail 12 sales within ~0.75 mi
| Address | Dist | Beds/Ba | Sqft | Sold | Price | $/sf | Match |
|---|---|---|---|---|---|---|---|
| 400 Chanterelle Dr | 0.05mi | 4/2.0 | 1,846 (+4%) | 10mo | $270,000 | $146 | 83 |
| 518 Chanterelle Ct | 0.13mi | 4/2.0 | 1,850 (+4%) | 13mo | $312,000 | $169 | 76 |
| 508 Chanterelle Dr | 0.10mi | 4/2.0 | 1,920 (+8%) | 10mo | $320,000 | $167 | 73 |
| 8122 Sheffield Pl | 0.33mi | 4/2.0 | 1,966 (+11%) | 3mo | $380,000 | $193 | 65 |
| 201 Camelford Pl | 0.39mi | 4/2.0 | 1,848 (+4%) | 15mo | $256,000 | $139 | 63 |
| 8423 Kause Rd | 0.38mi | 3/2.0 (-1) | 1,850 (+4%) | 10mo | $282,000 | $152 | 62 |
| 7871 Hestia Pl | 0.75mi | 4/2.0 | 1,815 (+2%) | 5mo | $265,000 | $146 | 57 |
| 7889 Chesterfield Rd | 0.61mi | 3/2.5 (-1) | 1,822 (+3%) | 4mo | $239,000 | $131 | 57 |
| 715 N 77th Ave | 0.58mi | 3/2.0 (-1) | 1,755 (-1%) | 12mo | $315,000 | $179 | 56 |
| 8102 Sheffield Pl | 0.35mi | 3/2.0 (-1) | 1,575 (-11%) | 16mo | $250,000 | $159 | 47 |
| 7993 Templeton Rd | 0.63mi | 3/2.0 (-1) | 1,623 (-9%) | 8mo | $247,000 | $152 | 44 |
| 1111 Vega Ct | 0.73mi | 5/2.0 (+1) | 1,916 (+8%) | 8mo | $285,000 | $149 | 42 |
Match score weights: distance 35% · size 25% · config 20% · recency 20%. Top-matched comps best support the ARV.
Projected returns pro-forma
-3.0% appreciation · 3.85% rent growth · sell at horizon
- IRR
- 5.0%
- Equity multiple
- 1.20×
- Total profit
- $8,751
- Equity at exit
- $23,842
- IRR
- 15.2%
- Equity multiple
- 2.27×
- Total profit
- $57,061
- Equity at exit
- $13,825
Cash invested: $44,772 (down + closing). Projections, not guarantees.
Landlord ↔ Tenant lean methodology
- Overall (STATE)
- 87 Strongly Landlord-Friendly
- State Florida
- 87 Strongly Landlord-Friendly · R+3
- County
- — inherits STATE
- City
- — inherits STATE
ZIP-level market 32506
- Home prices YoY
- -22.5%
- Rents YoY
- 3.9%
- Active inventory
- 270
- Price-to-rent
- 6.8×
Monthly cashflow live
- Estimated rent
- $1,953 high interval (Pro) →
- Mortgage (P&I)
- −$839
- Tax from tax record
- −$119 /mo · $1,432/yr
- Insurance
- −$67
- HOA
- −$0
- Vacancy / Maint / Mgmt
- −$410
- Net cashflow
- $518
Break-even live
Sensitivity live
| Price | -10% $609 | -5% $563 | +0% $518 | +5% $473 | +10% $428 |
|---|---|---|---|---|---|
| Rent | -10% $364 | -5% $441 | +0% $518 | +5% $595 | +10% $672 |
| Rate | -1.0pp $599 | -0.5pp $559 | base $518 | +0.5pp $477 | +1.0pp $435 |
UW: 25.0% down · 7.5% · 30yr · 1.5% tax · 5.0% vac · 8.0% maint · 8.0% mgmt
Financing live
Cash to close
- Down payment
- $39,975
- Closing costs
- $4,797
- Reserves months
- —
- Total cash needed
- —
Loan-product check · same deal, 3 products live
Conventional
25% down · 7.5% · 30yr
- Down + closing
- —
- Monthly P&I
- —
- Monthly cashflow
- —
- DSCR
- —
- Eligible?
- —
Personal DTI + credit; lowest rate.
DSCR
20% down · 8.5% · 30yr
- Down + closing
- —
- Monthly P&I
- —
- Monthly cashflow
- —
- DSCR
- —
- Eligible?
- —
No personal income docs; deal must DSCR.
Hard money
10% down · 12.0% · 12mo
- Down + closing
- —
- Monthly P&I
- —
- Monthly cashflow
- —
- DSCR
- —
- Eligible?
- —
Short-term bridge; refi at stabilization.
Rent comps 7 comps
| Address | Beds | Baths | Sqft | Rent | $/sqft | DOM | Units | Dist |
|---|---|---|---|---|---|---|---|---|
| 231 S 69th Ave Pensacola, FL | 4.0 | 3.0 | 2039 | $1,925 | $0.94 | 24d | 1 | 1.08mi |
| 6700 Lake Charlene Dr Pensacola, FL | 4.0 | 2.5 | 1823 | $2,100 | $1.15 | 24d | 1 | 1.20mi |
| 8770 Kennedy Dr Pensacola, FL | 4.0 | 3.0 | 2134 | $2,400 | $1.12 | 24d | 1 | 1.22mi |
| 542 S 72nd Ave Unit C Pensacola, FL | 3.0 | 2.0 | 1300 | $1,400 | $1.08 | 24d | 1 | 1.22mi |
| 7071 Lake Joanne Dr Unit 2C Pensacola, FL | 3.0 | 2.0 | 1300 | $1,400 | $1.08 | 14d | 1 | 1.26mi |
| 7071 Lake Joanne Dr Unit 2A Pensacola, FL | 3.0 | 2.0 | 1300 | $1,400 | $1.08 | 24d | 1 | 1.26mi |
| 9052 Golden Eye Dr Pensacola, FL | 3.0 | 2.5 | 1537 | $1,820 | $1.18 | 24d | 1 | 1.28mi |
Listing history 19 events
-
2026-06-15status $159,900 Pending 39 DOM
-
2026-06-15days on market $159,900 Active 39 DOM
-
2026-06-14days on market $159,900 Active 37 DOM
-
2026-06-10days on market $159,900 Active 34 DOM
-
2026-06-09days on market $159,900 Active 33 DOM
-
2026-06-08days on market $159,900 Active 32 DOM
-
2026-06-07days on market $159,900 Active 31 DOM
-
2026-06-03days on market $159,900 Active 27 DOM
-
2026-06-02days on market $159,900 Active 26 DOM
-
2026-06-01days on market $159,900 Active 25 DOM
-
2026-05-31days on market $159,900 Active 24 DOM
-
2026-05-31days on market $159,900 Active 23 DOM
-
2026-05-14price $179,000 749-char remark
-
2026-05-07$185,000 Active 749-char remark
-
2017-09-25soldstatus $111,000
-
2017-09-22soldstatus $111,000 705-char remark
Show marketing remark (705 chars)
"Home being sold in AS IS Condition "ALL MEASURMENTS ARE ESTIMATED IF REAL IMPORTANT BUYER TO SATISFY HIMSELF. PLAN USED TO HAVE FORMAL AREA'S SEP. WE REMODELED AND NOW IT IS A LARGE GREAT ROOM. WONDER FUL FOR LARGE FAMILY. THIS HOME ADORNS LARGE ROOMS AND LARGE BEDROOMS AND THE MASTER HAS HUGE WALK IN CLOSET AND DBLE VAINITY AT ONE END OF THE HALLWAY PRESENTING LOTS OF PRIVACY. WE ALSO OFFER ALL THE OTHER BEDROOMS ARE PREMIUM SIZE AND OPEN KITCHEN WITH LARGE BREAKFAST BAR, WHICH SEPARATES THE FAMILY GRT. RM. FROM THE KITCHEN AND DINNING AREAS. LOTS OF CABINETS AND ALL FEATURED BY LAMITE WOOD FLOORING WHICH WAS PUT IN DURRING THE OTHER UPDATED FOR EASY TO KEEP AND NO ALERGY PROBLEMS.
-
2016-03-15$129,900 705-char remark
Show marketing remark (705 chars)
"Home being sold in AS IS Condition "ALL MEASURMENTS ARE ESTIMATED IF REAL IMPORTANT BUYER TO SATISFY HIMSELF. PLAN USED TO HAVE FORMAL AREA'S SEP. WE REMODELED AND NOW IT IS A LARGE GREAT ROOM. WONDER FUL FOR LARGE FAMILY. THIS HOME ADORNS LARGE ROOMS AND LARGE BEDROOMS AND THE MASTER HAS HUGE WALK IN CLOSET AND DBLE VAINITY AT ONE END OF THE HALLWAY PRESENTING LOTS OF PRIVACY. WE ALSO OFFER ALL THE OTHER BEDROOMS ARE PREMIUM SIZE AND OPEN KITCHEN WITH LARGE BREAKFAST BAR, WHICH SEPARATES THE FAMILY GRT. RM. FROM THE KITCHEN AND DINNING AREAS. LOTS OF CABINETS AND ALL FEATURED BY LAMITE WOOD FLOORING WHICH WAS PUT IN DURRING THE OTHER UPDATED FOR EASY TO KEEP AND NO ALERGY PROBLEMS.
-
1981-09-01soldstatus $59,400
-
1976-01-01soldstatus $44,900
ⓘ Source: listings_history table (triggers on properties + properties_extension) + one-shot
backfill from property_details.listing_events for pre-trigger history.
Tax reassessment forecast FL · Resets to sale price
- Current annual tax
- $1,432 · $119/mo
- Projected year-2 tax
- $1,432 · $119/mo
- Expected delta
- $0/yr ($0/mo · 0.0%)
ⓘ Screening estimate from a state-policy table — verify with the county assessor before closing.
Climate risk First Street
- Flood 1/10 Low FEMA zone X (unshaded) · 0% chance over 30 yrs
- Wildfire 3/10 Moderate
- Heat 10/10 Extreme 5 d/yr ≥105°F today · 17 d/yr by 30 yrs out
- Wind 9/10 Extreme 99% chance of damaging wind over 30 yrs
- Air quality 1/10 Low 0 unhealthy d/yr today · 0 by 30 yrs out
Nearby sold comps map
Loading sold comps map…
Walkable amenities ~0.75 mi
Loading nearby amenities…
Taxation est. · year 1
- Rental income
- $23,432
- − Mortgage interest
- −$8,957
- − Property taxes
- −$1,432
- − Insurance
- −$800
- − Repairs & maintenance
- −$1,875
- − Management
- −$1,875
- − Depreciation
- −$4,652
- Taxable income
- $3,843
- Est. tax owed @ 24.0%
- −$922
- After-tax cash flow
- $5,295/yr
For passive investors: Depreciation is non-cash, so a rental often shows a tax loss while cash-flowing — sheltering income. Rental losses are passive: they offset passive income freely, and up to $25,000/yr can offset ordinary (W-2) income if you actively participate and your MAGI is under $100k (phasing out to $0 by $150k); unused losses carry forward. On sale, claimed depreciation is recaptured at up to 25%, and gains may owe capital-gains tax (a 1031 exchange can defer both). Figures are a year-1 estimate at your 24.0% rate — not tax advice; consult a CPA.
Schools (NCES district)
- District
- Escambia
- NCES district ID
- 1200510
- Math proficiency
- 40% ▼ -9.00%
- Reading proficiency
- 45% ▼ -4.00%
- Median HH income
- $44,649
- Composite
- 36.04/100
- National rank
- #4773
- State rank
- #56 of 73 in FL
Livability — Myrtle Grove
- Score
- 64/100
- State rank
- #701
- US rank
- #14805
Category grades
Schools grade is shown separately in the Schools card above.
Census & demographics
- Census place
- Myrtle Grove, FL
- County
- Escambia County · 301,722 people
- City population
- 1,170
- Metro
- Pensacola-Ferry Pass-Brent, FL
- Population (ZIP)
- 34,549
- Household income
- $62,486
- Rent vs Own
- Severe rent burden
- 1359.0
Population outlook (Escambia County) Hauer SSP2
- Today (2025)
- 334,637 people
- By 2030
- 345,779 · +3.3%
- By 2040
- 364,828 · +9.0%
- By 2050
- 378,514 · +13.1%
- By 2075
- 403,220 · +20.5%
- By 2100
- 386,125 · +15.4%
Race, ethnicity, and origin ACS 2023
- Neighborhood character
- Diverse neighborhood (Simpson 0.60)
- Race & ethnicity
- White 60% Black 18% Two or more races 11% Hispanic / Latino 6% Asian 6%
- Hispanic origin (detail)
- Mexican 3%
- Common ancestry
- Lithuanian 4% Slovak 2% Italian 2%
- Foreign-born
- 9% · Canada, China, Vietnam
- Languages at home
- 89% English-only · Spanish 4% Tagalog/Filipino 2% Other Indo-European 1%
Political lean MEDSL · Escambia
- 2024 margin
- R (+19.5) · D 39.7% · R 59.2% · Other 1.1%
- 2008→2024 swing
- -0.2pp no change · 2008: -19.3pp · 2024: -19.5pp
- All cycles
- 2024: R+19.5 2020: R+15.1 2016: R+20.6 2012: R+20.6 2008: R+19.3
Not yet ingested
- Civics
- —
Market trends
- HPI YoY
- ▼ -71.86%
- Current HPI
- 247.6085
- Rent YoY
- ▲ 3.85%
- Metro
- Pensacola-Ferry Pass-Brent, FL
- State GDP YoY
- ▲ 3.28%
- F500 in state
- 36
Industry mix (Fortune 500 HQ in FL)
| Industry | F500 HQs | Revenue |
|---|---|---|
| Industrial Technology | 2 | $29B |
|
||
| Insurance | 2 | $17B |
|
||
| Retail | 1 | $60B |
|
||
| Technology Distribution | 1 | $58B |
|
||
| Homebuilding | 1 | $35B |
|
||
| Technology Manufacturing | 1 | $35B |
|
||
Price history
+256.1% since first listed9 events — show timeline
- 2026-06-15 Pending — PARMLS
- 2026-05-22 Price Changed $159,900 PARMLS
- 2026-05-14 Price Changed $179,000 PARMLS
- 2026-05-07 Listed $185,000 PARMLS
- 2017-09-25 Sold (Public Records) $111,000 Public Records
- 2017-09-22 Sold (MLS) $111,000 PARMLS
- 2016-03-15 Listed $129,900 PARMLS
- 1981-09-01 Sold (Public Records) $59,400 Public Records
- 1976-01-01 Sold (Public Records) $44,900 Public Records
Property tax history
+0.4%/yrLatest (2025): $1,432 · +15.2% YoY. Source: county tax records.
Cash-flow waterfall
monthlySold comps — $/sqft
last 12 mo · ≤1 miLoading sold comps…