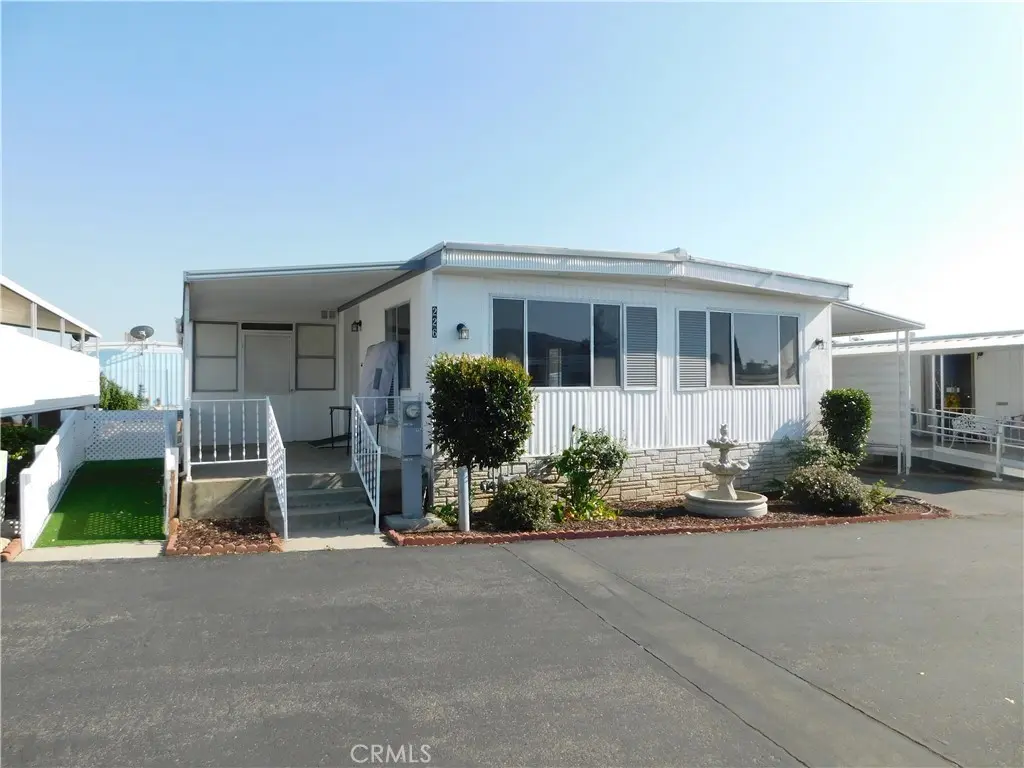
12220 5TH St #226 · Yucaipa, CA
Flood risk 1/10 · Minimal
- FEMA flood zone
- X (unshaded)
- Chance of flooding over 30 yrs
- 0.0%
- Est. flood insurance / yr
- $507 – $1,088
Fire risk 9/10 · Severe
- Est. fire insurance / yr
- $659 – $1,223
Heat risk 6/10 · Moderate
- Hot days now (above 100°F)
- 7 days/yr
- Hot days in 30 yrs
- 20 days/yr
Wind risk 1/10 · Minimal
- Chance of severe wind over 30 yrs
- —
Air-quality risk 10/10 · Severe
- Unhealthy air days now
- 30 days/yr
- Unhealthy air days in 30 yrs
- 37 days/yr
Risk factors via First Street. Map © Google.
Why this score? — see what drove the B grade
The composite is a weighted blend of 9 inputs, each scored 0–100. Each bar is that input's sub-score; the figure is the points it added to the 100-point composite (weight × sub-score).
- Cash flow +30.0/30.0
- ARV discount +11.1/15.0
- 1% rule +10.0/10.0
- DSCR +10.0/10.0
- Schools +3.8/10.0
- Livability +3.3/5.0
- Condition / age +2.5/5.0
- Rent growth +2.2/5.0
- Appreciation +0.0/10.0
$119,900
🖨 Deal sheet (PDF) 📄 Offer letter ✓ Due diligence
Key facts
- Central heating
- Spacious kitchen
- Built-in hutch
Tags
Property features AI
Finance
- Other: Pets allowed; Directions: Enter park, make a right then left; midway make a right; located in cul-de-sac
- Financial info: Located in park (Crestview) — park rules and land lease apply
- HOA & community: Land lease: $397 monthly (park); Suburban community features; Senior community
Exterior
- Parking: Carport (entry at front/carport)
- Utilities: Public sewer; District/public water
- Home design: Mobile home (24' x 56'); Double body type; Single story; Located in a suburban park (Crestview), senior community; Manager approval required
- Construction: Mobile home remains on site; Year built (per assessor)
- Exterior features: Yard; Community pool; Arizona room/patio
Interior
- Kitchen: Refrigerator
- Bedrooms: Single-story (1) mobile home
- Bathrooms: 2 full bathrooms
- Heating & cooling: Central furnace heating; Central cooling; Evaporative cooling
- Interior features: Front/carport entry; Community spa; Arizona room
- Laundry & utility: Dedicated laundry room; Washer included; Dryer included
Neighborhood map
What this means for you Summary
Snapshot
- This is a 2-bed/2.0-bath manufactured listed at $120k.
Deal economics
- At list price, monthly cash flow is $1k ($12k/yr) — positive.
- The deal already cash-flows at list — no discount required.
- Meets the 1% rule at list price ($2k rent vs $120k).
- Recommended offer: $118k (1.5% below list) — sets the bar for market timing.
- Cap rate 16.6% vs local median 2.7% in Yucaipa — top-decile yield for the area; either an underpriced asset or a hidden risk that comps aren't pricing in. Stress-test before assuming the spread holds.
Location & tenants
- Location reads 66/100 on livability (#334 in CA) — a middle-class / working-renter tenant base. Strengths: housing A+, employment B+; Watch: schools D, health & safety D, amenities F.
- Yucaipa-Calimesa Joint Unified (suburban): math 32% / reading 55% proficiency, ranked #195 of 517 in CA (top 38%) — families likely to look elsewhere, expect single-tenant / working-renter base with shorter leases.
- Market conditions: Rents soft (-1.3%/yr); 205 active listings in the ZIP; 10 comparable units currently listed for rent nearby; rentals at typical pace (median 25d on market — plan ~3-4 weeks tenant-placement turnaround); solid renter incomes; 5,458 units permitted in San Bernardino County in 2024 (1,500 in 5+ unit buildings).
- This rent runs 31% of the median local income ($92k/yr) — at the standard rent-burdened threshold; future hikes will face affordability resistance.
Forward outlook
- Local home prices are declining (-3.0%/yr); year-one equity from $829 of loan paydown is wiped out by about $4k of value loss. Plan a longer hold.
- San Bernardino County population projected at +15% by 2050 — modest demand growth; plan on rents tracking national, not racing it.
- At projected returns (-3.0% appreciation + 0.0% rent growth), your $34k cash investment doubles in ~4 years — after that, you're playing with house money.
Negotiation context
- It's been on market 25 days — a 2% lower offer ($118k) is reasonable based on typical stale-listing flexibility.
Risks & watch-outs
- Climate carrying-cost: severe wildfire risk; extreme-heat days projected 7→20/yr by 2055 (HVAC capex compounding) — expect insurance premiums to compound above CPI over the hold.
Questions for the listing agent
- Built in 1969 — when were the roof, HVAC, electrical panel, plumbing, and water heater last replaced?
- Is there a deadline driving the sale (1031 exchange, divorce, estate, relocation)? That informs how much negotiation room exists.
- Schools are D-rated, which usually means shorter tenancies and higher turnover. Who's the typical renter profile here, and what's been the actual vacancy rate?
- What's the average days-on-market for RENTAL listings here right now (not sales)? A rising rental-DOM trend means longer vacancies and softer asking-rent achievability than the comps imply.
- What's the recent tenant-quality profile in this submarket — average credit score on applications, eviction rate, late-payment / NSF rate, and stable-employment percentage? A property-management company in the area should have these aggregated.
- How much new for-sale + rental construction is in the pipeline within 1–3 miles? Heavy new supply typically softens prices + rents 12–24 months out; constrained supply supports both.
Investment metrics
- 1% rule
- 1.96% ✓
- Cap rate
- 16.62%
- Cash-on-cash
- 36.90%
- DSCR
- 2.64
- GRM
- 4.2
CMA / ARV
- ARV (on-the-fly)
- $130,368
- Comps found
- 12
Show comp detail 12 sales within ~0.75 mi
| Address | Dist | Beds/Ba | Sqft | Sold | Price | $/sf | Match |
|---|---|---|---|---|---|---|---|
| 12220 5th St #193 | 0.01mi | 2/2.0 | 1,248 (-7%) | 2mo | $120,000 | $96 | 86 |
| 12220 5th St #187 | 0.00mi | 2/2.0 | 1,296 (-4%) | 12mo | $126,000 | $97 | 84 |
| 12220 5TH St #178 | 0.00mi | 2/2.0 | 1,200 (-11%) | 12mo | $114,900 | $96 | 72 |
| 12367 4th St #71 | 0.54mi | 2/2.0 | 1,296 (-4%) | 3mo | $145,000 | $112 | 66 |
| 12618 3rd St #34 | 0.67mi | 3/2.0 (+1) | 1,344 (0%) | 3mo | $158,000 | $118 | 62 |
| 12618 3rd St #25 | 0.67mi | 2/2.0 | 1,344 (0%) | 10mo | $103,600 | $77 | 60 |
| 12680 4th St #47 | 0.61mi | 3/2.0 (+1) | 1,392 (+4%) | 4mo | $150,000 | $108 | 57 |
| 12680-Spc 38 4th St | 0.61mi | 3/2.0 (+1) | 1,440 (+7%) | 3mo | $97,000 | $67 | 53 |
| 12680 4th St #8 | 0.61mi | 2/2.0 | 1,440 (+7%) | 10mo | $120,000 | $83 | 52 |
| 12367 4th #66 | 0.54mi | 3/2.0 (+1) | 1,543 (+15%) | 4mo | $193,000 | $125 | 42 |
| 12367 4th St Spc 59 | 0.54mi | 3/2.0 (+1) | 1,512 (+12%) | 9mo | $250,000 | $165 | 42 |
| 12680 4th St #36 | 0.60mi | 3/2.0 (+1) | 1,536 (+14%) | 3mo | $90,000 | $59 | 40 |
Match score weights: distance 35% · size 25% · config 20% · recency 20%. Top-matched comps best support the ARV.
Projected returns pro-forma
-3.0% appreciation · 0.0% rent growth · sell at horizon
- IRR
- 29.3%
- Equity multiple
- 2.18×
- Total profit
- $39,448
- Equity at exit
- $17,877
- IRR
- 34.9%
- Equity multiple
- 3.75×
- Total profit
- $92,474
- Equity at exit
- $10,367
Cash invested: $33,572 (down + closing). Projections, not guarantees.
Landlord ↔ Tenant lean methodology
- Overall (STATE)
- 18 Strongly Tenant-Friendly
- State California
- 18 Strongly Tenant-Friendly · D+13
- County
- — inherits STATE
- City
- — inherits STATE
ZIP-level market 92399
- Rents YoY
- -1.3%
- Active inventory
- 205
- Price-to-rent
- 4.2×
Monthly cashflow live
- Estimated rent
- $2,356 high interval (Pro) →
- Mortgage (P&I)
- −$629
- Tax est. 1.5%
- −$150 /mo · $1,798/yr
- Insurance
- −$50
- HOA
- −$0
- Vacancy / Maint / Mgmt
- −$495
- Net cashflow
- $1,032
Break-even live
Sensitivity live
| Price | -10% $1,115 | -5% $1,074 | +0% $1,032 | +5% $991 | +10% $949 |
|---|---|---|---|---|---|
| Rent | -10% $846 | -5% $939 | +0% $1,032 | +5% $1,125 | +10% $1,218 |
| Rate | -1.0pp $1,093 | -0.5pp $1,063 | base $1,032 | +0.5pp $1,001 | +1.0pp $970 |
UW: 25.0% down · 7.5% · 30yr · 1.5% tax · 5.0% vac · 8.0% maint · 8.0% mgmt
Financing live
Cash to close
- Down payment
- $29,975
- Closing costs
- $3,597
- Reserves months
- —
- Total cash needed
- —
Loan-product check · same deal, 3 products live
Conventional
25% down · 7.5% · 30yr
- Down + closing
- —
- Monthly P&I
- —
- Monthly cashflow
- —
- DSCR
- —
- Eligible?
- —
Personal DTI + credit; lowest rate.
DSCR
20% down · 8.5% · 30yr
- Down + closing
- —
- Monthly P&I
- —
- Monthly cashflow
- —
- DSCR
- —
- Eligible?
- —
No personal income docs; deal must DSCR.
Hard money
10% down · 12.0% · 12mo
- Down + closing
- —
- Monthly P&I
- —
- Monthly cashflow
- —
- DSCR
- —
- Eligible?
- —
Short-term bridge; refi at stabilization.
Rent comps 10 comps
| Address | Beds | Baths | Sqft | Rent | $/sqft | DOM | Units | Dist |
|---|---|---|---|---|---|---|---|---|
| 34384 Yucaipa Blvd Unit 102 Yucaipa, CA | 1.0 | 1.0 | 920 | $1,900 | $2.07 | 44d | 1 | 0.39mi |
| 34384 Yucaipa Blvd Yucaipa, CA | 1.0 | 1.0 | 920 | $2,100 | $2.28 | 44d | 2 | 0.40mi |
| 11904 4th St Yucaipa, CA | 2.0 | 1.0 | 1256 | $1,995 | $1.59 | 11d | 1 | 0.59mi |
| 33685 Washington Dr Yucaipa, CA | 3.0 | 3.0 | 1868 | $3,000 | $1.61 | 44d | 1 | 0.62mi |
| 12301 3rd St Yucaipa, CA | 1.0 | 1.0 | 992 | $2,150 | $2.17 | 0d | 1 | 0.70mi |
| 11768 Avalon Ave Yucaipa, CA | 3.0 | 2.5 | 1668 | $2,895 | $1.74 | 2d | 1 | 1.01mi |
| 11811 Fairway Dr Yucaipa, CA | 3.0 | 2.0 | 1458 | $2,800 | $1.92 | 0d | 1 | 1.20mi |
| 12646 10th St Yucaipa, CA | 2.0 | 2.0 | 1413 | $3,900 | $2.76 | 25d | 1 | 1.22mi |
| 12837 2nd St Yucaipa, CA | 3.0–4.0 | 2.5–3.0 | 1688 | $3,450 | $2.04 | 0d | 31 | 1.22mi |
| 35371 Schad Ln Yucaipa, CA | 2.0 | 1.0 | 1000 | $2,200 | $2.20 | 25d | 1 | 1.46mi |
Listing history 15 events
-
2026-06-18days on market $119,900 Active 25 DOM
-
2026-06-17days on market $119,900 Active 24 DOM
-
2026-06-16days on market $119,900 Active 23 DOM
-
2026-06-15days on market $119,900 Active 22 DOM
-
2026-06-13days on market $119,900 Active 20 DOM
-
2026-06-13days on market $119,900 Active 19 DOM
-
2026-06-09days on market $119,900 Active 16 DOM
-
2026-06-08days on market $119,900 Active 15 DOM
-
2026-06-07days on market $119,900 Active 14 DOM
-
2026-06-04days on market $119,900 Active 11 DOM
-
2026-06-03days on market $119,900 Active 10 DOM
-
2026-06-02days on market $119,900 Active 9 DOM
-
2026-06-01days on market $119,900 Active 8 DOM
-
2026-05-31days on market $119,900 Active 7 DOM
-
2026-05-24$119,900 Active
ⓘ Source: listings_history table (triggers on properties + properties_extension) + one-shot
backfill from property_details.listing_events for pre-trigger history.
Climate risk First Street
- Flood 1/10 Low FEMA zone X (unshaded) · 0% chance over 30 yrs
- Wildfire 9/10 Extreme
- Heat 6/10 Major 7 d/yr ≥100°F today · 20 d/yr by 30 yrs out
- Wind 1/10 Low
- Air quality 10/10 Extreme 30 unhealthy d/yr today · 37 by 30 yrs out
Nearby sold comps map
Loading sold comps map…
Walkable amenities ~0.75 mi
Loading nearby amenities…
Taxation est. · year 1
- Rental income
- $28,266
- − Mortgage interest
- −$6,716
- − Property taxes
- −$1,798
- − Insurance
- −$600
- − Repairs & maintenance
- −$2,261
- − Management
- −$2,261
- − Depreciation
- −$3,488
- Taxable income
- $11,141
- Est. tax owed @ 24.0%
- −$2,674
- After-tax cash flow
- $9,713/yr
For passive investors: Depreciation is non-cash, so a rental often shows a tax loss while cash-flowing — sheltering income. Rental losses are passive: they offset passive income freely, and up to $25,000/yr can offset ordinary (W-2) income if you actively participate and your MAGI is under $100k (phasing out to $0 by $150k); unused losses carry forward. On sale, claimed depreciation is recaptured at up to 25%, and gains may owe capital-gains tax (a 1031 exchange can defer both). Figures are a year-1 estimate at your 24.0% rate — not tax advice; consult a CPA.
Schools (NCES district)
- District
- Yucaipa-Calimesa Joint Unified
- NCES district ID
- 0643560
- Math proficiency
- 32% ▼ -4.00%
- Reading proficiency
- 55% ▲ 6.00%
- Median HH income
- $58,243
- Composite
- 38.09/100
- National rank
- #4277
- State rank
- #195 of 517 in CA
Livability — Yucaipa
- Score
- 66/100
- State rank
- #334
- US rank
- #11542
Category grades
Schools grade is shown separately in the Schools card above.
Census & demographics
- Census place
- Yucaipa, CA
- County
- San Bernardino County · 2,030,291 people
- City population
- 55,366
- Metro
- Riverside-San Bernardino-Ontario, CA
- Population (ZIP)
- 55,366
- Household income
- $92,440
- Rent vs Own
- Severe rent burden
- 1110.0
Population outlook (San Bernardino County) Hauer SSP2
- Today (2025)
- 2,300,329 people
- By 2030
- 2,378,907 · +3.4%
- By 2040
- 2,523,137 · +9.7%
- By 2050
- 2,642,388 · +14.9%
- By 2075
- 2,880,769 · +25.2%
- By 2100
- 2,909,436 · +26.5%
Race, ethnicity, and origin ACS 2023
- Neighborhood character
- Diverse neighborhood (Simpson 0.57)
- Race & ethnicity
- White 55% Hispanic / Latino 36% Two or more races 15% Asian 3% Black 2%
- Hispanic origin (detail)
- Mexican 31%
- Common ancestry
- Italian 4% Iranian 2% Lithuanian 2%
- Foreign-born
- 10% · Canada
- Languages at home
- 77% English-only · Spanish 19% Other Indo-European 1% Other Asian/Pacific 1%
Political lean MEDSL · San Bernardino
- 2024 margin
- Toss-up / Even · D 47.5% · R 49.7% · Other 2.8%
- 2008→2024 swing
- -8.5pp toward R · 2008: 6.3pp · 2024: -2.1pp
- All cycles
- 2024: R+2.1 2020: D+10.7 2016: D+9.8 2012: D+5.4 2008: D+6.3
Not yet ingested
- Civics
- —
Market trends
- HPI YoY
- ▼ -632.71%
- Current HPI
- 353.4762
- Rent YoY
- ▼ -1.27%
- Metro
- Riverside-San Bernardino-Ontario, CA
- State GDP YoY
- ▲ 3.21%
- F500 in state
- 116
Industry mix (Fortune 500 HQ in CA)
| Industry | F500 HQs | Revenue |
|---|---|---|
| Technology | 27 | $1,492B |
|
||
| Financial Services | 3 | $174B |
|
||
| Retail | 3 | $44B |
|
||
| Insurance | 3 | $26B |
|
||
| Media / Entertainment | 2 | $115B |
|
||
| Pharmaceuticals / Biotech | 2 | $62B |
|
||
Price history
1 event — show timeline
- 2026-05-24 Listed $119,900 CRMLS
Property tax history
-8.6%/yrLatest (2015): $83 · +0.0% YoY. Source: county tax records.
Cash-flow waterfall
monthlySold comps — $/sqft
last 12 mo · ≤1 miLoading sold comps…